R2.2 How fast? The rate of chemical change · IB Chemistry | Augment Education
R2.2 How fast? The rate of chemical change
Measure rates of reaction and explain them with collision theory, Maxwell–Boltzmann distributions, activation energy and catalysts; HL: mechanisms, rate equations, orders, rate constants and the Arrhenius equation.
IB Chemistry
Part of R2 How much, how fast and how far?
SL and HL
Key terms introduced here
Each is in the Chemistry glossary, with every other term in the subject.
A measure of how much light of a chosen wavelength a solution absorbs; in dilute solution it is proportional to the concentration of the absorbing species.
The constant A in the Arrhenius equation, which takes into account the frequency of collisions with the proper orientation. It has the same units as k.
Notes on R2.2 How fast? The rate of chemical change
85 min readLast reviewed
Questions on R2.2
169 exam-style questions on this subtopic, written in the style of the IB papers. The first has its markscheme open. Counted on
Question 1 · CHEM-003301 mark
Why is a high activation energy a useful property of a fuel?
A
It makes the combustion reaction more exothermic.
B
The fuel does not ignite at room temperature until energy is supplied, for example by a spark.
C
It increases the energy density of the fuel.
D
It ensures that the fuel undergoes complete combustion.
Explanation
A high activation energy means that very few collisions between fuel and oxygen molecules are successful at room temperature, so the fuel can be stored safely in air. A spark or flame supplies the activation energy; after that, the energy released by the reaction keeps it going.
A and C: activation energy does not change ΔH or the energy stored. D: complete combustion depends on the oxygen supply, not on Ea.
The answer is B.
Question 2 · CHEM-003661 mark
The table gives the potential energy of the reactants, the highest point on the reaction pathway and the products for a reaction.
Point on the energy profile
Try a quick-fire question
One of 101 short multiple-choice questions on R2.2. Pick an answer to see why it's right or wrong.
How does a catalyst speed up a reaction?
Flashcards for R2.2
The official deck for this part of the syllabus.
R2.2 How fast? The rate of chemical change · front
Define rate of reaction.
R2.2 How fast? The rate of chemical change · front
The rate of reaction is the change in concentration of […] per unit time.
R2.2 How fast? The rate of chemical change375 cards
From the data booklet
The entries of the chemistry data booklet that R2.2 uses. Each opens in the explained booklet.
The change in concentration (or another measured quantity) divided by the time interval over which it occurs; the gradient of a chord on a graph against time.
A substance that increases the rate of a reaction by providing an alternative reaction pathway with a lower activation energy, and is chemically unchanged at the end of the reaction.
Loss of activity of a heterogeneous catalyst when a substance binds strongly to its surface and blocks the sites where reactants would bind, as lead does in catalytic converters.
A device in a vehicle exhaust in which platinum, palladium and rhodium on a ceramic honeycomb catalyse the conversion of carbon monoxide, unburnt hydrocarbons and nitrogen oxides into carbon dioxide, water and nitrogen.
A reaction set up to give a sudden visible change once a fixed amount of reaction has taken place, so the time taken t measures the rate (rate is proportional to 1/t).
The relative orientation of particles when they collide; only some orientations bring the atoms that must bond into contact, so only those collisions can lead to reaction.
The theory that particles react only when they collide with a combined kinetic energy at least equal to the activation energy and with the proper orientation.
Describes a reactant for which the rate is proportional to its concentration: doubling the concentration doubles the rate. Its concentration falls with a constant half-life.
A catalyst in a different phase from the reactants, usually a solid on whose surface gases or dissolved substances react, such as iron in the Haber process.
Finding orders of reaction by measuring the initial rate in several runs at the same temperature, changing the concentration of one reactant at a time.
A graph of the number of particles against kinetic energy for a sample at one temperature: it starts at the origin, has an asymmetric peak and a tail that never meets the energy axis.
The kinetic energy possessed by the largest number of particles in a sample, at the peak of the Maxwell–Boltzmann distribution; it is slightly lower than the mean kinetic energy.
Stopping the reaction in a sample taken from a reaction mixture, by rapid cooling, large dilution or removing a catalyst or reactant, so that its composition at that moment can be measured.
An unpredictable error that makes repeated measurements scatter either side of the true value; its effect is reduced by repeating measurements and taking a mean.
The constant of proportionality, k, in the rate equation. It is fixed for a given reaction at a given temperature, increases with temperature, and its units depend on the overall order.
A species formed in one elementary step of a mechanism and used up in a later step. It sits in an energy minimum between two transition states and does not appear in the overall equation.
A straight line that touches a curve at one point and has the same gradient as the curve there; its gradient gives the rate at that time on a graph against time.
Describes a reactant whose concentration does not affect the rate: changing its concentration leaves the rate unchanged.
Chemical kinetics is the study of how fast reactions happen and why. Some reactions are over in a fraction of a second, such as the explosion of a hydrogen–oxygen mixture, while others, such as the rusting of iron, take years. Controlling rates matters in industry, where a slow process makes no profit, in food storage, where the aim is to slow down unwanted reactions, and in the body, where enzymes make reactions fast enough to sustain life.
Rate of reaction
As a reaction proceeds, the concentrations of the reactants fall and the concentrations of the products rise. The rate of reaction measures how quickly these changes happen.
The rate of reaction can be written for any one species in the equation. Over a time interval Δt:
rate=ΔtΔ[product]=−ΔtΔ[reactant]
The concentration of a reactant decreases, so Δ[reactant] is negative; the minus sign makes the rate a positive number. A rate is always positive, whichever species is followed.
Because the coefficients in an equation are not all equal, the rate depends on which species is chosen. In the decomposition of hydrogen peroxide,
2HX2OX2(aq)2HX2O(l)+OX2(g)
two moles of HX2OX2 are used up for every mole of OX2 formed. The rate of formation of oxygen is therefore half the rate at which hydrogen peroxide is used up. For this reason a rate is always stated for a named species: "the rate of formation of oxygen" or "the rate of consumption of hydrogen peroxide".
When a quantity other than concentration is measured, the rate takes the units of that quantity per unit time: cm3s−1 for a volume of gas, g s−1 for a loss of mass, or s−1 for an absorbance. The time unit may be seconds, minutes or hours, depending on how fast the reaction is.
How the rate changes during a reaction
The graph of concentration against time for a typical reaction shows that the rate is not constant. Both curves are steepest at the start and become flatter as time passes.
For a reaction in which one reactant particle forms one product particle, the two curves mirror each other. Both are steepest at the start, when the reactant concentration is highest, and both flatten as the reactant is used up.
The rate falls because the reactant is being used up. As its concentration decreases there are fewer reactant particles in each unit of volume, so they collide less often and fewer react each second. The curve becomes horizontal when the limiting reactant has been used up and the reaction stops. The same pattern is seen whatever property is measured: a graph of gas volume or mass lost against time rises steeply at first and then levels off.
Average rate and instantaneous rate
The average rate over a time interval is the total change in concentration divided by the time taken. On a graph it is the gradient of the straight line (the chord) joining the two points at the ends of the interval.
The rate at one particular moment is the instantaneous rate. It equals the gradient of the tangent to the curve at that time: a straight line that touches the curve at that point, with the same slope as the curve there. The rate at the very start of the reaction, the initial rate, is the gradient of the tangent at t=0.
The concentration of hydrogen peroxide during its catalysed decomposition, 2HX2OX2(aq)2HX2O(l)+OX2(g), was measured at intervals.
Time / s
0
60
120
180
240
[HX2OX2] / mol dm−3
0.500
0.390
0.304
0.237
0.185
Finding a rate from a tangent
A student adds 0.39g of powdered calcium carbonate to 50.0cm3 of hydrochloric acid, which is in excess, and collects the carbon dioxide in a gas syringe:
CaCOX3(s)+2HCl(aq)CaClX2(aq)+HX2O(l)+COX2(g)
The graph of gas volume against time rises steeply and levels off at 96cm3, when all the calcium carbonate has reacted. Two tangents are drawn on it, at the start and at 60 s.
The rate at any moment is the gradient of the tangent to the curve at that time. The tangent at t = 0 (blue) gives the initial rate; the shallower tangent at 60 s (orange) shows that the reaction has slowed. The curve levels off when the limiting reactant is used up.
To find the gradient of a tangent:
Draw a straight line that touches the curve at the chosen time without crossing it, so that the curve lies on the same side of the line just before and just after that point.
Extend the line as far as the graph allows. Reading two points far apart reduces the effect of small reading errors.
Read the coordinates of two points on the line (not on the curve) and calculate gradient=Δy/Δx, with units.
A rate measured in cm3s−1 can be converted into a change in concentration per second by using the ideal gas equation and the stoichiometry of the reaction.
Following the rate of a reaction in the laboratory
Concentrations are rarely measured directly while a reaction is running. Instead, a property that changes as the reaction proceeds is measured at regular intervals, and the reaction is followed through that property. The method must suit the reaction: a gas syringe is no use if no gas is produced, and a colorimeter is no use if nothing coloured is formed or used up. Data loggers with gas-pressure, pH, conductivity or light sensors can record readings many times a second, which allows fast reactions to be followed and gives smooth curves.
Collecting a gas
When a gas is produced, its volume can be collected in a gas syringe and read at regular intervals. Displacing water from an upturned measuring cylinder or burette is an alternative for gases that are not very soluble, such as hydrogen and oxygen; carbon dioxide dissolves slightly in water, so a syringe gives more reliable volumes.
Collecting a gas in a gas syringe. The volume is read from the syringe scale at regular time intervals, or logged automatically. A typical syringe holds 100 cm³ and is read to the nearest 1 cm³.
The reactants are usually kept apart until the start, for example by tipping a small tube of solid into the acid or by adding the solid and replacing the bung quickly, so that no gas escapes before the clock starts. Typical reactions followed this way are magnesium or calcium carbonate with hydrochloric acid, and the decomposition of hydrogen peroxide with a catalyst.
Measuring the loss of mass
Following a reaction by loss of mass. Carbon dioxide escapes through the cotton wool plug, so the balance reading falls. The loss of mass at each time equals the mass of gas produced so far.
When a gas escapes from an open flask, the mass of the flask and its contents falls. The loss of mass at each time equals the mass of gas formed. The method works well for a dense gas such as carbon dioxide (M=44.01g mol−1) but poorly for hydrogen (M=2.02g mol−1). The 96cm3 of carbon dioxide from 0.39g of calcium carbonate has a mass of about 0.17g; the same volume of hydrogen has a mass of less than 0.01g, too little to measure on a balance that reads to 0.01g.
Measuring a colour change: colorimetry
If a reactant or product is coloured, the intensity of colour shows its concentration. A colorimeter shines light of one colour through the solution and measures how much is absorbed. The filter is chosen so that the light is the colour the solution absorbs most strongly, which is the complementary colour on the colour wheel in the data booklet: an orange solution absorbs blue light, so a blue filter is used.
A colorimeter passes light of one colour through the reaction mixture. In dilute solutions the absorbance is proportional to the concentration of the coloured species, so a graph of absorbance against time follows the reaction.
The absorbance is proportional to the concentration of the coloured species in dilute solution, so a graph of absorbance against time has the same shape as the concentration–time graph. Absorbances can be converted into concentrations with a calibration curve made from standard solutions of known concentration. Examples of reactions that can be followed by colorimetry are:
bromine with methanoic acid, in which the orange colour of bromine fades: BrX2(aq)+HCOOH(aq)2BrX−(aq)+2HX+(aq)+COX2(g)
iron with copper(II) sulfate solution, in which the blue colour of CuX2+(aq) fades: Fe(s)+CuX2+(aq)FeX2+(aq)+Cu(s)
propanone with iodine in acid solution, in which the brown colour of iodine fades.
Measuring pH, conductivity or pressure
A reaction that uses up or produces hydrogen ions can be followed with a pH probe. A reaction that changes the number or type of ions in solution can be followed by its electrical conductivity. For example, the hydrolysis of 2-bromo-2-methylpropane produces ions from a neutral molecule, so both the acidity and the conductivity of the solution increase as it proceeds:
In a gas-phase reaction at constant volume and temperature, the pressure is proportional to the total amount of gas, so a change in pressure follows any reaction that changes the number of gas molecules, such as 2NX2OX5(g)4NOX2(g)+OX2(g).
Sampling and titration
Samples can be withdrawn from a reaction mixture at intervals and analysed by titration. Each sample is first quenched: the reaction in it is stopped, for example by cooling it rapidly in ice, by diluting it greatly or by removing a catalyst. In the reaction of propanone with iodine, which is catalysed by acid, adding each sample to sodium hydrogencarbonate solution neutralizes the acid catalyst; the iodine left is then titrated with sodium thiosulfate solution. Titration is slower than the other methods but gives concentrations directly.
Timing a fixed amount of reaction
Sometimes it is easier to measure how long it takes for a fixed amount of reaction to happen than to follow the whole reaction. In the reaction of sodium thiosulfate with hydrochloric acid, a pale yellow precipitate of sulfur forms:
The flask stands on a piece of paper marked with a cross, and the time is measured from mixing until the cross can no longer be seen from above. Every run stops at about the same amount of sulfur, so a faster reaction gives a shorter time. The rate is therefore inversely proportional to the time, and 1/t (in s−1) is used as a measure of the rate.
The "disappearing cross" experiment. The clock runs from mixing until the sulfur precipitate hides the cross. Each run stops at about the same amount of sulfur, so a shorter time means a faster reaction.
Clock reactions, in which a sudden colour change appears after a fixed amount of reaction, work on the same principle. The iodine clock, in which a blue-black colour appears suddenly, is a common way of measuring initial rates.
The two kinds of experiment use time differently. When the volume of gas or the mass is read at fixed times, time is the independent variable and the quantity measured is the dependent variable. When the time for a fixed amount of reaction is measured, time is the dependent variable and the factor being investigated is the independent variable.
Method
What is measured
Suitable when
Example
Gas collection
volume of gas against time
a gas is produced
Mg+HCl, HX2OX2 decomposition
Loss of mass
mass of flask and contents against time
a dense gas escapes
CaCOX3+HCl (releases COX2
Colorimetry
absorbance against time
a coloured species is used up or formed
BrX2+HCOOH
pH or conductivity
pH or conductivity against time
[HX+] or the ions in solution change
hydrolysis of 2-bromo-2-methylpropane
Pressure
pressure at constant volume against time
the amount of gas changes
2NX2OX54NOX2+OX2
Sampling and titration
concentration in quenched samples
a species can be titrated
propanone with iodine
Time for a fixed change
time t; rate ∝1/t
a visible change marks a fixed amount of reaction
thiosulfate with acid; clock reactions
Collision theory
The kinetic molecular theory describes matter as particles in constant random motion. Collision theory applies this model to reactions: before two particles can react they must come into contact, and they must do so in a way that allows bonds to break and new bonds to form.
Kinetic energy and temperature
The particles in a gas or a solution move in all directions with a wide range of speeds, colliding constantly with each other and with the walls of the container. Their average kinetic energy depends only on the temperature.
Doubling the absolute temperature doubles the average kinetic energy. Heating a gas from 300K to 600K (27∘C to 327∘C) doubles it, but heating from 20∘C to 40∘C (from 293K to 313K) raises it by only about 7 %. The proportionality holds only on the Kelvin scale, because only there does zero mean zero kinetic energy.
The conditions for a successful collision
In a gas at room temperature and pressure each molecule collides with others billions of times every second. If every collision led to reaction, all gas reactions would be over almost instantly. In fact only a tiny fraction of collisions are successful, meaning that they lead to reaction. Two conditions must be met at the same time:
Sufficient energy. The colliding particles must have a combined kinetic energy at least equal to the activation energy, Ea. This energy is needed to stretch and break bonds in the reactants so that new bonds can form. Particles that collide with less energy than Ea bounce apart unchanged.
Proper orientation. The particles must collide with a suitable geometry, so that the atoms that need to bond come into contact.
The importance of orientation is clear in the reaction of nitrogen monoxide with ozone, which takes place in a single collision. An oxygen atom moves from ozone to the nitrogen atom of NO, so the reaction can happen only if the nitrogen atom meets an end oxygen atom of the ozone molecule.
Collision geometry in NO(g) + O₃(g) → NO₂(g) + O₂(g), a reaction that happens in a single collision. An O atom moves from ozone to the N atom of NO, so only collisions that bring the N atom against an end O atom of O₃ can succeed, even when the energy is high enough. Blue arrows show the directions of motion before the collision.
Orientation, or collision geometry, matters more for large and complex molecules, where the reacting group is only a small part of the molecule. Reactions between single atoms or small ions in solution depend much less on it, because almost any approach brings the reacting particles together correctly. The substitution of a halogenoalkane by a hydroxide ion is a well-known case: the hydroxide ion must approach the carbon atom from the side opposite the halogen atom.
Collision theory leads to a simple rule. The rate of a reaction depends on two things:
the collision frequency, the number of collisions per unit time in a given volume;
the fraction of collisions that are successful, which depends mostly on the fraction with E≥Ea and also on orientation.
Every factor that changes the rate does so by changing one or both of these. Explaining the effect of a change of conditions always comes back to them.
Activation energy and energy profiles
As two reacting particles approach each other with enough energy, their bonds stretch and begin to break while new bonds begin to form. The arrangement of atoms at the point of highest potential energy along this path is the transition state. The energy needed to reach it from the reactants is the activation energy.
An energy profile shows the potential energy of the reacting system as the reaction proceeds. The horizontal axis, the reaction coordinate, represents the progress from reactants to products; it has no scale. The activation energy is the height of the hump measured from the reactant level, and the enthalpy change ΔH is the difference between the product and reactant levels.
Energy profiles for an exothermic and an endothermic reaction. Ea (blue) is measured from the reactants up to the transition state at the top of the hump; ΔH (green) is the difference between products and reactants. Ea is always positive; ΔH can have either sign.
The activation energy is always positive, whether the reaction is exothermic or endothermic. Even a strongly exothermic reaction needs an initial input of energy to break bonds before the energy released by bond formation can be given out. The size of Ea is not linked to the size or sign of ΔH: some very exothermic reactions are slow, and some endothermic reactions are fast.
The reverse reaction
The reverse reaction passes through the same transition state, so its activation energy is measured from the product level up to the top of the same hump:
Ea(reverse)=Ea(forward)−ΔH
For an exothermic reaction ΔH is negative, so the reverse activation energy is larger than the forward one by ∣ΔH∣. For an endothermic reaction the reverse activation energy is the smaller of the two.
High activation energy and kinetic stability
A mixture of methane and air can be stored indefinitely at room temperature even though the combustion of methane is strongly exothermic (ΔHc⊖=−891kJ mol−1, data booklet). The activation energy is so high that almost no collisions at room temperature have enough energy. A spark or flame provides that energy to a few molecules; the heat released by their reaction then supplies the activation energy for neighbouring molecules, and the reaction spreads. This kinetic stability is a useful property of a fuel: it can be stored and transported safely and burns only when ignited.
The Maxwell–Boltzmann distribution
The particles in a sample do not all have the same kinetic energy. Collisions constantly transfer energy between particles, so at any moment a few are almost at rest, most have moderate energies and a few have very high energies. The Maxwell–Boltzmann distribution shows how the kinetic energies are spread among the particles at one temperature.
The Maxwell–Boltzmann distribution of kinetic energies in a sample of gas at one temperature. The curve is not symmetrical: the mean energy lies to the right of the peak. The shaded area beyond Ea represents the particles with enough energy to react when they collide.
Features of the curve
The axes are labelled number of particles (or fraction or proportion of particles) on the vertical axis and kinetic energy on the horizontal axis.
The curve starts at the origin: no particles have zero kinetic energy.
It rises to a peak at the most probable kinetic energy, the energy that the largest number of particles have.
It is not symmetrical. It falls more slowly than it rises and has a long tail at high energy, so the mean kinetic energy is a little higher than the most probable value.
The tail approaches the energy axis but never meets it, because there is no upper limit to the energy a particle can have.
The area under the curve represents the total number of particles in the sample.
Marking Ea on the energy axis divides the particles into two groups. The area under the curve to the right of Ea represents the particles with E≥Ea, the only ones that can react when they collide. For most reactions at room temperature this area is a very small fraction of the total.
The effect of temperature on the distribution
At a higher temperature the particles have a higher average kinetic energy, so the distribution changes shape. The Maxwell–Boltzmann distributions of the same sample at two temperatures, T1 and a higher T2, differ in four ways.
Raising the temperature from T₁ to T₂ flattens and broadens the distribution and moves its peak to higher energy. The number of particles is unchanged, so the area under each curve is the same, but the shaded area beyond Ea (particles that can react) is much larger at T₂.
The peak of the T2 curve is lower and further to the right: the most probable energy is higher, and the energies are spread over a wider range.
The T2 curve lies above the T1 curve at high energies, for the whole of the tail.
The number of particles is unchanged, so the area under the two curves is the same.
The area beyond Ea is much larger at T2.
YouTube
Richard Thornley: the Maxwell–Boltzmann distribution (IB Chemistry R2.2.4).
Factors that affect the rate of reaction
The rate of a reaction can be controlled by changing the concentration of a reactant in solution, the pressure of a gas, the surface area of a solid, the temperature, or by adding a catalyst. Light also speeds up some reactions: a mixture of hydrogen and chlorine reacts explosively in bright sunlight, because light energy breaks Cl–Cl bonds. Stirring a mixture of a solid and a liquid keeps fresh solution in contact with the surface of the solid.
Concentration
Increasing the concentration of a reactant in solution increases the number of reactant particles in each unit of volume. The particles collide more frequently, so there are more successful collisions per unit time and the rate increases. The fraction of collisions that are successful is unchanged, because the temperature, and therefore the energy distribution, is the same.
Concentration also explains why rates fall as reactions proceed: the reactants are used up, their concentrations fall, and the collision frequency falls with them.
Pressure
For reactions between gases, increasing the pressure at constant temperature pushes the same number of molecules into a smaller volume. This increases their concentration: at constant temperature, doubling the pressure of a gas doubles its concentration. The molecules collide more frequently, and the rate increases. Pressure has almost no effect on reactions in solution, because liquids and solids are almost incompressible.
Surface area of a solid
When one reactant is a solid, only the particles at its surface can collide with particles of the other reactant. Breaking a solid into smaller pieces exposes more particles at the surface, so collisions with the other reactant become more frequent and the rate increases.
Cutting a 2 cm cube into eight 1 cm cubes doubles the surface area without changing the mass. A smaller particle size means a larger surface area, so more particles of the solid are exposed to collisions.
The effect is large. Grinding a 1 cm cube into grains of 0.1mm multiplies its surface area by 100. Powdered calcium carbonate fizzes vigorously in acid while marble chips of the same mass react steadily for several minutes. Fine powders of combustible materials such as flour, sugar, coal or wood can burn so fast when dispersed in air that they explode. At the Imperial Sugar refinery in Port Wentworth, Georgia, an explosion fuelled by accumulated sugar dust killed 14 workers in 2008; mills and refineries control dust and sources of sparks for this reason.
Temperature
Raising the temperature increases the rate of almost every reaction, often dramatically. For many reactions near room temperature the rate roughly doubles for a rise of 10K. There are two reasons:
The particles move faster, so they collide more frequently.
The particles have a higher average kinetic energy, so a greater proportion of collisions have energy greater than or equal to Ea. On the Maxwell–Boltzmann distribution, the area beyond Ea is much larger at the higher temperature.
The second effect is much the more important. A 10K rise near room temperature increases the collision frequency by less than 2 %, yet it can double the rate, because it roughly doubles the number of particles with enough energy to react.
How large are the two effects?
The average speed of gas molecules is proportional to T, so the collision frequency also rises roughly as T. From 298K to 308K it rises by a factor of 308/298=1.017, an increase of 1.7 %.
For a reaction with Ea=50kJ mol−1, the fraction of collisions with E≥Ea
Low temperatures slow reactions down. Food kept in a refrigerator at about 4∘C stays fresh for days rather than hours, because the reactions that cause decay, including those of the enzymes in bacteria, are much slower than at room temperature. Freezing slows them further.
Catalysts
A catalyst increases the rate by providing a different route from reactants to products with a lower activation energy. A greater proportion of collisions then have E≥Ea at the same temperature.
Summary of the factors
Change
Effect on collision frequency
Effect on the fraction of collisions with E≥Ea
Higher concentration (solutions)
increases
no change
Higher pressure (gases)
increases (higher concentration)
no change
Larger surface area (smaller particles)
increases
no change
Higher temperature
increases slightly
increases greatly (main effect)
Adding a catalyst
no change
increases (Ea is lower)
Reading graphs of rate experiments
Graphs of gas volume or mass loss against time show both how fast a reaction goes and how much product it makes. The gradient at any time gives the rate; the final, level value gives the total amount of product, which is fixed by the amount of the limiting reactant.
The acid is the limiting reactant in every run. Powdering the marble (B) increases the rate but not the final volume, because the amount of acid is unchanged. Doubling the acid concentration (C) doubles the initial rate and also doubles the amount of acid, so twice the volume of gas forms.
Changing the surface area, the temperature or adding a catalyst changes how quickly the curve rises, but not its final value, because the amount of the limiting reactant is unchanged.
Changing the amount of the limiting reactant changes the final value. In run C the acid is twice as concentrated, so there is twice the amount of acid (the limiting reactant) and twice the volume of gas.
Increasing the concentration of a reactant that is in excess increases the initial rate but leaves the final value unchanged.
Designing a fair rate investigation
To find the effect of one factor on the rate, only that factor (the independent variable) is changed, and every other variable that could affect the rate is kept constant: these are the control variables. In the reaction of sodium thiosulfate with hydrochloric acid, for example, the concentration of thiosulfate is changed by diluting a stock solution with different volumes of water.
Variable to control
Why it matters
How it is controlled
temperature
rate increases with temperature
use solutions at room temperature or a water bath; record the temperature
concentration and volume of acid
acid is the other reactant
same volume of the same stock solution each run
total volume of the mixture
the depth of liquid the observer looks through affects when the cross disappears
make each thiosulfate solution up to the same total volume with water
the cross and the lighting
a darker cross or brighter light takes more sulfur to hide
same paper, same flask, same position and the same observer
Each run should be repeated at least three times so that anomalous results can be identified and a mean calculated. Sulfur dioxide is released, so the work is done in a well-ventilated room and the flask is emptied into a fume cupboard sink.
Random and systematic errors on rate graphs
Graphs of experimental data show the two kinds of error in different ways. Random errors make the points scatter on either side of the best-fit line; repeating the measurements and averaging reduces their effect. Systematic errors shift every reading in the same direction by a similar amount, so the points can lie close to a line that is in the wrong place. A best-fit line that misses the origin when the theory says it should pass through it is a sign of a systematic error.
Early readings of gas volume against time. The scatter of points about the best-fit line shows random error. The line is parallel to the expected one but meets the volume axis at about 3 cm³ instead of zero: every reading is too high by the same amount, a systematic error (here a syringe that was not set to zero).
In the early readings of gas volume against time, the points scatter slightly about a straight line, showing small random errors. The line has the expected gradient but meets the volume axis at about 3cm3: a syringe that started at 3cm3 instead of zero, or air displaced when the bung was inserted, adds the same volume to every reading. Repeating the experiment in the same way would not remove this error; checking the zero of the syringe before each run would. A systematic error of this kind does not change the gradient, so a rate found from the gradient is still reliable.
Catalysts and how they work
Because a catalyst is regenerated, a small amount can convert a very large amount of reactants. A catalyst takes part in the reaction, for example by forming bonds with a reactant, but it is released again in a later step. It changes the route by which the reaction happens (the mechanism), not the reactants or products.
Energy profiles with and without a catalyst
The energy profiles of a catalysed and an uncatalysed reaction share the same reactant level and the same product level. Only the height of the hump changes.
A catalyst provides a pathway with a lower activation energy (orange, dashed) for both exothermic and endothermic reactions. The reactants and products are the same, so ΔH (green) does not change.
Three consequences follow from these profiles:
Ea is lower on the catalysed pathway, so the rate is higher.
ΔH is unchanged, because the reactants and products are the same. A catalyst cannot make an endothermic reaction exothermic, or give out more heat.
The activation energy of the reverse reaction is lowered by exactly the same amount as that of the forward reaction. A catalyst therefore speeds up the forward and reverse reactions equally. In a reversible reaction it shortens the time taken to reach equilibrium but does not change the position of equilibrium or the equilibrium constant.
A catalyst on the Maxwell–Boltzmann distribution
A catalyst does not change the temperature, so the distribution of kinetic energies stays exactly the same. What changes is the energy that a collision needs. With the lower activation energy, Ea(cat), many more particles lie beyond the threshold.
A catalyst does not change the distribution of energies, because the temperature is the same. It lowers the activation energy from Ea to Ea(cat), so the fraction of particles that can react grows from the blue area alone to the blue plus yellow areas.
Homogeneous and heterogeneous catalysts
Catalysts are classified by their physical state, or phase, compared with the reactants.
Homogeneous catalyst
Heterogeneous catalyst
Phase
same phase as the reactants
different phase from the reactants (usually a solid with gas or liquid reactants)
Examples
HX+(aq) from sulfuric acid in esterification; IX−(aq) in the decomposition of HX2OX2(aq)
iron in the Haber process, NX2(g)+3HX2(g)2NHX3(g)
Separation after the reaction
difficult: mixed with the products
easy: the solid stays behind
A heterogeneous catalyst works only at its surface, so it is made with as large a surface area as possible: finely divided, porous, or spread as a thin layer over an inert support. Many important catalysts are transition elements or their compounds, such as iron, platinum, nickel, vanadium(V) oxide and manganese(IV) oxide. Their variable oxidation states and their ability to bond to reactant molecules at their surface make them effective catalysts.
A heterogeneous catalyst can be poisoned: a substance that bonds strongly to its surface blocks the sites where the reactants would bind, so the catalyst stops working. Lead compounds poison the metals in catalytic converters, which is one reason why cars fitted with them must use unleaded petrol.
Enzymes
Enzymes are biological catalysts: protein molecules that catalyse the reactions in living cells. They are highly specific, each usually catalysing one reaction, and they work at body temperature and close to neutral pH. Catalase, found in almost all cells that use oxygen, catalyses the decomposition of hydrogen peroxide, a toxic by-product of metabolism:
2HX2OX2(aq)catalase2HX2O(l)+OX2(g)
It is one of the fastest enzymes known: a single catalase molecule can decompose millions of hydrogen peroxide molecules every second. The reaction is easy to follow in the laboratory by collecting the oxygen in a gas syringe, using a small piece of potato or liver as the source of catalase and comparing it with solid manganese(IV) oxide.
Unlike most catalysts, enzymes are sensitive to temperature. Their rate increases with temperature at first, as for any reaction, but above about 40 °C for most human enzymes the protein begins to lose its shape (it is denatured) and the rate falls sharply.
Case study: the catalytic converter
A petrol engine releases carbon monoxide, unburnt hydrocarbons and nitrogen oxides (NO and NOX2, together NOXx) in its exhaust gases. All three are pollutants, and the reactions that would remove them are slow at the temperature of the exhaust. A catalytic converter, fitted in the exhaust pipe, speeds up these reactions so that most of the pollutants are converted before the gases leave the car:
The catalyst is a thin layer of the platinum-group metals platinum, palladium and rhodium, spread over a ceramic honeycomb with thousands of narrow channels. The honeycomb gives a very large surface area for a small mass of these expensive metals and lets the gases flow through freely.
The ceramic honeycomb of a catalytic converter. Exhaust gases pass along the narrow channels, whose walls carry a porous washcoat holding a thin layer of platinum-group metals: a very large catalyst surface in a small volume. Image: Global-Kat Recycling, CC BY-SA 3.0, via Wikimedia Commons.
The converter shows several of the ideas about catalysts at work. The catalyst is heterogeneous: solid metal with gaseous reactants, which react on its surface. It is not used up, so one converter works for many years. It needs to be hot, typically above about 250–300 °C, before it works efficiently, so most of the pollution from a modern car is released in the first minutes after a cold start. And it can be poisoned: lead from leaded petrol coats the metal surface and stops it working.
Reaction mechanisms and elementary steps (HL)
A balanced equation shows the reactants and products of a reaction and their mole ratio. It does not show how the reaction happens at the level of particles. The equation 2NO(g)+2HX2(g)NX2(g)+2HX2O(g), for example, suggests four molecules colliding at once, but a collision of four particles with enough energy and the right orientation is so improbable that the reaction would be immeasurably slow. Most reactions instead take place as a series of simpler events, each involving one, two or occasionally three particles.
Each elementary step is written as an ordinary equation, and the steps of a reaction mechanism must add up to the overall stoichiometric equation. Species that appear on both sides when the steps are added cancel out. The reaction between nitrogen dioxide and carbon monoxide at temperatures below about 500 K is a well-studied example:
Adding the two steps gives 2NOX2+NOX3+CONOX3+NO+NOX2+COX2. One NOX2 and the NOX3 appear on both sides and cancel, leaving the overall equation. The NOX3 is made in step 1 and used up in step 2.
Intermediates
In the nitrogen dioxide and carbon monoxide mechanism, NOX3 is a reaction intermediate. Intermediates are real chemical species with complete bonds. Many are reactive and short-lived, such as radicals, carbocations or unstable molecules, but because each occupies an energy minimum it can in principle be detected, for example by spectroscopy, and some can be isolated. Detecting an intermediate that a mechanism predicts is strong evidence for that mechanism.
A catalyst behaves in the opposite way to an intermediate: it is used up in an early step and regenerated in a later one. It also does not appear in the overall equation, but it is present at the start and at the end.
Transition states
Every elementary step has exactly one transition state, so a two-step mechanism has two. A transition state exists only for the instant in which the atoms pass over the top of the barrier. It cannot be collected or isolated, because it sits at an energy maximum: any movement of its atoms lowers its energy, either back to the reactants of that step or on to its products. Transition states are written in square brackets with the symbol ‡, and partial bonds are drawn as dashed lines, for example [OX2N⋯O⋯NOX2]‡ for the first step of that mechanism.
Intermediate
Transition state
Position on the energy profile
a minimum (trough) between two peaks
a maximum (peak) of a step
Bonding
complete bonds; a real species
partial bonds being broken and formed
Lifetime
short, but can be detected and sometimes isolated
exists only at the instant of crossing the barrier; cannot be isolated
Number in a mechanism
one fewer than the number of steps (for a simple chain of steps)
one per elementary step
Appears in the overall equation?
no
no
The rate-determining step (HL)
The steps of a mechanism usually take place at very different rates. The reaction as a whole cannot go faster than its slowest step, in the same way that the number of cars leaving a car park each minute is set by the single barrier at the exit, however quickly the cars reach it. Speeding up a fast step makes no difference to the rate; speeding up the slow step increases the rate of the whole reaction.
In the nitrogen dioxide and carbon monoxide mechanism, step 1 (the collision of two NOX2 molecules) is the rate-determining step. Carbon monoxide only takes part in the fast step 2, after the slow step. Changing the concentration of CO therefore has no effect on the rate, as experiments confirm: the reaction is zero order with respect to carbon monoxide.
When the rate-determining step is not the first step
The slow step can come later in the mechanism. The steps before it are then fast and often reversible, so they reach equilibrium and keep up a small, steady concentration of an intermediate (a pre-equilibrium), which the slow step consumes. The oxidation of nitrogen monoxide, which turns colourless NO from car exhausts into brown NOX2 in polluted air, is thought to follow this pattern:
Oxygen takes part only in step 2. The rate of step 2 also depends on how much of the intermediate NX2OX2 is present, and that depends on the concentration of NO through the equilibrium in step 1. The rate of the whole reaction therefore depends on both [NO] and [OX2], even though NO does not take part in the slow step.
Energy profiles of multistep reactions (HL)
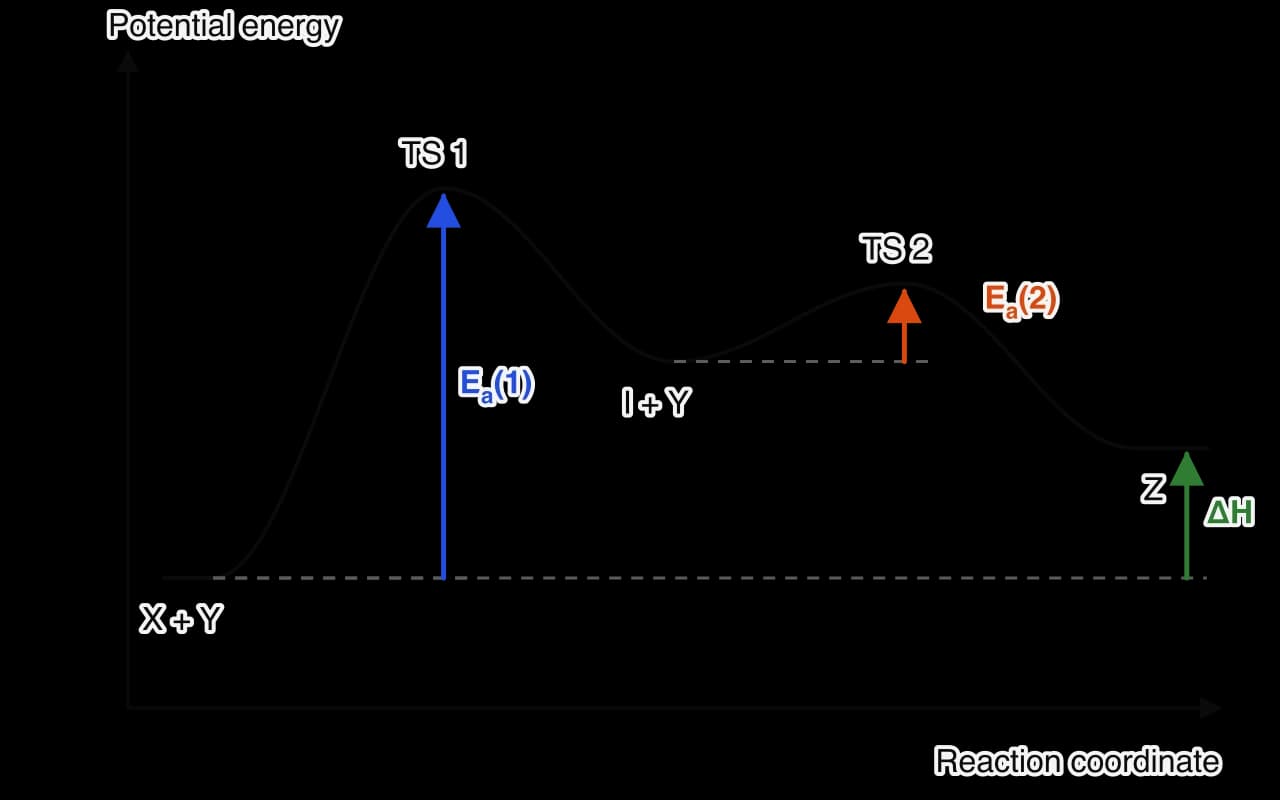
An energy profile for a reaction with more than one step has one hump for each elementary step. The top of each hump is a transition state; each trough between two humps is an intermediate. The reactant and product levels are fixed by the substances involved, so ΔH is the same however many steps there are.
The energy profile of the reaction of nitrogen dioxide with carbon monoxide has two humps. The first is much higher than the second, so step 1 has the larger activation energy and is the rate-determining step.
A two-step reaction in which the first step is rate-determining. Each step has its own transition state at a peak (TS 1, TS 2); the intermediate sits in the trough between them. The first step has the larger activation energy (blue), so it is the slow step; the second (orange) is fast. ΔH (green) depends only on the reactant and product levels.
The activation energy of each step is measured from the energy of the species that start that step: for step 1 from the reactants, and for step 2 from the intermediate. A step with a larger activation energy has a smaller fraction of collisions with E≥Ea, so it is slower.
When the second step is rate-determining, the second hump rises higher above the intermediate than the first hump rises above the reactants. The energy profile of such a reaction has a low first barrier, which is crossed quickly in both directions, and a high second barrier.
A two-step reaction in which the second step is rate-determining. The first step is fast and reaches equilibrium (small activation energy, orange); the second step has the larger activation energy (blue), measured up from the intermediate, so it is the slow step.
The halogenoalkanes give a contrasting pair of profiles. The SN1 substitution of a tertiary halogenoalkane has two steps with a carbocation intermediate in the trough, and the first step (forming the carbocation) is rate-determining. The SN2 substitution of a primary halogenoalkane is a single step with one transition state and no intermediate. Both mechanisms are drawn with curly arrows in electron-pair sharing reactions (R3.4).
Constructing an energy profile from kinetic data
An energy profile can be sketched from a mechanism together with the rate equation and the sign of ΔH. The rate equation shows which step is slow, and so which hump must have the larger barrier; the sign of ΔH fixes whether the products lie below or above the reactants.
Molecularity (HL)
A step in which a single particle breaks apart or rearranges is unimolecular; one in which two particles collide is bimolecular; and one in which three particles collide at the same moment is termolecular. The particle diagram compares the three types of step.
The molecularity of an elementary step is the number of particles that take part in it. Blue arrows show the motion of the particles. A termolecular step needs three particles to meet at the same instant, which is rare.
Most elementary steps are unimolecular or bimolecular. Termolecular steps are rare, because three particles must arrive at the same point at the same instant, with enough energy and the right orientation. Steps involving four or more particles are not found. This is why a reaction such as 2NO+2HX2NX2+2HX2O must have a mechanism of several steps. The molecularity of each step in a mechanism fixes the form of that step's rate:
Elementary step
Molecularity
Rate of that step
NX2OX42NOX2
unimolecular
k[NX2OX4]
NOX2+NOX2NOX3+NO
HX2OX2+IX−HX2O+IOX−
2NO+OX22NOX2
For an elementary step, and only for an elementary step, the rate is proportional to the concentration of each reacting particle, so the power of each concentration equals the number of that particle in the step. Molecularity is a property of a single step in a proposed mechanism. The order of reaction is a property of the experimental rate equation for the whole reaction. The order of the whole reaction equals the molecularity of the rate-determining step only when the slow step is the first step.
Rate equations (HL)
The rate of a reaction depends on the concentrations of some of the species present. For a reaction between A and B, the relationship found by experiment usually takes the form:
rate=k[A]m[B]n
This is the rate equation (also called the rate expression or rate law). k is the rate constant, and the exponents m and n are the orders of reaction with respect to A and B.
A rate equation contains only the species whose concentrations affect the rate. These may include a catalyst, which does not appear in the balanced equation at all, and they may leave out a reactant that does appear in it. The order of reaction with respect to each species and the overall order cannot be predicted from the balanced equation. They depend on the mechanism and can only be found by experiment.
The iodination of propanone in acid solution shows how the rate constant and the orders relate to the species present:
Iodine is a reactant but does not appear in the rate equation; it is zero order. The acid is a catalyst but does appear; it is first order. The mechanism accounts for both facts: the slow step involves propanone and hydrogen ions, forming an intermediate that then reacts rapidly with iodine. The rate of this reaction is often followed by colorimetry, since the yellow-brown colour of iodine fades at a constant rate.
Zero, first and second order
In practice a reactant is most often zero order, first order or second order. The table summarizes what each means for a reactant A.
Order with respect to A
Rate equation (A only)
Effect of doubling [A] on the rate
Meaning for the mechanism
0
rate =k
no change
A is not involved in the rate-determining step or any step before it
1
rate =k[A]
doubles (× 2)
one particle of A in the rate-determining step (or before it)
2
rate =k[A]2
quadruples (× 2² = 4)
two particles of A in the rate-determining step (or before it)
In general, if [A] is multiplied by a factor x, the rate is multiplied by xm, where m is the order. Tripling the concentration of a second-order reactant multiplies the rate by 32=9. Some reactions have fractional or negative orders, which arise from more complex mechanisms.
Deducing orders from initial-rate data
In the initial-rates method, several runs of a reaction are carried out at the same temperature, each with a different set of starting concentrations. The initial rate of each run is measured, either from the tangent at t=0 to a concentration–time graph or from the time taken for a small, fixed amount of reaction. The initial rate is used because at the start the concentrations are known exactly and the products have not yet had time to interfere.
The runs are planned so that only one concentration changes between a pair of runs. Comparing that pair isolates the effect of one reactant:
rate unchanged when the concentration changes: zero order;
rate changes by the same factor as the concentration: first order;
rate changes by the square of the factor: second order.
The rate of the reaction SX2OX8X2−(aq)+2IX−(aq)2SOX4X2−(aq)+IX2(aq) was measured at 298 K. A student obtained these initial rates.
Run
[SX2OX8X2−] / mol dm⁻³
[IX−] / mol dm⁻³
Initial rate / mol dm⁻³ s⁻¹
1
0.0100
0.0200
2.2×10⁻⁶
2
0.0200
0.0200
4.4×10⁻⁶
3
0.0100
0.0400
4.4×10⁻⁶
When two concentrations change at once between a pair of runs, the effect of the reactant whose order is already known is divided out first. For example, if [A] (first order) and [B] both double and the rate increases eightfold, the factor due to B is 8/2=4=22, so the reaction is second order in B.
Measuring initial rates: the iodine clock
A clock reaction gives a sudden, easily seen change after a certain amount of reaction has taken place. The peroxodisulfate–iodide reaction becomes a clock when a small, fixed amount of sodium thiosulfate and some starch are added to the mixture. The thiosulfate immediately turns the iodine produced by the slow reaction back into iodide. Only when all the thiosulfate has been used up does free iodine remain, and the solution suddenly turns blue-black with the starch. The flow diagram sets out the sequence of reactions in the iodine clock.
How the peroxodisulfate–iodide clock works. The small, fixed amount of thiosulfate holds back the colour until the slow reaction has made a fixed amount of iodine, so the time t measures how long that fixed amount of reaction takes and the initial rate is proportional to 1/t.
Every run uses the same amount of thiosulfate, so the colour appears when the same small amount of iodine has formed. The average rate up to that point is that fixed amount divided by the time t, and because so little of the reactants has been used, it is close to the initial rate. The initial rate is therefore proportional to 1/t, and 1/t can be used directly to find orders.
In a typical method, solutions of potassium iodide, sodium thiosulfate and starch are mixed in a conical flask, potassium peroxodisulfate solution is added from a pipette, and a stopwatch is started as it is added. The concentration of one reactant is varied by using different volumes of its solution, and the total volume is kept the same by adding water, so that the other concentrations are unchanged. The flasks stand in a water bath to keep the temperature constant. A graph of 1/t against [IX−] that is a straight line through the origin shows first order with respect to iodide.
The main random error is judging the moment the colour appears, which matters most for the shortest times; placing the flask on a white tile and repeating each run reduces it. Systematic errors include a change in the temperature of the solutions and a delay between adding the last solution and starting the stopwatch. The same apparatus, used at several temperatures with the concentrations fixed, gives the rate constants needed for an Arrhenius plot.
Graphs of zero, first and second order reactions (HL)
Concentration–time graphs
When the concentration of one reactant is measured as a reaction proceeds (with any other reactants in large excess, so that their concentrations hardly change), the shape of the concentration–time graph depends on the order with respect to that reactant. The concentration–time graph compares three reactions that start with the same concentration and the same initial rate.
For a zero-order reactant the concentration falls in a straight line, because the rate does not change. First- and second-order curves get shallower as the reactant is used up; the second-order curve flattens more, giving a longer tail. All three start with the same gradient (the same initial rate).
Zero order: a straight line with a constant negative gradient. The rate (the gradient) does not change as [A] falls, until the reactant runs out.
First order: a curve whose gradient falls in proportion to [A]. Halving the concentration halves the gradient. The concentration falls by half in equal intervals of time: the half-life is constant.
Second order: a curve that starts steeply and then flattens more than the first-order curve, because halving [A] divides the rate by four. Each half-life is longer than the one before (it doubles each time).
A constant half-life is the quickest test for a first-order reactant. The first-order decay graph for dinitrogen pentoxide, 2NX2OX5(g)4NOX2(g)+OX2(g), shows the concentration halving every 20 minutes.
A first-order reactant has a constant half-life: here the concentration halves every 20 minutes, whatever the starting value. Hypothetical data for the decomposition of dinitrogen pentoxide at constant temperature.
Order can also be found from a single concentration–time curve by drawing tangents at several points. Each gradient gives the rate at that concentration. If the rate at 0.050mol dm−3 is half the rate at 0.100mol dm−3, the reaction is first order; if it is a quarter, second order.
Why the first-order curve is an exponential decay
For a first-order reactant the rate of fall of concentration is proportional to the concentration itself: the more there is, the faster it is used up. Any quantity that falls at a rate proportional to its own size decays exponentially, [A]=[A]0e−kt, like the activity of a radioactive isotope.
Setting [A]=21[A]0 gives t1/2=kln2≈k0.693, which does not depend on the starting concentration. For the dinitrogen pentoxide data, k=0.693/(20×60s)=5.8×10−4s−1.
Rate–concentration graphs
When the initial rate is plotted against the concentration of one reactant, each order gives a characteristic line, as the rate–concentration graph shows.
Rate against concentration. A horizontal line means the rate does not depend on [A] (zero order); a straight line through the origin means rate ∝ [A] (first order); a curve through the origin that gets steeper means rate ∝ [A]² (second order).
A second-order reactant gives a curve on this graph, which is hard to tell apart from other curves by eye. Plotting the rate against [A]2 gives a straight line through the origin, which confirms second order. In the same way, a straight line through the origin on a graph of rate (or 1/t) against [A] confirms first order.
Order
Concentration–time graph
Rate–concentration graph
Half-life
0
straight line, negative gradient
horizontal line
decreases as [A] falls
1
exponential decay curve
straight line through the origin
constant
2
curve, steeper at first, with a long tail
upward curve through the origin; rate against [A]² is linear
increases (doubles each time)
YouTube
Richard Thornley: sketching graphical representations of zero-, first- and second-order reactions (HL).
The rate constant and its units (HL)
The rate constant does not depend on concentration. As the reactants are used up the rate falls, but k stays the same, because the rate equation already accounts for the change in concentration. The rate constant changes only when the fraction or frequency of successful collisions changes: it increases with temperature, and it is larger when a catalyst provides a pathway with a lower activation energy. A value of k is therefore always quoted with the temperature at which it applies.
A larger rate constant means a faster reaction at the same concentrations. Because k has different units for different orders, values can only be compared between reactions of the same overall order.
Deriving the units of k
The units of k are whatever makes both sides of the rate equation have units of mol dm−3s−1. Rearranging the rate equation for k and substituting units gives them directly. For a reaction that is second order overall:
In general, for an overall order n the units are mol1−ndm3(n−1)s−1. Each extra order adds one mol−1dm3 to the units.
Solving problems with the rate equation
Once the rate equation and k are known, the rate equation can be rearranged to find a rate at new concentrations, or the concentration needed to give a certain rate.
Linking rate equations to mechanisms (HL)
The rate equation is set by the rate-determining step. The species that appear in it are those that take part in the slow step and those in any fast steps before it, because these control how much of an intermediate the slow step can use. Species that react only in fast steps after the slow step do not appear. The order with respect to each reactant then reflects the number of its particles in the slow step and the steps before it.
The slow step is the first step
When the first step is slow, the rate equation is simply the rate of that elementary step. For NOX2+CONO+COX2, the slow step is NOX2+NOX2NOX3+NO, a bimolecular step involving two NOX2 molecules, so:
rate=k[NOX2]2
The reaction is second order in NOX2 and zero order in CO, which agrees with experiment. The halogenoalkanes give a second pair of examples. The hydrolysis of a tertiary halogenoalkane such as 2-bromo-2-methylpropane by aqueous alkali has rate =k[(CHX3)X3CBr], because its slow step is the unimolecular breaking of the C–Br bond. The hydrolysis of a primary halogenoalkane such as 1-bromobutane has rate =k[CHX3CHX2CHX2CHX2Br][OHX−], because its single step is bimolecular. The units of k are s−1 and mol−1dm3s−1 respectively.
The slow step comes after a fast equilibrium
When a fast, reversible step comes first, the slow step uses an intermediate. An intermediate cannot appear in the final rate equation, because its concentration cannot be measured or controlled directly. It is replaced by the reactants that form it in the fast step. For the oxidation of nitrogen monoxide:
The slow step gives rate =k2[NX2OX2][OX2]. The fast equilibrium in step 1 keeps [NX2OX2] proportional to [NO]2, since two NO molecules form each NX2OX2. Substituting gives the rate equation in terms of reactants only:
rate=k[NO]2[OX2]
This matches the experimental rate equation. The two NO molecules count towards the order even though they react in the fast step, because that step comes before the slow step. In short, the orders equal the total number of each reactant particle in the slow step and all the steps before it, once intermediates are traced back to the reactants that form them.
Why [N2O2] is proportional to [NO]²
At equilibrium the rates of the forward and backward reactions of step 1 are equal: k1[NO]2=k−1[NX2OX2]. Rearranging gives [NX2OX2]=k−1k1[NO]2. Substituting into the rate of the slow step gives rate =k−1k2k1[NO]2[OX2], so the observed rate constant is k=k2k1/k−1, a combination of the rate constants of the individual steps.
Evaluating a proposed mechanism
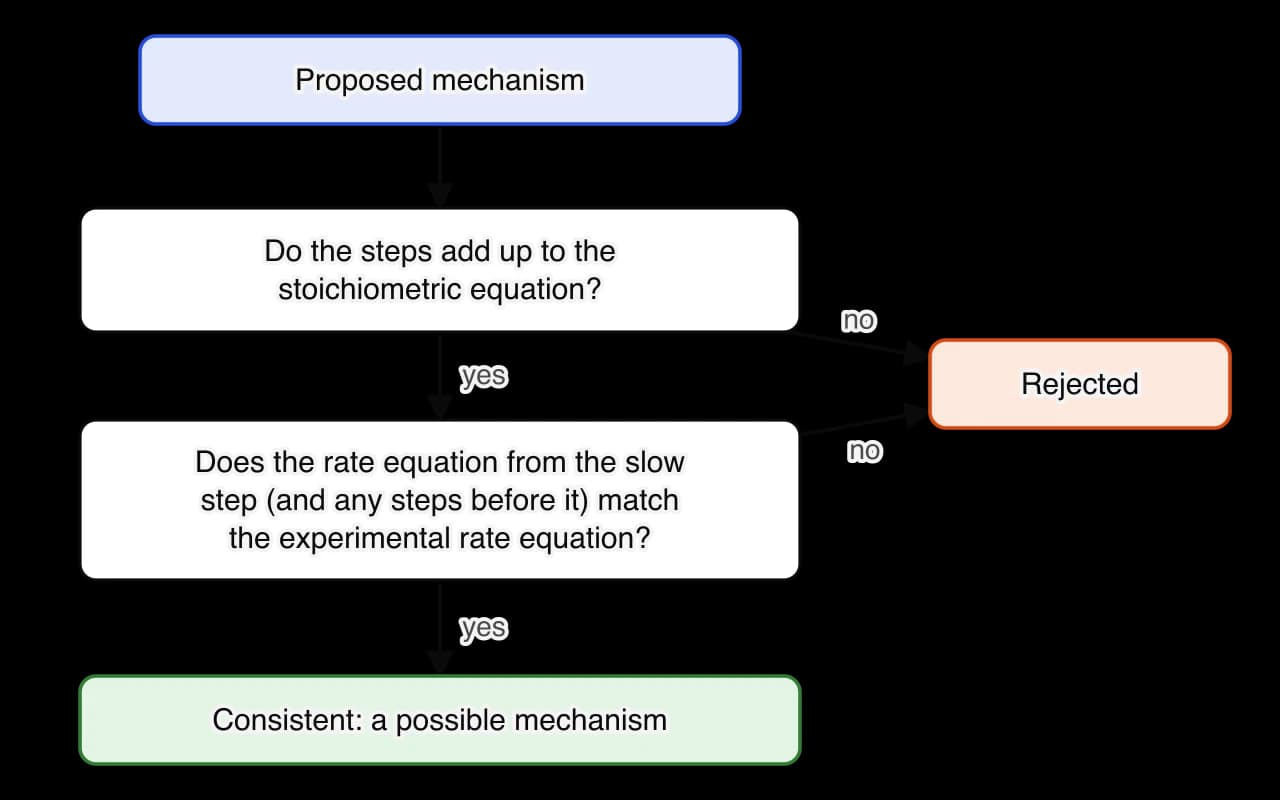
A mechanism is a model, put forward to explain the evidence. A proposed mechanism must pass two tests, set out in the flow chart: its steps must add up to the stoichiometric equation, and the rate equation it predicts must agree with the experimental one. A mechanism that also predicts an intermediate that is then detected gains further support.
The two tests a proposed mechanism must pass. Passing both makes it consistent with the evidence, never proven: another mechanism might fit the same data.
Why a mechanism is only ever a possible mechanism
Kinetic data can show that a mechanism is wrong, but they cannot prove that one is right, because different mechanisms can predict the same rate equation. The reaction HX2(g)+IX2(g)2HI(g) has rate =k[HX2][IX2], and for decades it was taken as the standard example of a single bimolecular step. In 1967 J. H. Sullivan used light from a mercury lamp to split more of the iodine molecules into atoms, and found that the rate depended on the concentration of iodine atoms. The reaction proceeds, at least largely, through iodine atoms formed in a fast equilibrium, IX22I, which gives the same rate equation under ordinary conditions. Mechanisms are therefore accepted provisionally, as the simplest explanation consistent with all the evidence, and are revised when new evidence appears.
Temperature and the rate constant: the Arrhenius equation (HL)
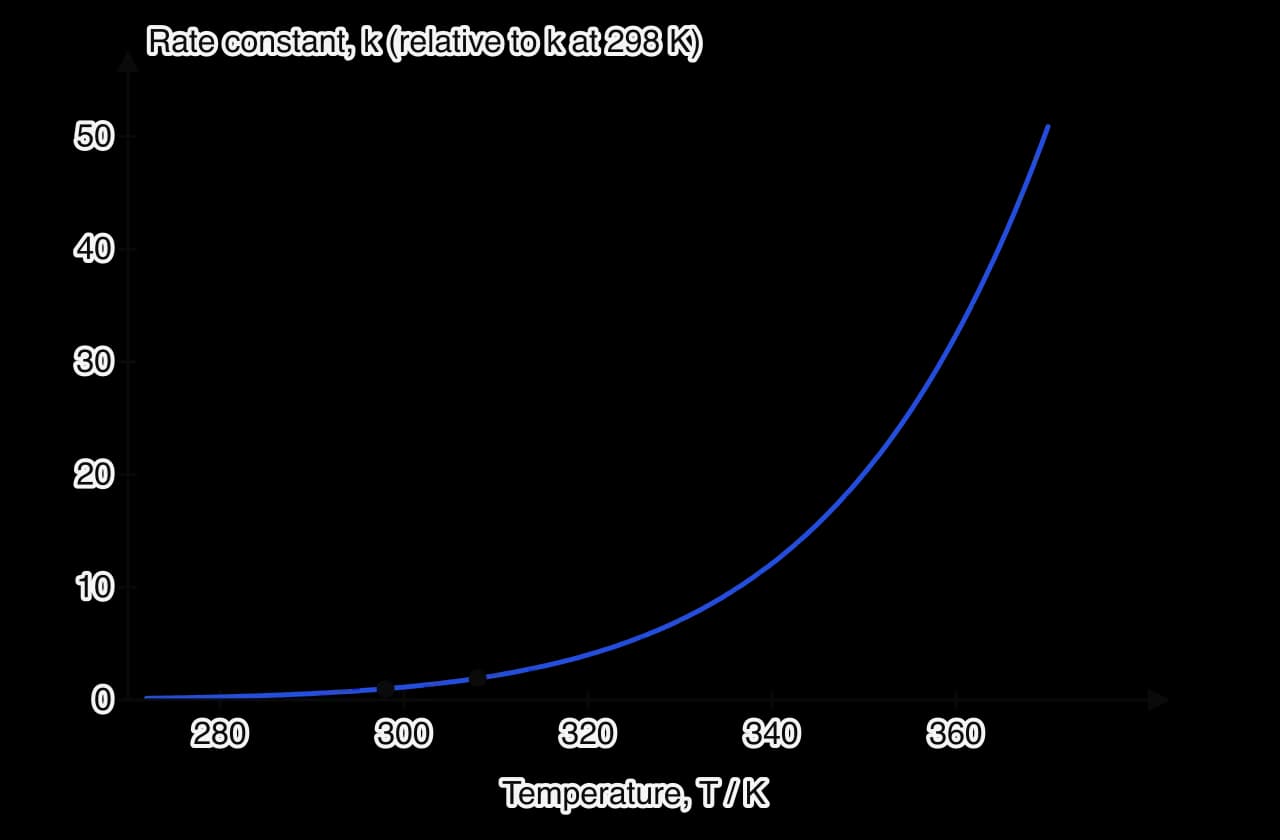
When only the temperature is raised, the concentrations do not change, so the faster rate is an increase in k. The relationship is not linear: the graph of k against temperature rises ever more steeply.
The rate constant rises exponentially with temperature. For a reaction with an activation energy of 50 kJ mol⁻¹, k roughly doubles between 298 K and 308 K (the two dots) and is about fifty times larger at 370 K. Calculated from the Arrhenius equation.
The Arrhenius equation
The temperature dependence of the rate constant is described by the Arrhenius equation (data booklet):
k=AeRT−Ea
Here Ea is the activation energy in J mol−1, R=8.31J K−1mol−1 is the gas constant, T is the absolute temperature in kelvin, and A is the Arrhenius factor, which has the same units as k. The two parts of the equation correspond to the two conditions for a successful collision.
e−Ea/RT is the fraction of collisions with energy at least equal to Ea. It is always less than 1. It increases steeply as T rises, matching the larger area beyond Ea under the Maxwell–Boltzmann curve at a higher temperature, and it is smaller for a reaction with a larger Ea.
A takes into account the frequency of collisions with the proper orientation.
The Arrhenius equation accounts for the size of the temperature effect. For a reaction with Ea=50kJ mol−1, e−Ea/RT=e−20.2≈1.7×10−9 at 298 K, and the exponential term nearly doubles for a 10 K rise, while A, which depends on the collision frequency, changes by less than 2 %.
The Arrhenius factor hardly changes with temperature over a normal range. It is largest when almost every collision has a suitable orientation, as when two simple atoms or radicals combine, and much smaller for reactions between large molecules, where only a collision at one particular site can lead to reaction.
The linear form and the Arrhenius plot
Taking natural logarithms of both sides of the Arrhenius equation gives its linear form (data booklet):
lnk=RT−Ea+lnA
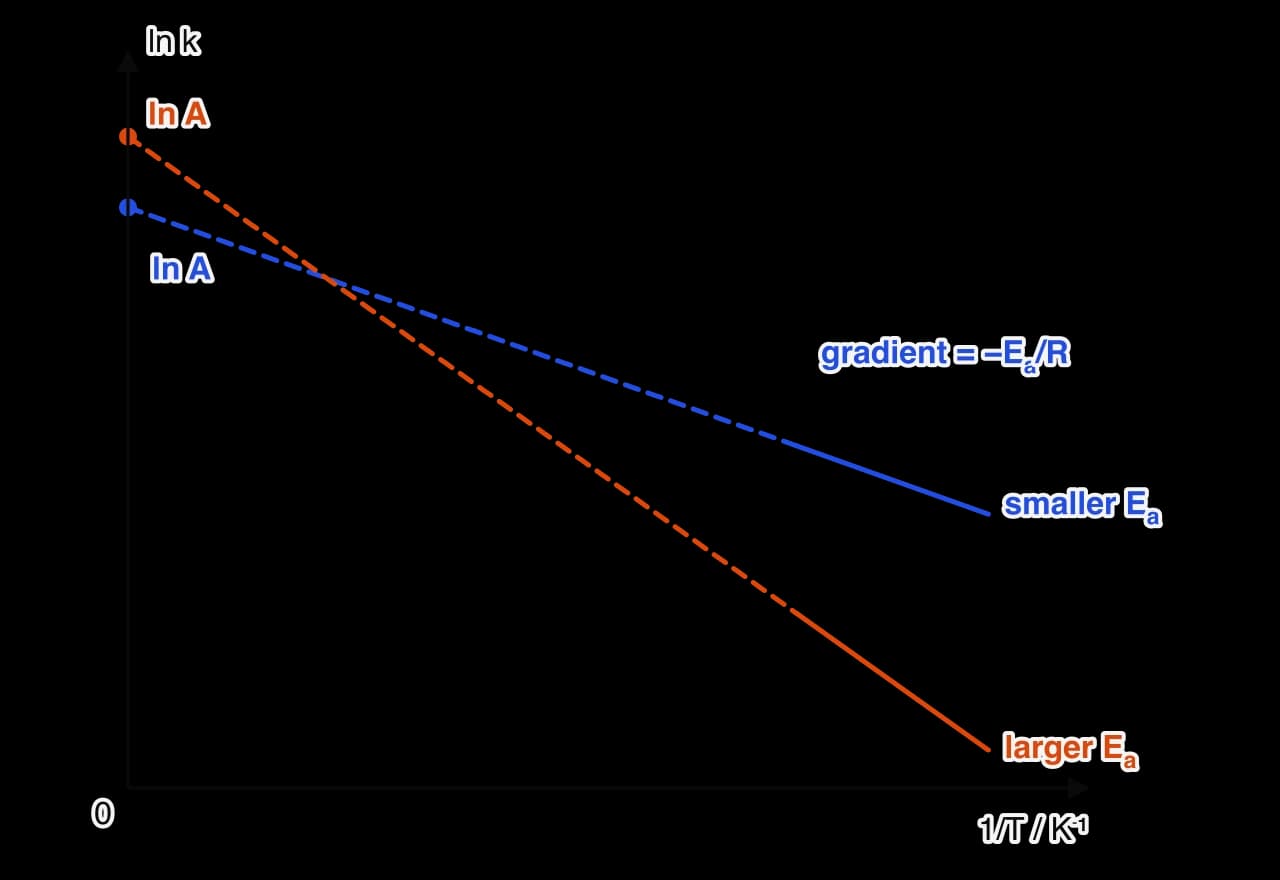
This has the form y=mx+c, with y=lnk and x=1/T. A graph of lnk against 1/T (an Arrhenius plot) is therefore a straight line with:
gradient =−REa, so Ea=−gradient×R;
intercept on the lnk axis (where 1/T=0) =lnA, so A=eintercept
The linear form of the Arrhenius equation: ln k against 1/T is a straight line with gradient −Eₐ/R and intercept ln A on the ln k axis. Measurements cover only a short range of 1/T (solid lines), so the intercept is found by extrapolation (dashed). The steeper line belongs to the reaction with the larger activation energy.
The line slopes downwards because a larger 1/T means a lower temperature and a smaller k. The gradient has units of K, since Ea/R has units of J mol−1÷J K−1mol−1=K. A steeper line means a larger activation energy: the rate constant of a reaction with a high Ea is more sensitive to temperature. A catalysed reaction, with a lower Ea, gives a less steep line.
Laboratory temperatures span only a narrow range of 1/T (from about 3.0 to 3.4×10⁻³K−1 for 20–60 °C), far from 1/T=0. The intercept is found either by extrapolating the line or, more reliably, by substituting the gradient and one point on the line into the linear form and solving for lnA.
A student measured the rate constant of a second-order reaction at five temperatures.
T / K
293
303
313
323
333
k / mol⁻¹ dm³ s⁻¹
0.00782
0.0161
0.0330
0.0638
0.116
Using two temperatures
When rate constants are known at only two temperatures, writing the linear form for each and subtracting eliminates lnA:
lnk1k2=REa(T11−T21)
This form is not printed in the data booklet, but it follows in one line from the linear form. It gives Ea from two measurements, or k at a new temperature when Ea is known. It is less reliable than a graph through several points, because an error in either value of k goes straight into the answer.
Measuring rate constants at several temperatures uses the same methods as any rate experiment, with each reactant solution brought to the temperature of a thermostatted water bath before mixing. With a clock reaction at fixed concentrations, k is proportional to 1/t, so a graph of ln(1/t) against 1/T has the same gradient, −Ea/R, and gives Ea without calculating k itself.
Applying the ideas in exam questions
Paper 1A: why temperature increases the rate
Paper 1A: choosing a method to follow a reaction
Paper 1A: the activation energy of the reverse reaction
Paper 1A: powder and chips
Paper 1B: the thiosulfate reaction
A student investigates how the concentration of sodium thiosulfate affects the rate of its reaction with hydrochloric acid. In each run, a volume of 0.150mol dm−3NaX2SX2OX3(aq) is made up to 50.0cm3 with water in a conical flask standing on a paper cross. 10.0cm3 of 1.00mol dm−3HCl(aq) is added and a stopwatch is started. The time is recorded when the cross can no longer be seen. Each run is carried out three times.
Volume of NaX2SX2OX3(aq) / cm³ ± 0.1
Volume of water / cm³ ± 0.1
Mean time, t / s ± 1
1/t / s⁻¹
50.0
0.0
21
0.048
40.0
10.0
26
0.038
30.0
20.0
34
20.0
30.0
51
0.020
10.0
40.0
101
0.0099
Paper 2: decomposition of hydrogen peroxide
Paper 1A: units of the rate constant (HL)
Paper 1A: a two-step mechanism (HL)
Paper 1A: activation energy from an Arrhenius plot (HL)
Paper 1B: an iodine clock investigation (HL)
A student investigated the effect of iodide concentration on the rate of SX2OX8X2−(aq)+2IX−(aq)2SOX4X2−(aq)+IX2(aq) using a clock method. Each mixture contained 10.0 cm³ of 0.0400mol dm−3KX2SX2OX8, 5.0 cm³ of 0.0100mol dm−3NaX2SX2OX3, 1 cm³ of starch, a volume of 0.200mol dm−3 KI and enough water to make 50.0 cm³. The time t for the blue-black colour to appear was measured with a stopwatch at room temperature.
Volume of KI / cm³ ± 0.1 cm³
[IX−] in mixture / mol dm⁻³
t / s ± 0.5 s
(1/t) / s⁻¹
10.0
0.0400
24.2
0.0413
8.0
0.0320
30.5
0.0328
6.0
0.0240
39.6
4.0
0.0160
61.0
0.0164
2.0
0.0080
119.4
0.00838
Paper 2: rate equation and mechanism of a gas-phase reaction (HL)
Nitrogen monoxide reacts with hydrogen at high temperature: 2NO(g)+2HX2(g)NX2(g)+2HX2O(g). Initial rates were measured at constant temperature.
Run
[NO] / mol dm⁻³
[HX2] / mol dm⁻³
Initial rate / mol dm⁻³ s⁻¹
1
6.00×10⁻³
1.00×10⁻³
9.00×10⁻⁵
2
6.00×10⁻³
2.00×10⁻³
1.80×10⁻⁴
3
1.20×10⁻²
1.00×10⁻³
3.60×10⁻⁴
Paper 2: the Arrhenius equation (HL)
Self-check
To do:
I can define rate of reaction and express it for a named reactant or product, in suitable units.
To do:
I can calculate an average rate from data, and an instantaneous or initial rate from the gradient of a tangent.
To do:
I can convert a rate of gas production in cm³ s⁻¹ into a rate of change of concentration.
To do:
I can explain why the rate of a reaction decreases as it proceeds.
To do:
I can choose a suitable method to follow a given reaction (gas volume, mass, colorimetry, pH, conductivity, pressure, titration of quenched samples, timing a fixed change) and justify the choice.
To do:
I can state whether time is the independent or the dependent variable in a rate experiment.
To do:
I can state the relationship between the average kinetic energy of particles and the absolute temperature.
To do:
I can state the two conditions for a successful collision and explain the role of collision geometry.
To do:
I can define activation energy and sketch energy profiles for exothermic and endothermic reactions, with and without a catalyst.
To do:
I can calculate the activation energy of a reverse reaction from the forward activation energy and ΔH.
To do:
I can sketch and label a Maxwell–Boltzmann distribution and mark the activation energy on it.
To do:
I can sketch Maxwell–Boltzmann curves at two temperatures and use them to explain the effect of temperature on rate.
To do:
I can explain the effects of concentration, pressure, surface area, temperature and a catalyst on rate in terms of collision frequency and the fraction of collisions with E ≥ Ea.
To do:
I can predict how a curve of gas volume or mass against time changes when the conditions or the limiting reactant change.
To do:
I can identify the variables to control in a rate investigation, and recognize random and systematic errors on a graph.
To do:
I can explain how a catalyst works, why it does not change ΔH or the position of equilibrium, and show its effect on a Maxwell–Boltzmann curve.
To do:
I can distinguish homogeneous and heterogeneous catalysts and give examples, including enzymes and catalytic converters.
To do:
I can define elementary step, reaction mechanism and reaction intermediate, and show that the steps of a mechanism add up to the overall equation (HL).
To do:
I can distinguish between an intermediate and a transition state, and identify both on an energy profile (HL).
To do:
I can explain why the slowest step determines the rate of a reaction, including examples where the slow step is not the first step (HL).
To do:
I can sketch and interpret energy profiles for multistep reactions, and construct one consistent with kinetic data (HL).
To do:
I can state the molecularity of an elementary step as unimolecular, bimolecular or termolecular, and distinguish molecularity from order (HL).
To do:
I can explain why rate equations can only be determined by experiment and write a rate equation from given orders (HL).
To do:
I can deduce orders of reaction and the rate equation from initial-rate data, and calculate the rate constant (HL).
To do:
I can describe how a clock reaction is used to measure initial rates (HL).
To do:
I can sketch and identify concentration–time and rate–concentration graphs for zero, first and second order reactions, and use half-lives to recognize first order (HL).
To do:
I can deduce the units of the rate constant from the overall order and solve problems with the rate equation (HL).
To do:
I can deduce the rate equation predicted by a mechanism, including one with a fast pre-equilibrium, and evaluate whether a mechanism is consistent with experimental data (HL).
To do:
I can explain why a mechanism can be supported by evidence but never proven (HL).
To do:
I can describe how the rate constant depends on temperature and explain what the terms in the Arrhenius equation represent (HL).
To do:
I can determine the activation energy and the Arrhenius factor from a graph of ln k against 1/T, or from rate constants at two temperatures (HL).
Potential energy / kJ mol−1
Reactants
150
Highest point (transition state)
230
Products
60
What is the enthalpy change, ΔH, for the reaction, in kJ mol−1?
The rate has fallen to less than half of its early value, because the concentration of hydrogen peroxide is lower.
(c) Average rate of formation of oxygen over the first 60 s, expressed per dm3 of solution. One mole of OX2 forms for every two moles of HX2OX2 used, so the rate is half that in (a): 9.2×10⁻⁴mol dm−3s−1.
Amount of HCl used per second. The equation shows 2mol HCl per mole of COX2: 2×7.75×10−5=1.55×10⁻⁴mol s−1.
Change in concentration per second. The acid volume is 50.0cm3=0.0500dm3:
rate=0.05001.55×10−4=3.10×10⁻³mol dm−3s−1
)
A sketch of the profile, with both levels marked, is a quick check on the sign.
is about
1.7×10⁻⁹
at
298K
and about
3.3×10⁻⁹
at
308K
: almost twice as many. A larger activation energy makes the effect of temperature larger still.
. The equation
Mg(s)+2HCl(aq)MgClX2(aq)+HX2(g)
needs only
8.2×10⁻³mol
HCl, so the acid is in large excess and magnesium is limiting.
(a) The curve is steeper at the start but levels off at the same final volume. At the higher temperature a greater proportion of collisions have E≥Ea (and collisions are slightly more frequent), so the rate is higher; the amount of magnesium, which fixes the volume of hydrogen, is unchanged.
(b) The final volume halves, because the amount of the limiting reactant halves. The initial gradient is lower too, because the smaller piece of ribbon has a smaller surface area in contact with the acid.
;
MnOX2(s)
in the decomposition of
HX2OX2(aq)
; platinum, palladium and rhodium in catalytic converters
IX− and IOX− appear on both sides and cancel, leaving 2HX2OX2(aq)2HX2O(l)+OX2(g).
Classify the species.IOX− is formed in step 1 and used up in step 2, so it is the intermediate. IX− is used up in step 1 and regenerated in step 2, so it is the catalyst.
.
Draw two humps. The first barrier (step 1) is the larger. The intermediate I (with Y alongside) sits in the trough between them. The second barrier, measured from the trough, is small.
Place the products. The reaction is endothermic, so the product level is above the reactant level and ΔH is positive.
An energy profile consistent with rate = k[X] for an endothermic reaction: the first step (X → I) has the larger activation energy (blue), the intermediate I sits in the trough, the second step has a small barrier (orange), and the products lie above the reactants (ΔH positive, green).
bimolecular
k[NOX2]2
bimolecular
k[HX2OX2][IX−]
(if it were one step)
termolecular
k[NO]2[OX2]
is constant,
[IX−]
doubles and the rate doubles. First order with respect to
IX−
, even though the equation has
2IX−
.
; second order overall.
. A zero-order reactant would fall by equal amounts (not equal fractions) in equal times; a second-order reactant would have half-lives that double each time.
. This does not match the experimental first order in
ICl
, so it is rejected. A termolecular step is also unlikely.
Mechanism 2 adds up: HI is formed and then used, leaving HX2+2IClIX2+2HCl. Its slow step involves one HX2 and one ICl, predicting rate =k[HX2][ICl], which matches. It is consistent with the data, and HI is the intermediate.
Mechanism 3 adds up (ClX2 cancels), but its slow step involves only ICl, predicting rate =k[ICl]2, with HX2 zero order. This does not match, so it is rejected.
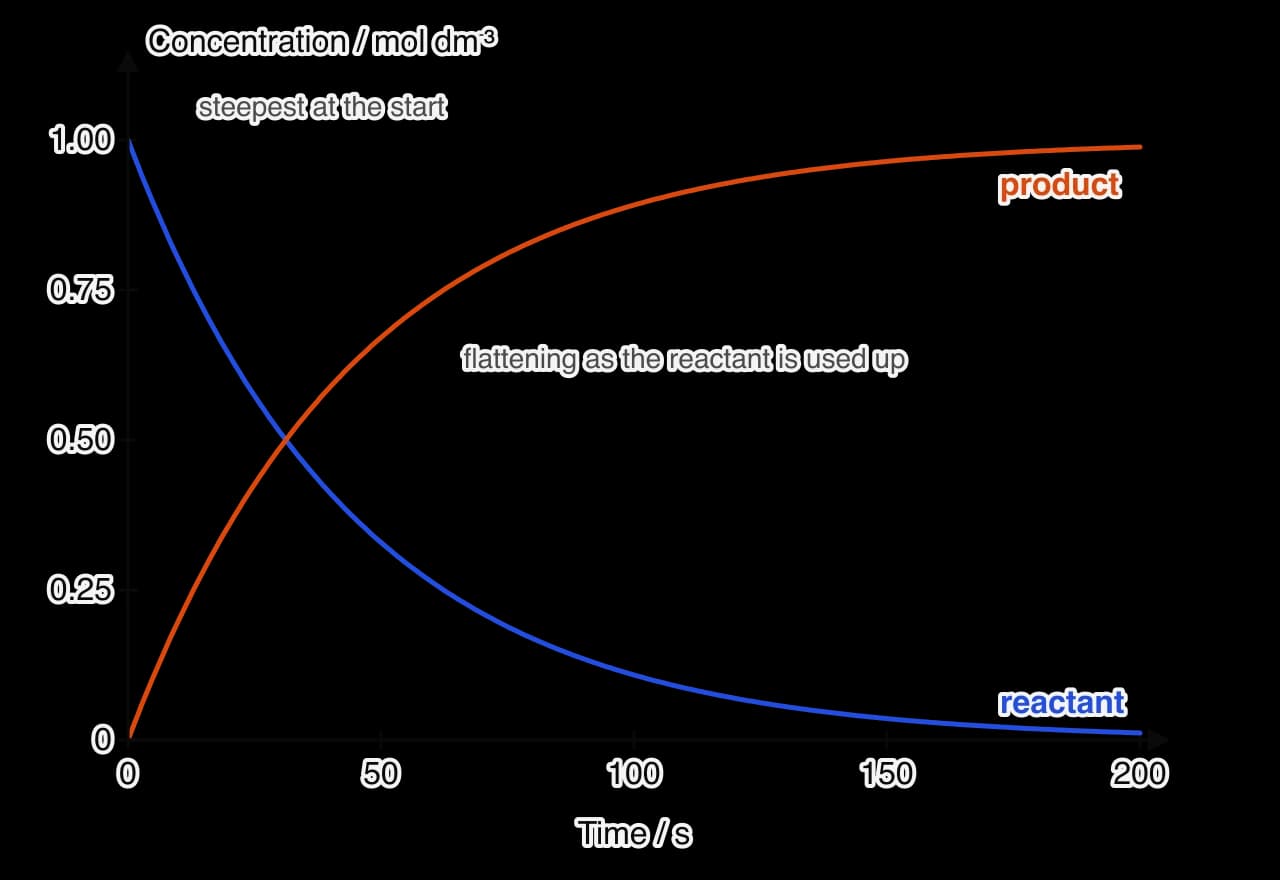
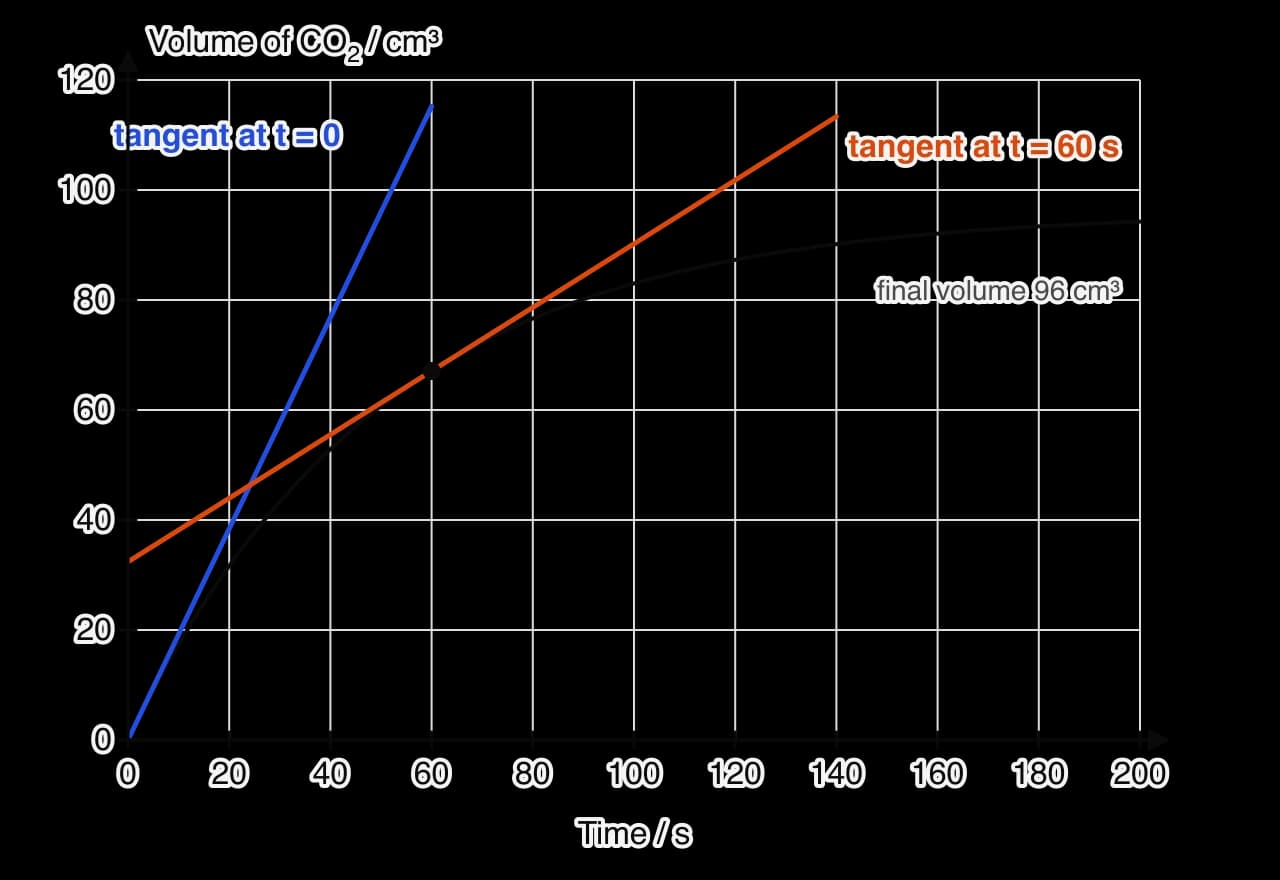
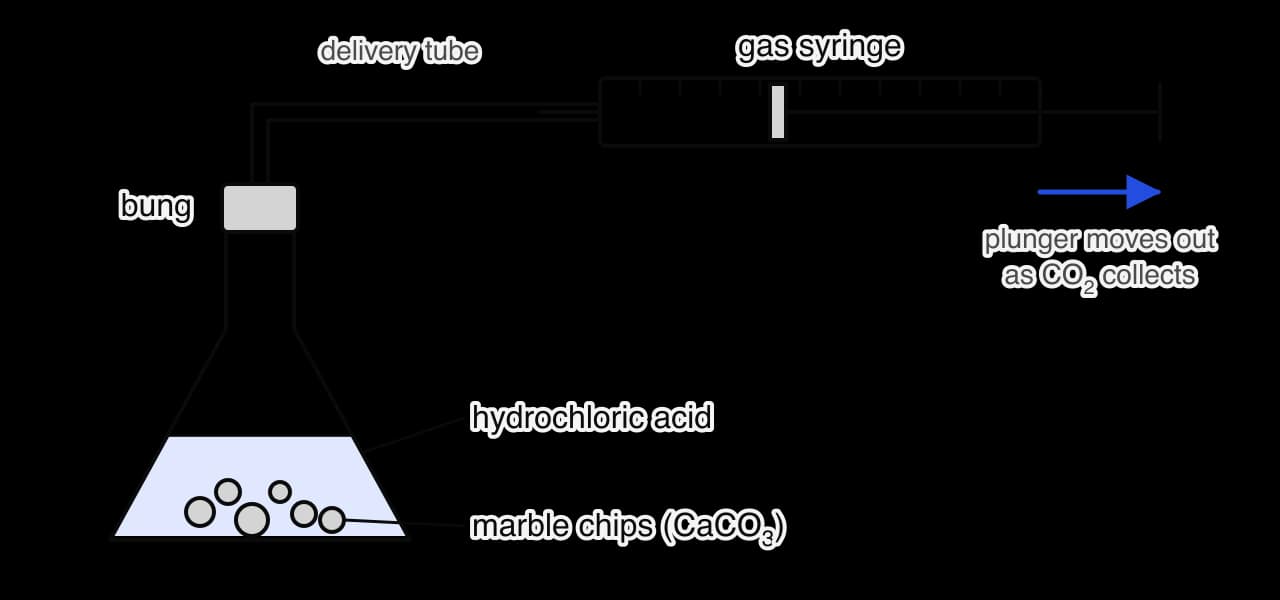
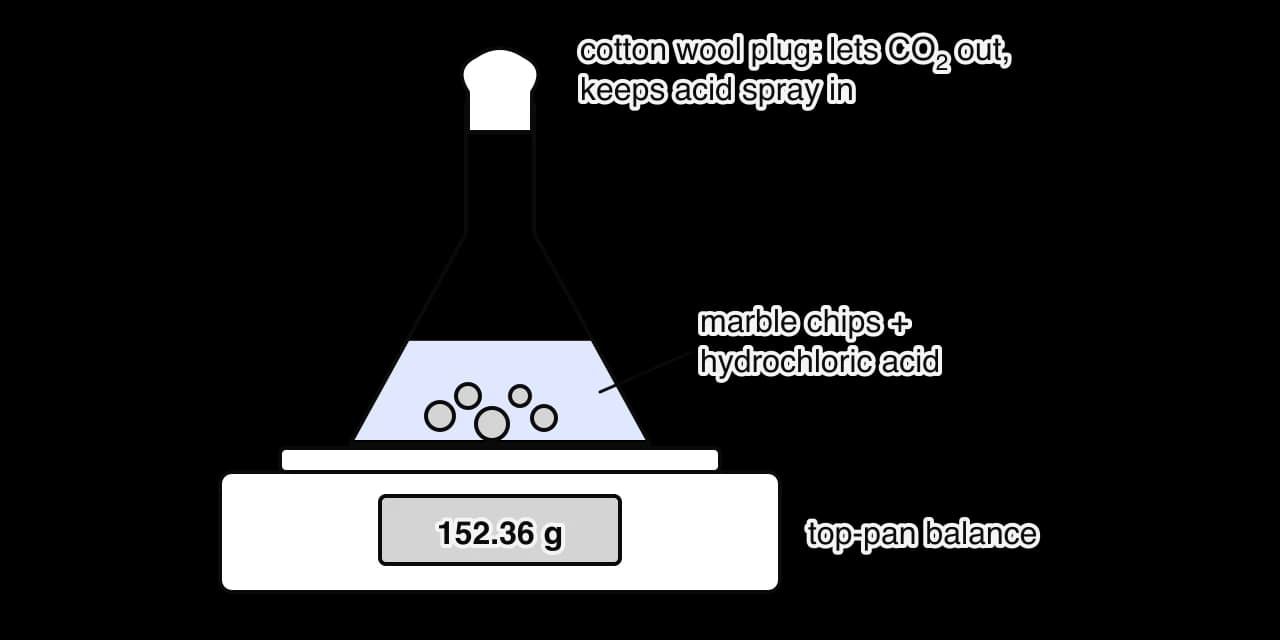
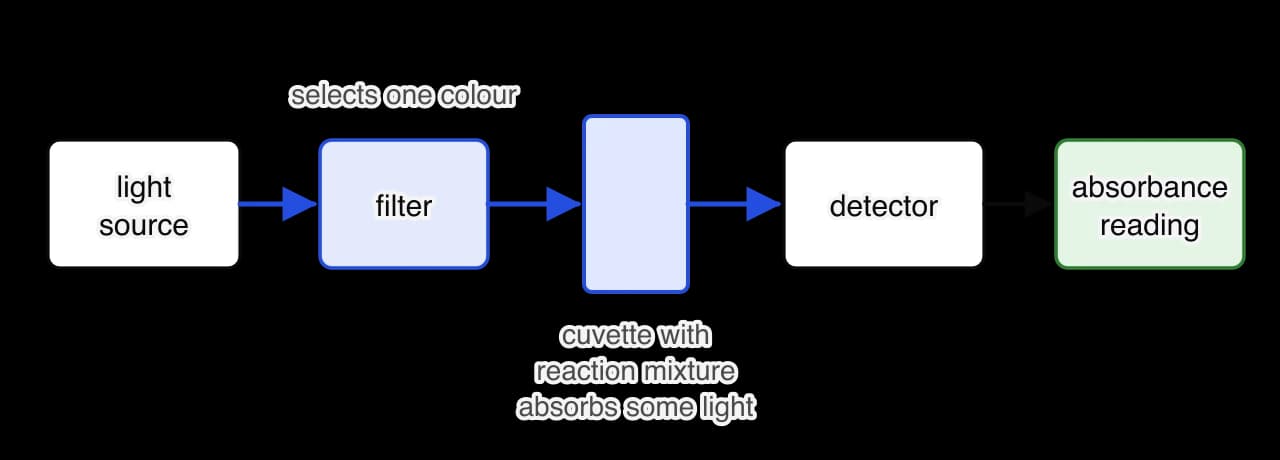
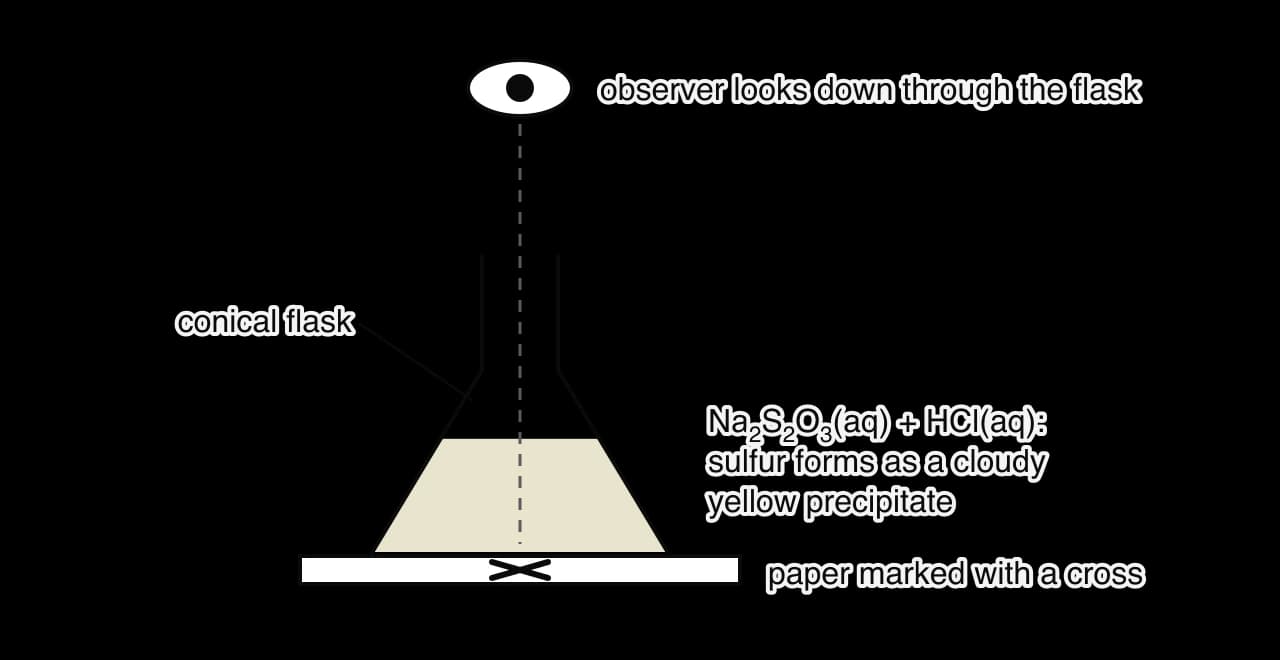
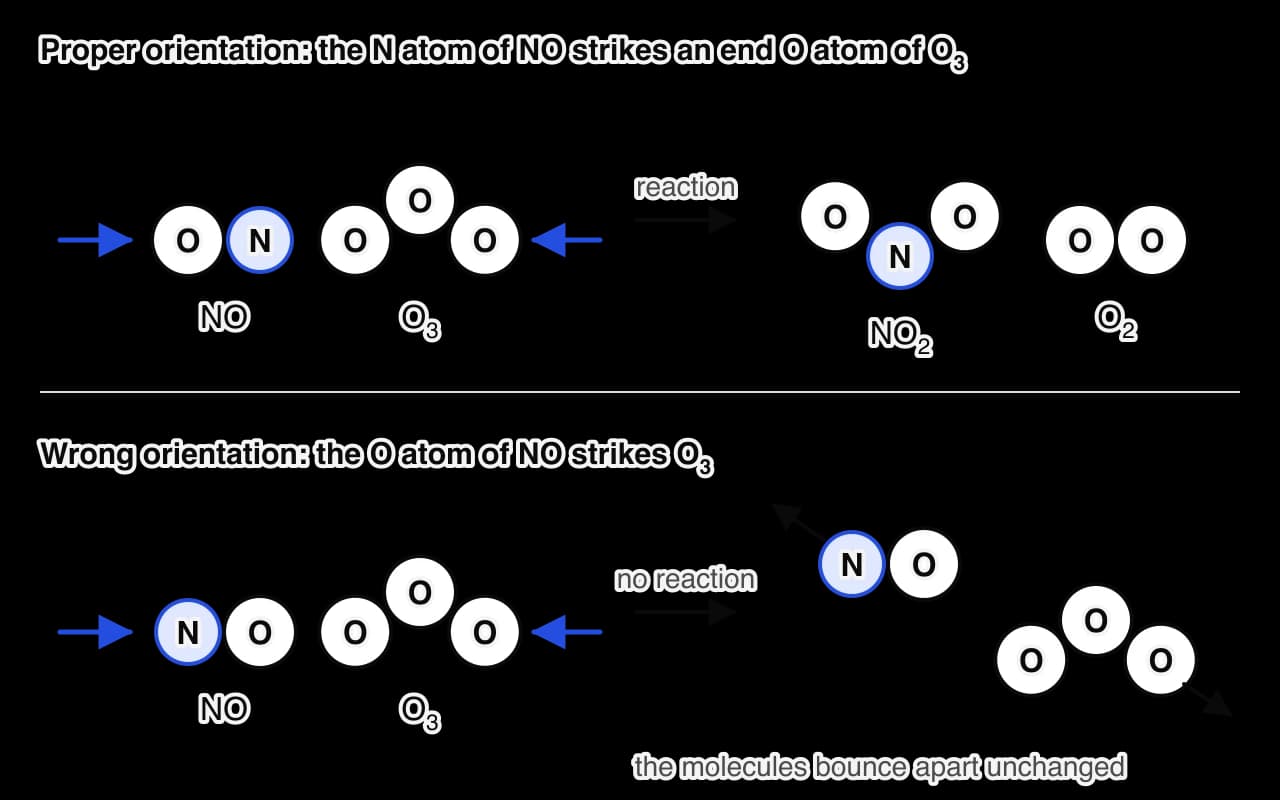
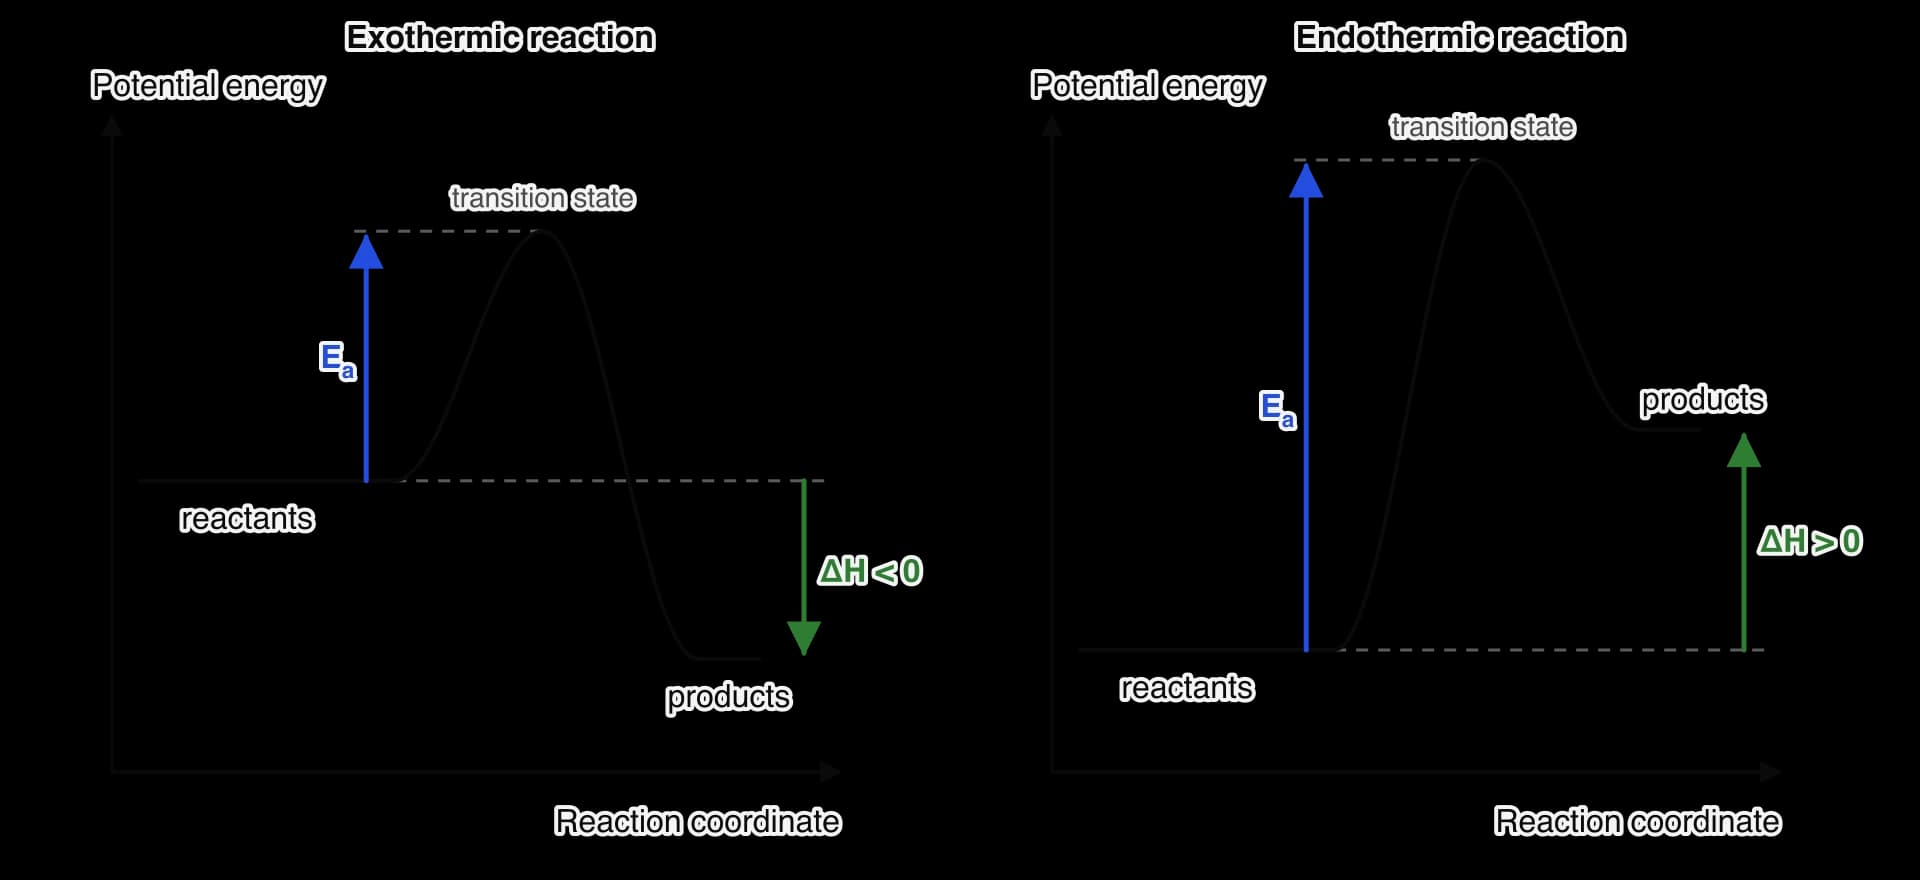
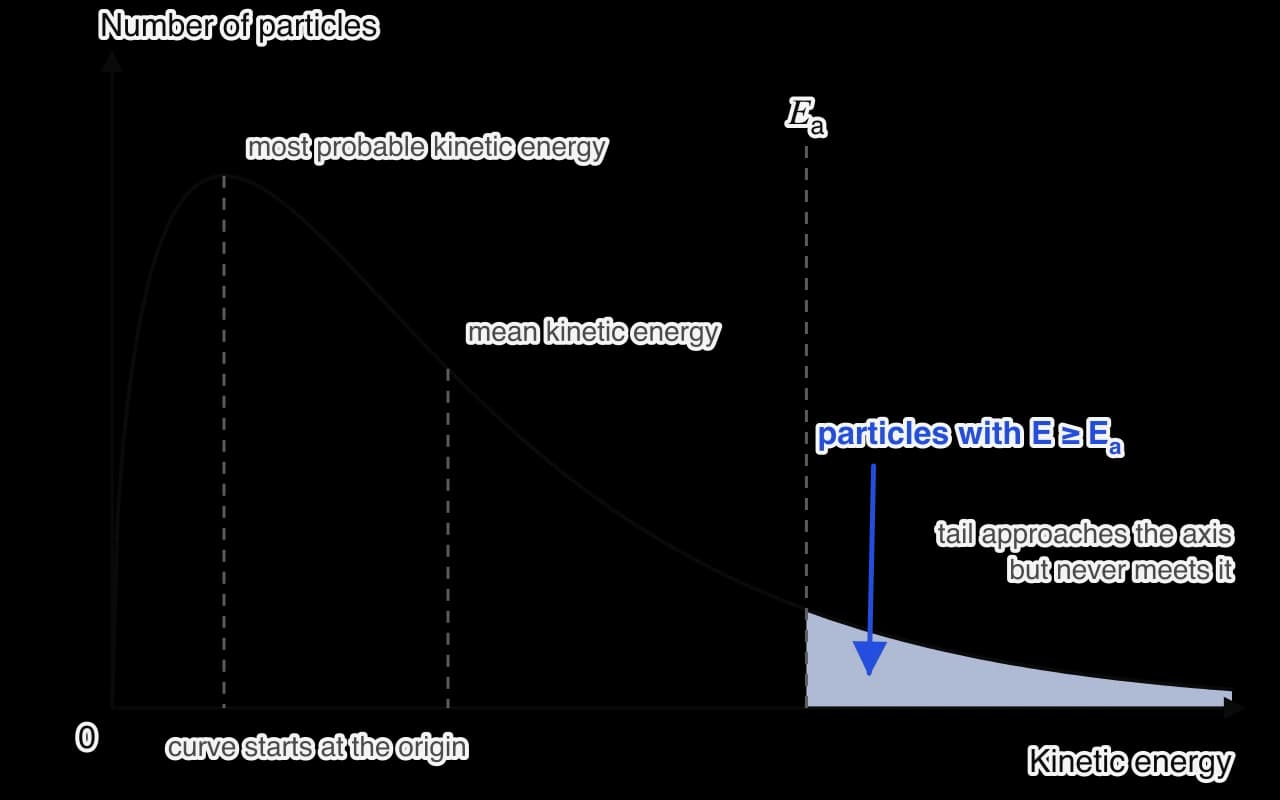
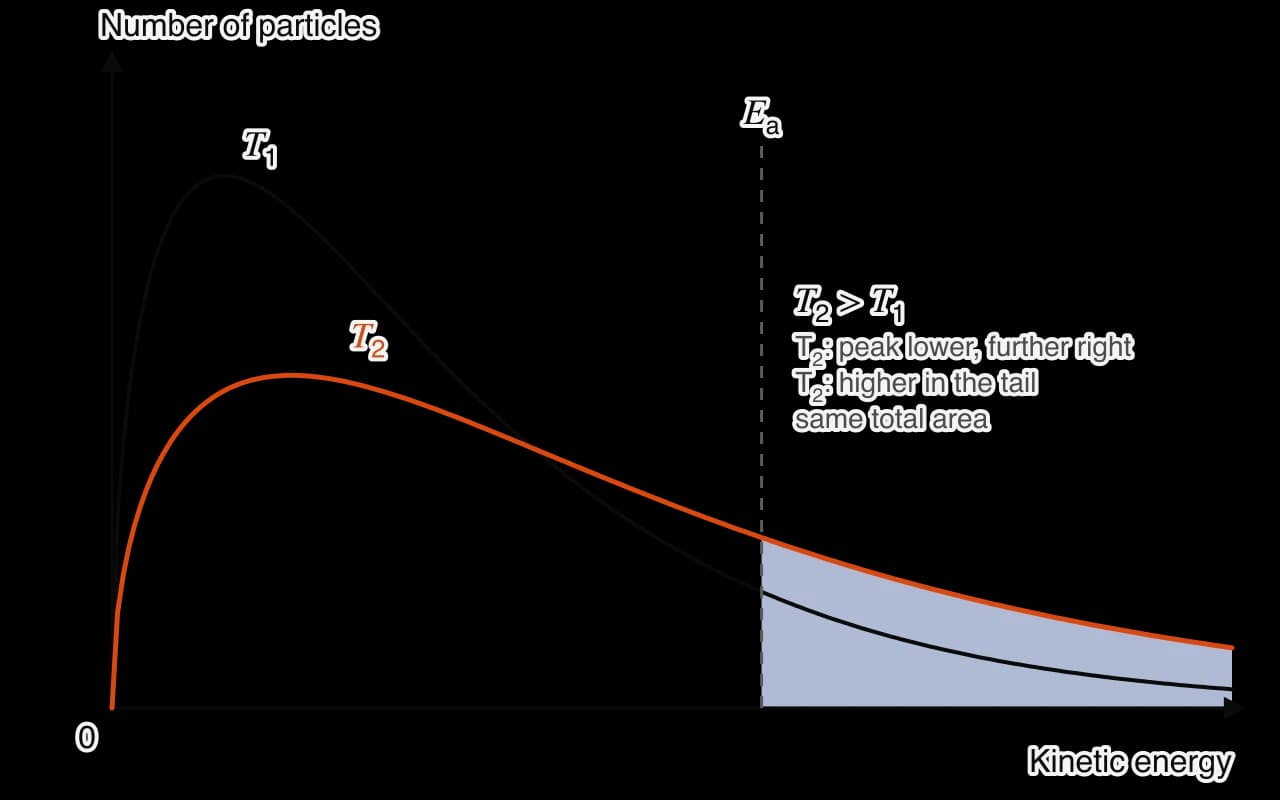
 YouTube
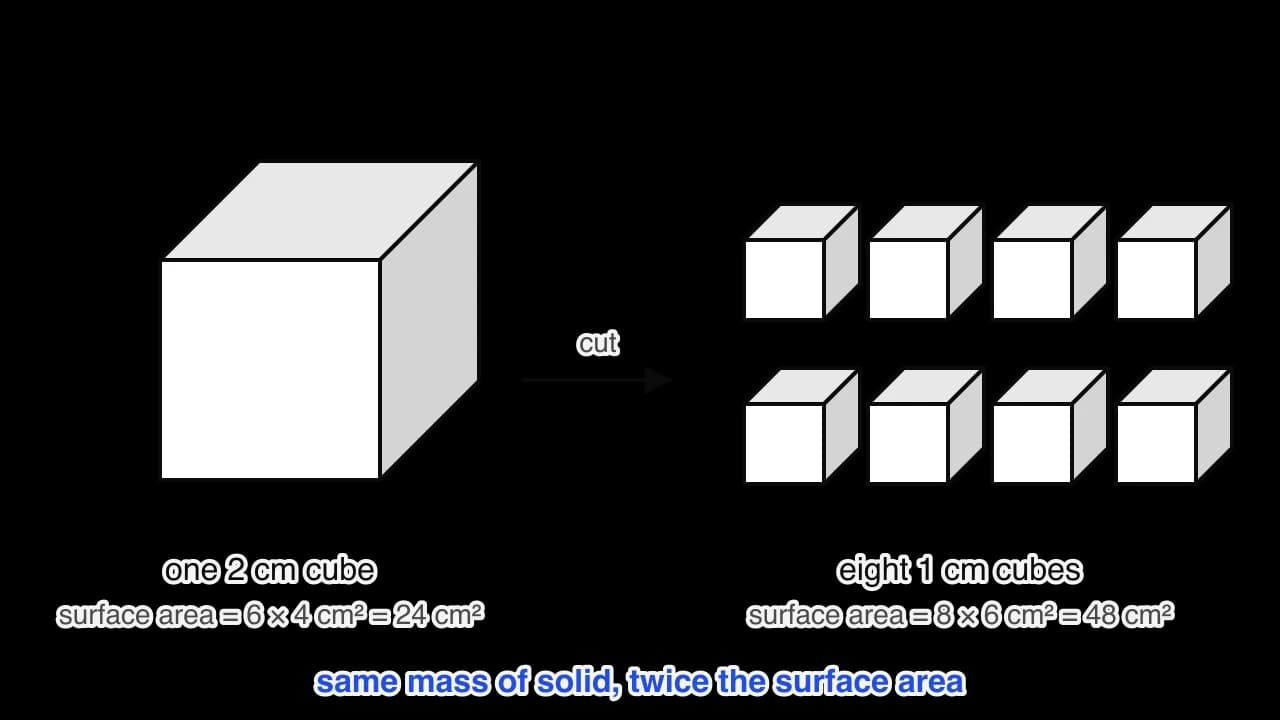
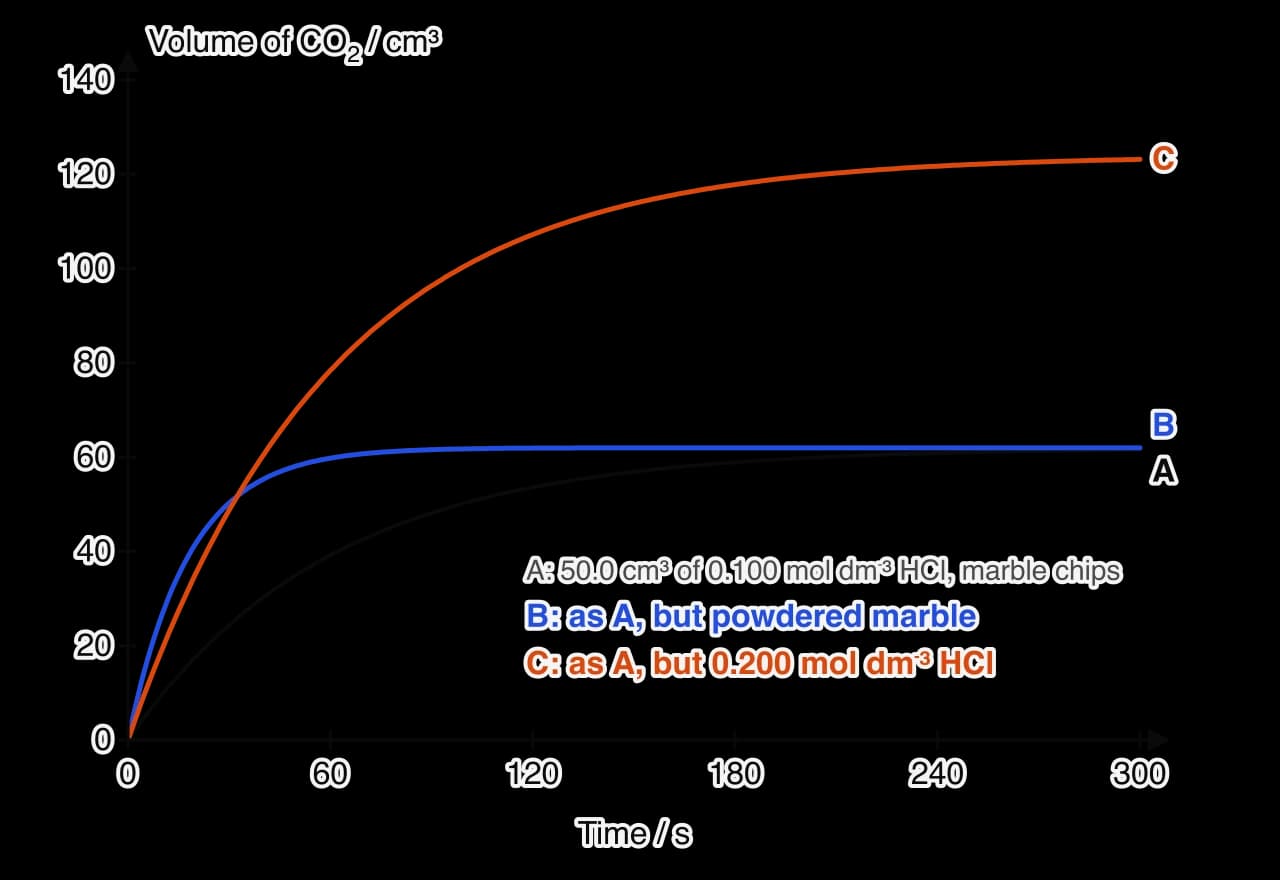
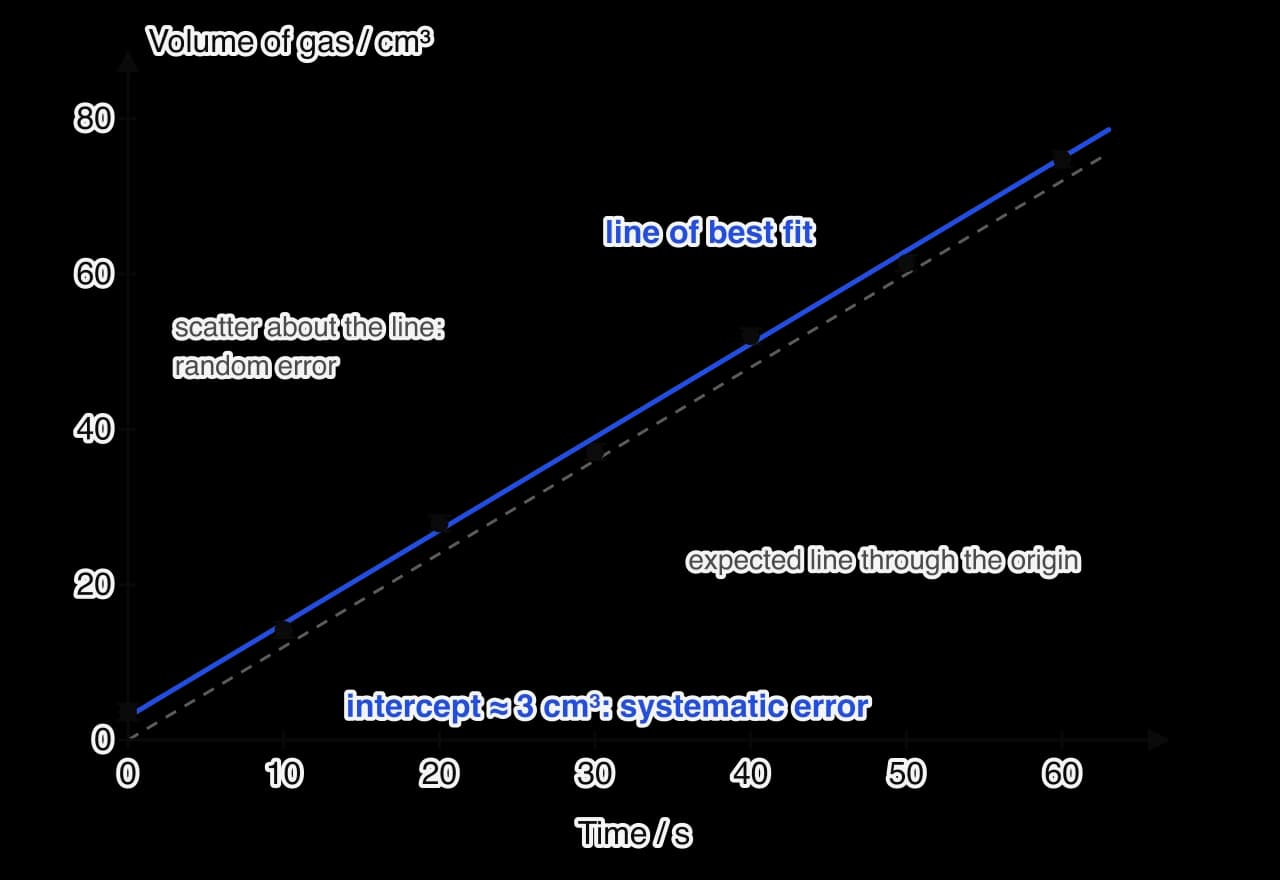
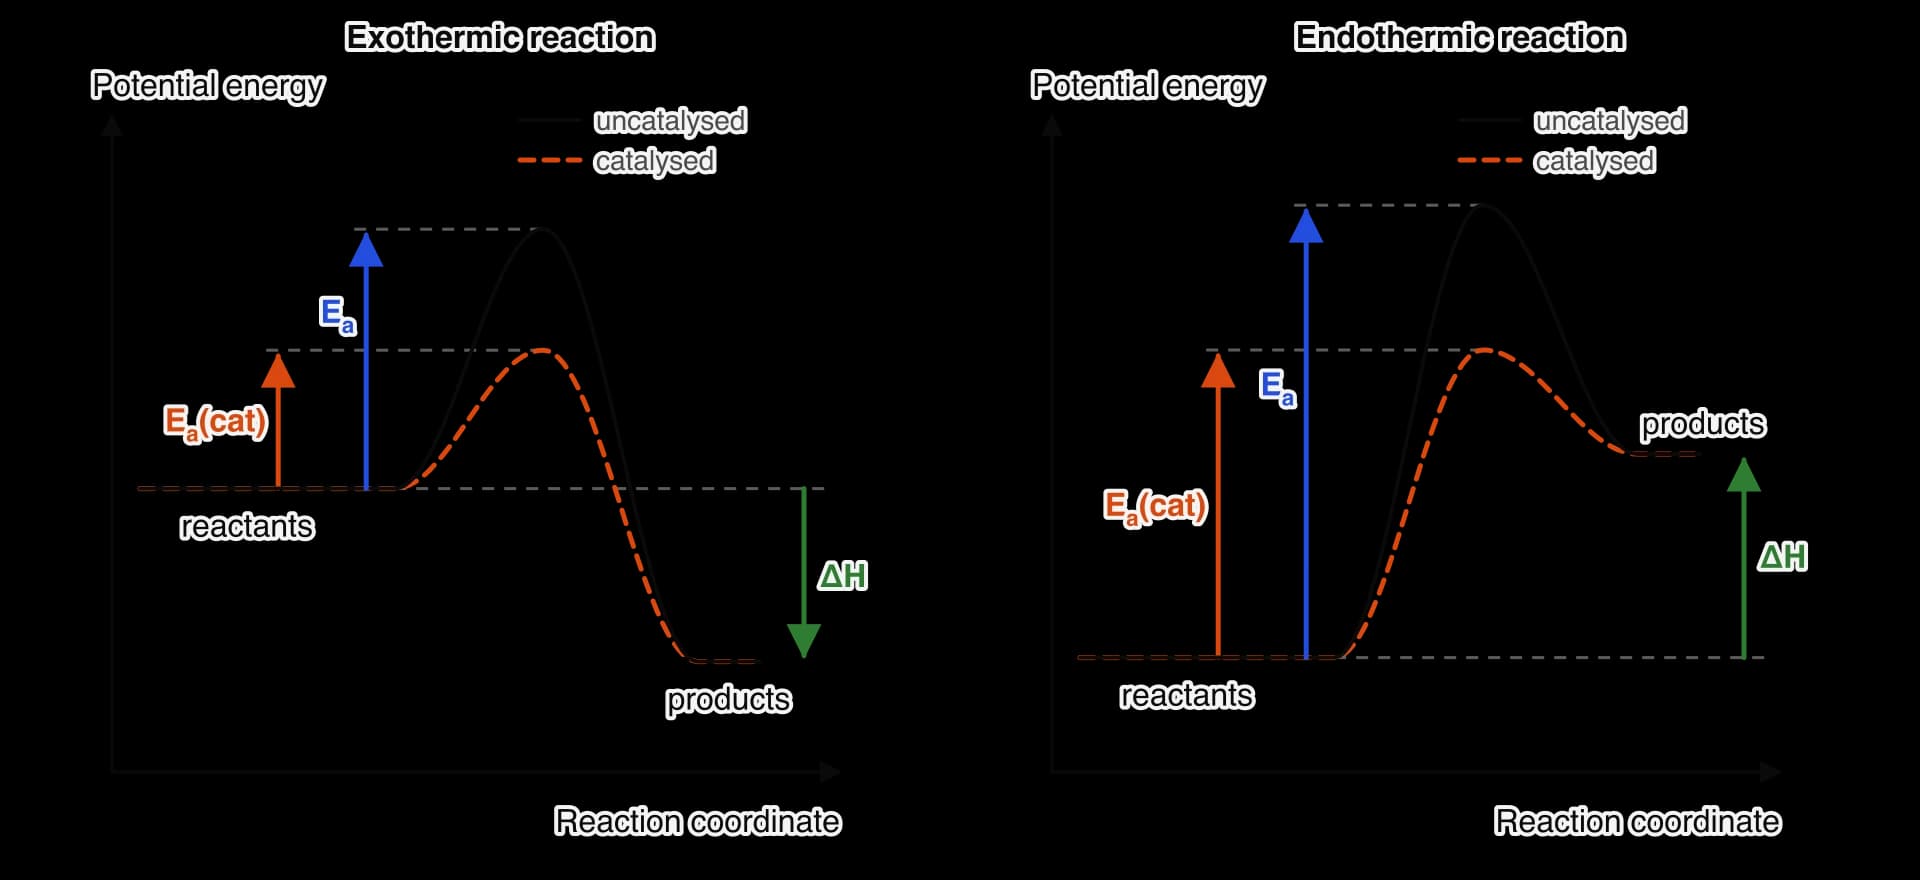
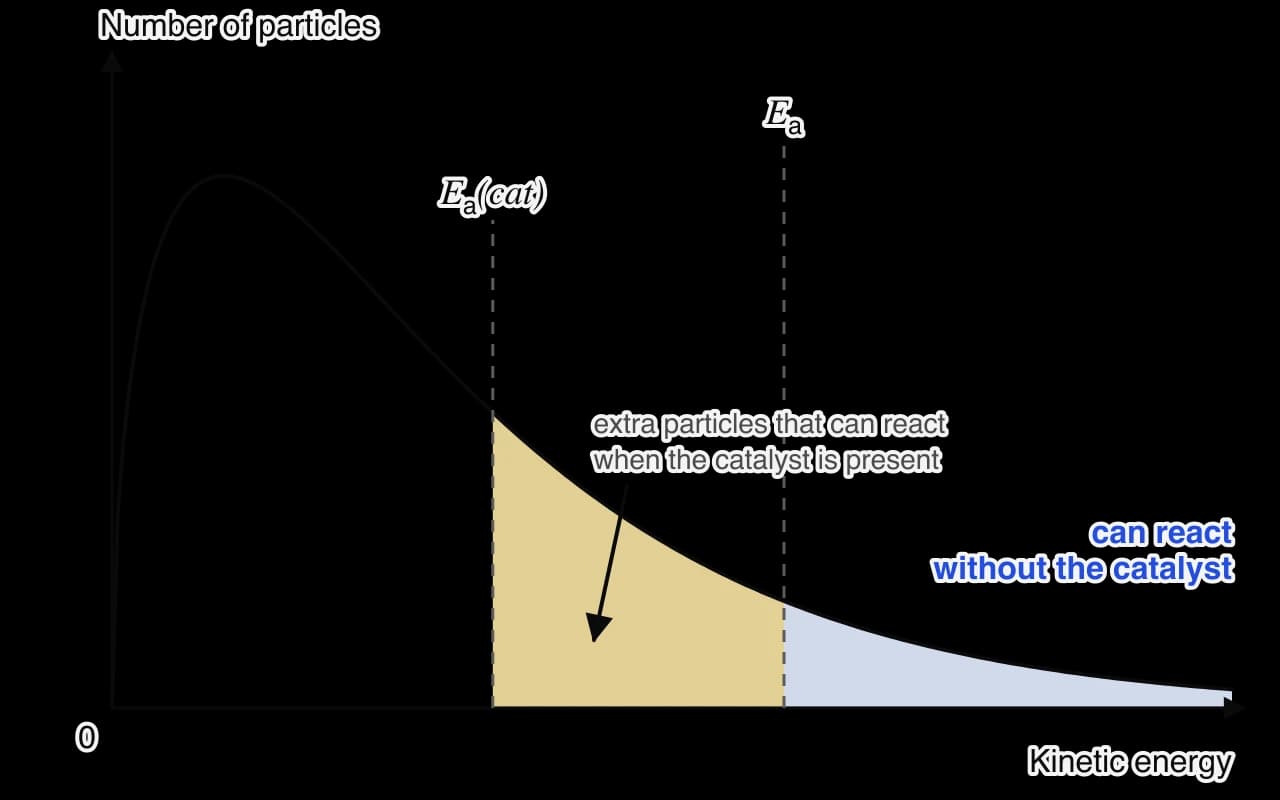
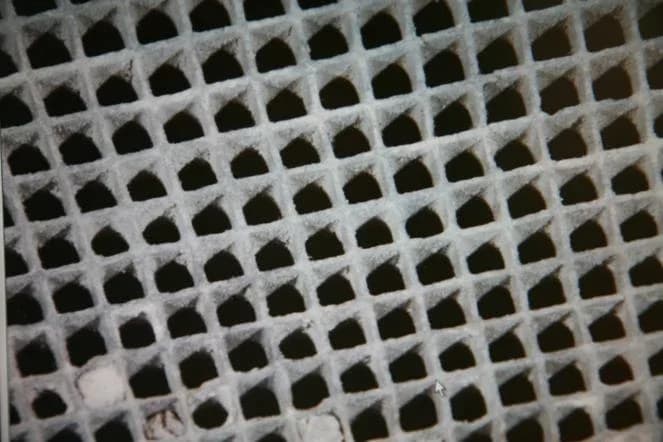
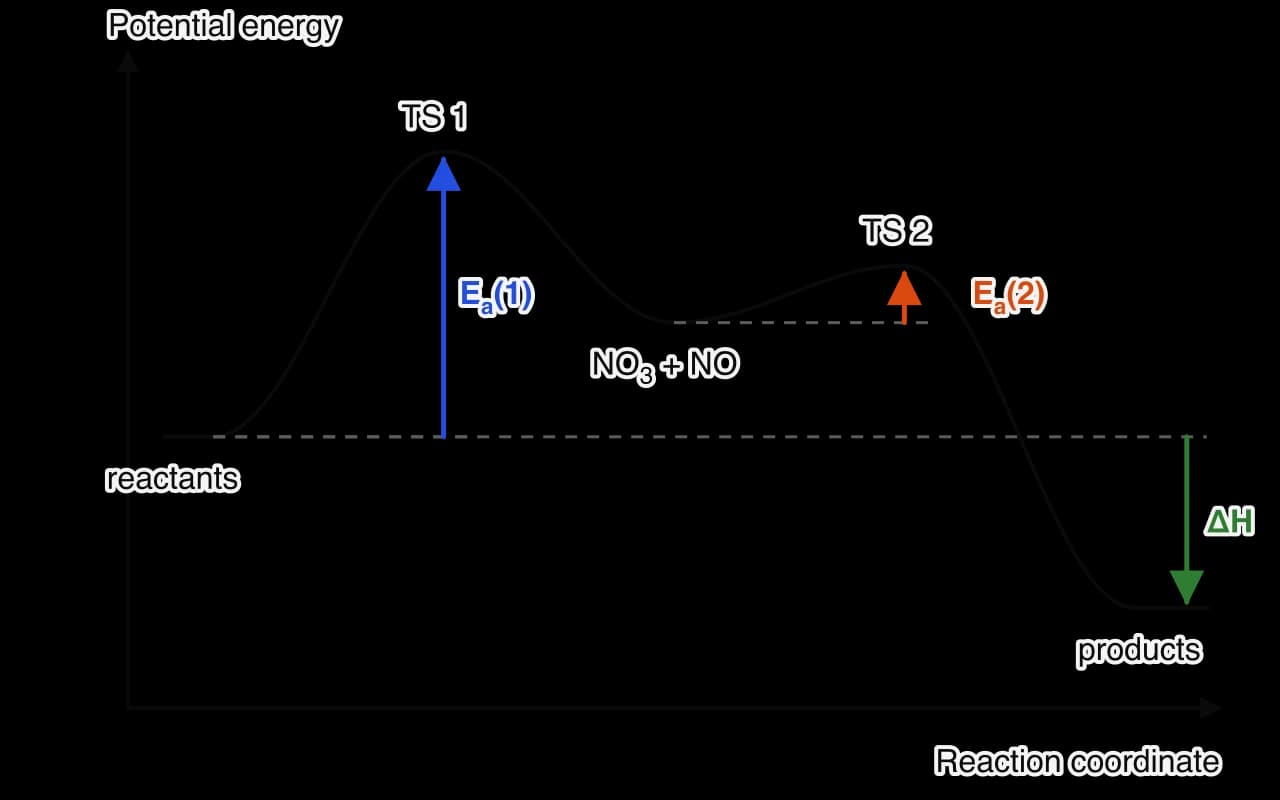
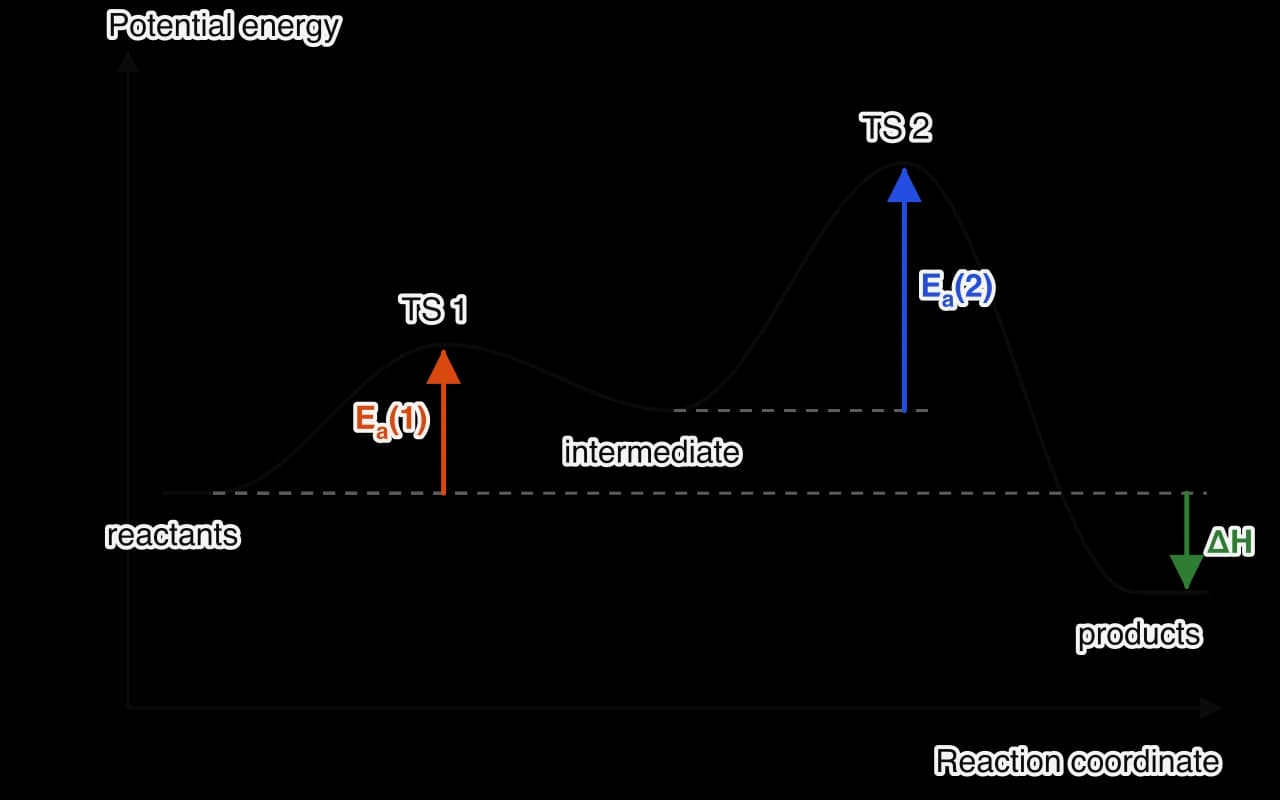
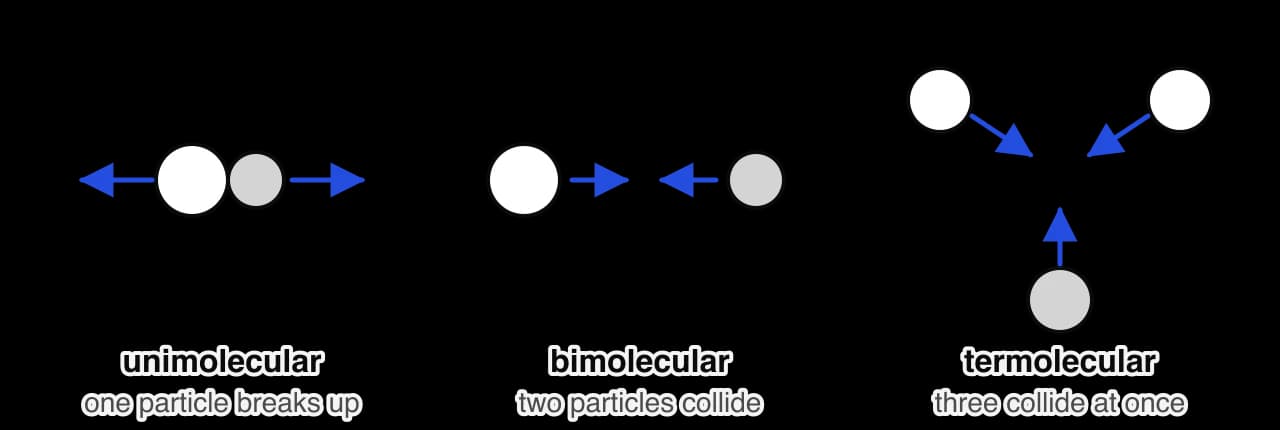
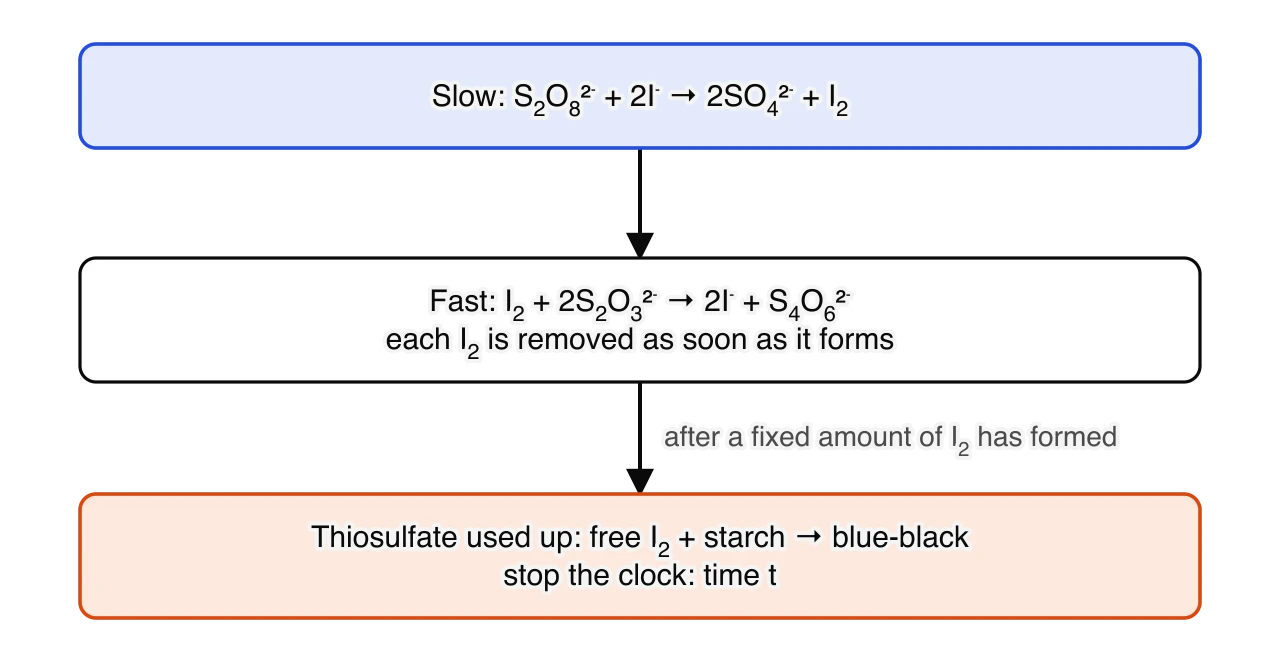
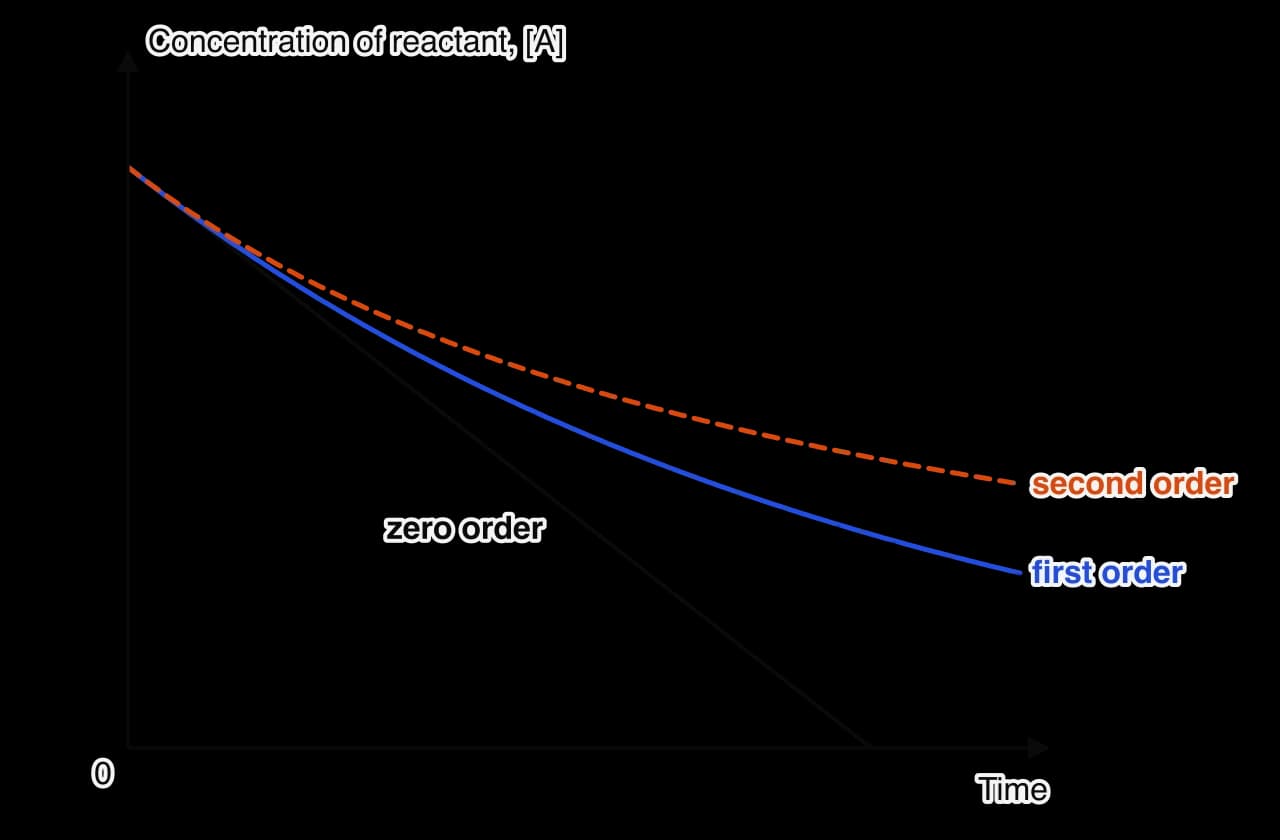
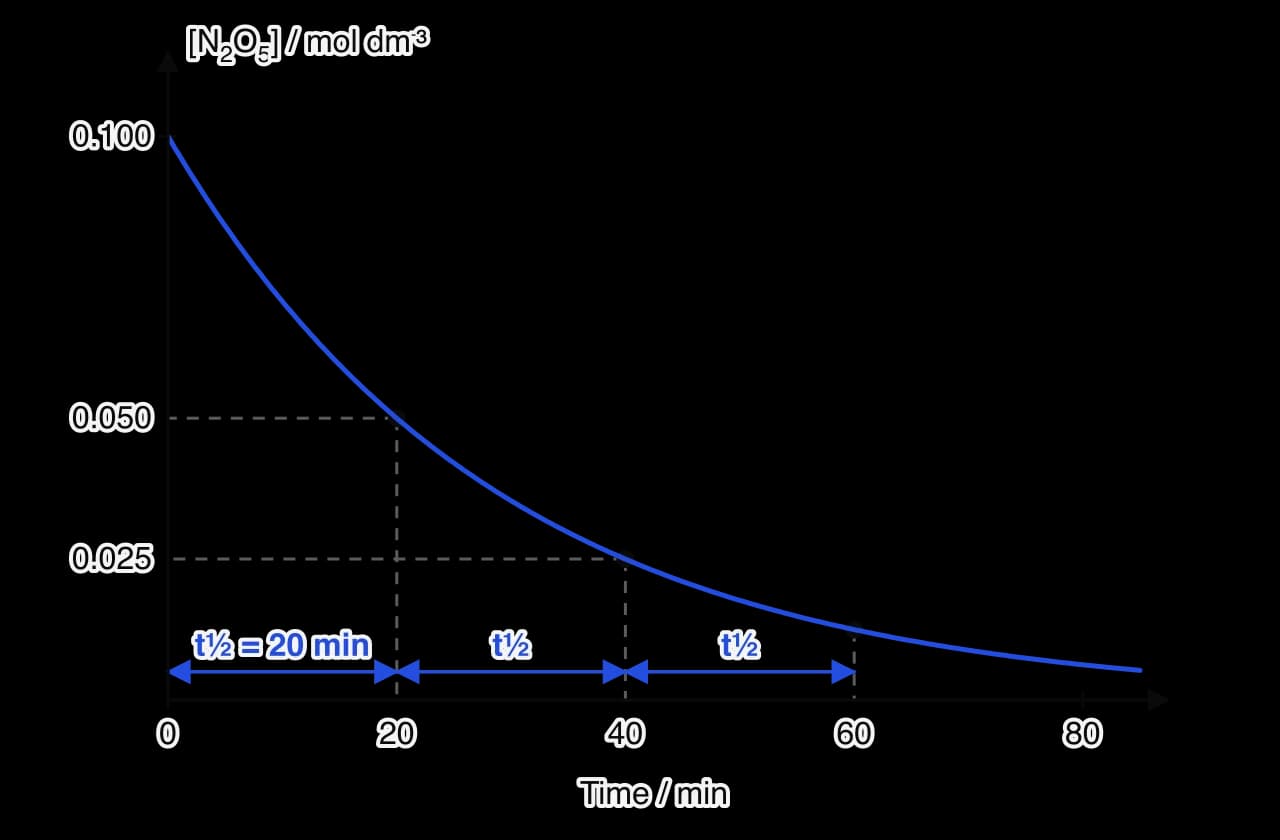
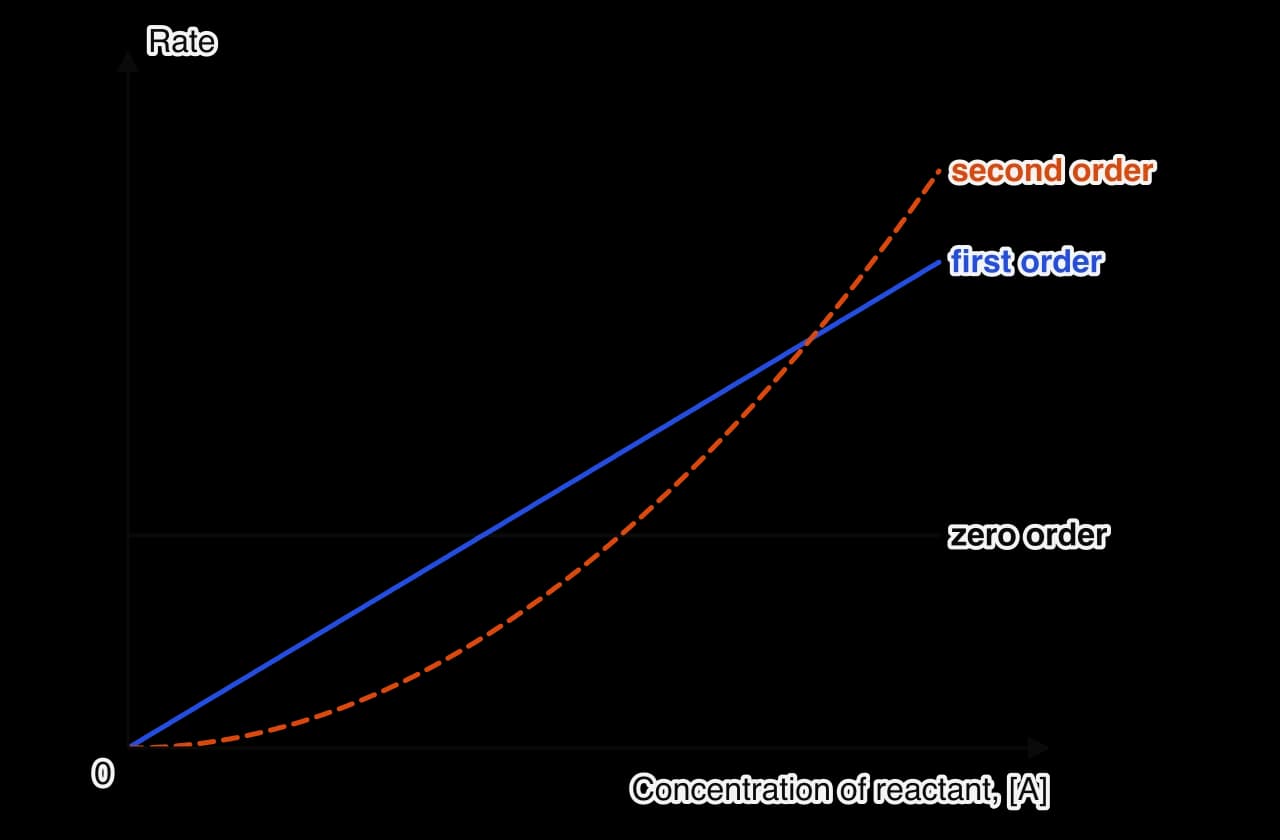
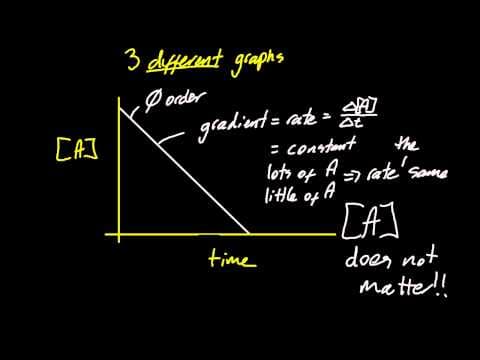 YouTube