Classify costs as fixed, variable, semi-variable, direct or indirect, calculate total and average cost and revenue, and explain the revenue streams businesses use, with real examples.
Each is in the Business glossary, with every other term in the subject.
The cost per unit of output, calculated as total cost divided by the quantity produced.
The revenue received per unit sold, calculated as total revenue divided by the quantity sold; equal to the price when every unit sells at the same price.
A cost that can be clearly identified with and allocated to a particular product, service or department, such as the raw materials or labour used to make it.
A cost that does not change with the level of output in the short run, such as rent, insurance and salaries; it must be paid even if output is zero.
A cost that cannot be linked to a single product or service because it is shared by the whole business or several products, such as head office rent, administration and insurance.
The amount by which total revenue exceeds total cost in a period; if total cost is greater than total revenue, the result is a loss.
A distinct source from which a business earns revenue, such as product sales, subscriptions, advertising, licensing, commission or renting out assets.
A cost with both a fixed element, paid regardless of output, and a variable element that changes with output, such as a utility bill with a standing charge.
Define fixed, variable, semi-variable, direct and indirect costs, total cost and average cost.
Explain how fixed, variable and total costs change as output changes, using graphs.
Distinguish between direct and indirect (overhead) costs, using examples.
Explain why the classification of a cost can depend on the business and the time period.
Calculate total cost, average cost, total revenue, average revenue and profit.
Explain the main revenue streams of businesses, using real examples.
Analyse how a business's mix of costs and revenue streams affects its profit.
Every business pays costs to produce and sell its products, and it needs revenue to cover those costs. Knowing which costs rise with output and which do not, which costs belong to which product, and where revenue comes from allows managers to set prices, plan output and judge whether a product is worth making.
Decisions about costs and revenue are linked to the key concepts. A firm that cuts costs by paying suppliers less raises questions of ethics; one that invests to cut energy use can lower costs and improve sustainability; and new revenue streams, such as subscriptions or advertising, are often the result of creativity in how a product is sold.
109 exam-style questions on this subtopic, written in the style of the IB papers. The first has its markscheme open. Counted on
Hollis Brickworks
Hollis Brickworks (Hollis) is a public limited company that makes clay bricks at a single site in Leicestershire, England. Its kilns run 24 hours a day. Over the past ten years Hollis has expanded the site three times, adding larger kilns and automated cutting machines. Table 1 shows the company’s estimated annual total costs at different levels of output.
Hollis currently produces 40 million bricks a year. A national house builder has offered Hollis a five-year contract that would raise annual output to 50 million bricks. To meet it, Hollis would have to run older back-up kilns, hire agency staff for night shifts and add a fourth layer of supervisors.
Table 1: Estimated annual total costs of Hollis at different levels of output
Output (million bricks) | 10 | 20 | 30 | 40 | 50 |
|---|---|---|---|---|---|
Total costs (£000) | 3 000 | 5 200 | 7 200 | 9 200 | 12 500 |
Average cost per brick (£) | 0.30 | 0.24 | 0.23 |
Using Table 1, calculate the average cost per brick at an output of 20 million bricks and of 50 million bricks (show all your working).
2 marks
The official deck for this part of the syllabus.
What is a cost for a business?
State the two separate ways in which businesses classify costs.
With a free account, Augment remembers where you stopped and what you have practiced.
The sum of all the fixed and variable costs of producing a given level of output: total fixed cost plus total variable cost.
The total income a business receives from selling its output in a period, calculated as price multiplied by the quantity sold.
A cost that changes in direct proportion to the level of output, such as raw materials, packaging and piece-rate wages; it is zero when output is zero.
A cost is any payment a business must make to produce and sell its goods or services: wages, rent, materials, energy, advertising, interest. Businesses classify costs in two separate ways, because they need answers to two different questions.
How does the cost behave when output changes? This divides costs into fixed costs and variable costs (and semi-variable costs, which are partly both). It helps managers forecast costs at different levels of output, set prices and find the output needed to break even.
Can the cost be traced to a particular product? This divides costs into direct costs and indirect costs (overheads). It helps managers work out the full cost of each product and decide which products are worth making.
The two classifications overlap: a cost can be fixed and direct, fixed and indirect, variable and direct, or variable and indirect. Each classification is explained in turn, then the two are brought together.
Fixed costs are costs that do not change when the level of output changes, within a given time period. A bakery pays the same rent whether it bakes 100 loaves a day or 1,000. Fixed costs must be paid even if the business produces nothing, so a business with high fixed costs needs to sell a lot to cover them.
Typical fixed costs are rent, business rates or property taxes, insurance, salaries of managers and office staff, interest on loans, licence fees, and spending on advertising campaigns. Total fixed cost is often written FC (or TFC).
"Fixed" does not mean that the cost never changes. A landlord may raise the rent next year, or a business may take on a larger building. Fixed costs are fixed only in relation to output, and only within a time period and range of output: if the bakery wanted to bake 5,000 loaves a day, it would need a second oven and more space, so its fixed costs would rise to a new level. Costs that rise in such jumps when capacity is exceeded are sometimes called stepped fixed costs.
Variable costs are costs that change directly with the level of output. If output doubles, total variable cost doubles; if output is zero, variable cost is zero. For a bakery, flour, yeast, packaging and the energy used to bake each batch are variable costs.
Variable costs are usually measured per unit. If each loaf uses $1.50 of ingredients, packaging and energy, the variable cost per unit is $1.50, and the total variable cost (VC) is the variable cost per unit multiplied by the number of units produced.
Other examples are raw materials and components, wages paid per unit produced (piece rates), sales commission paid per item sold, delivery costs per order, and royalties paid per copy sold or per stream. In practice, variable cost per unit can fall at high output because suppliers give discounts for large orders; the simple model assumes it stays constant.
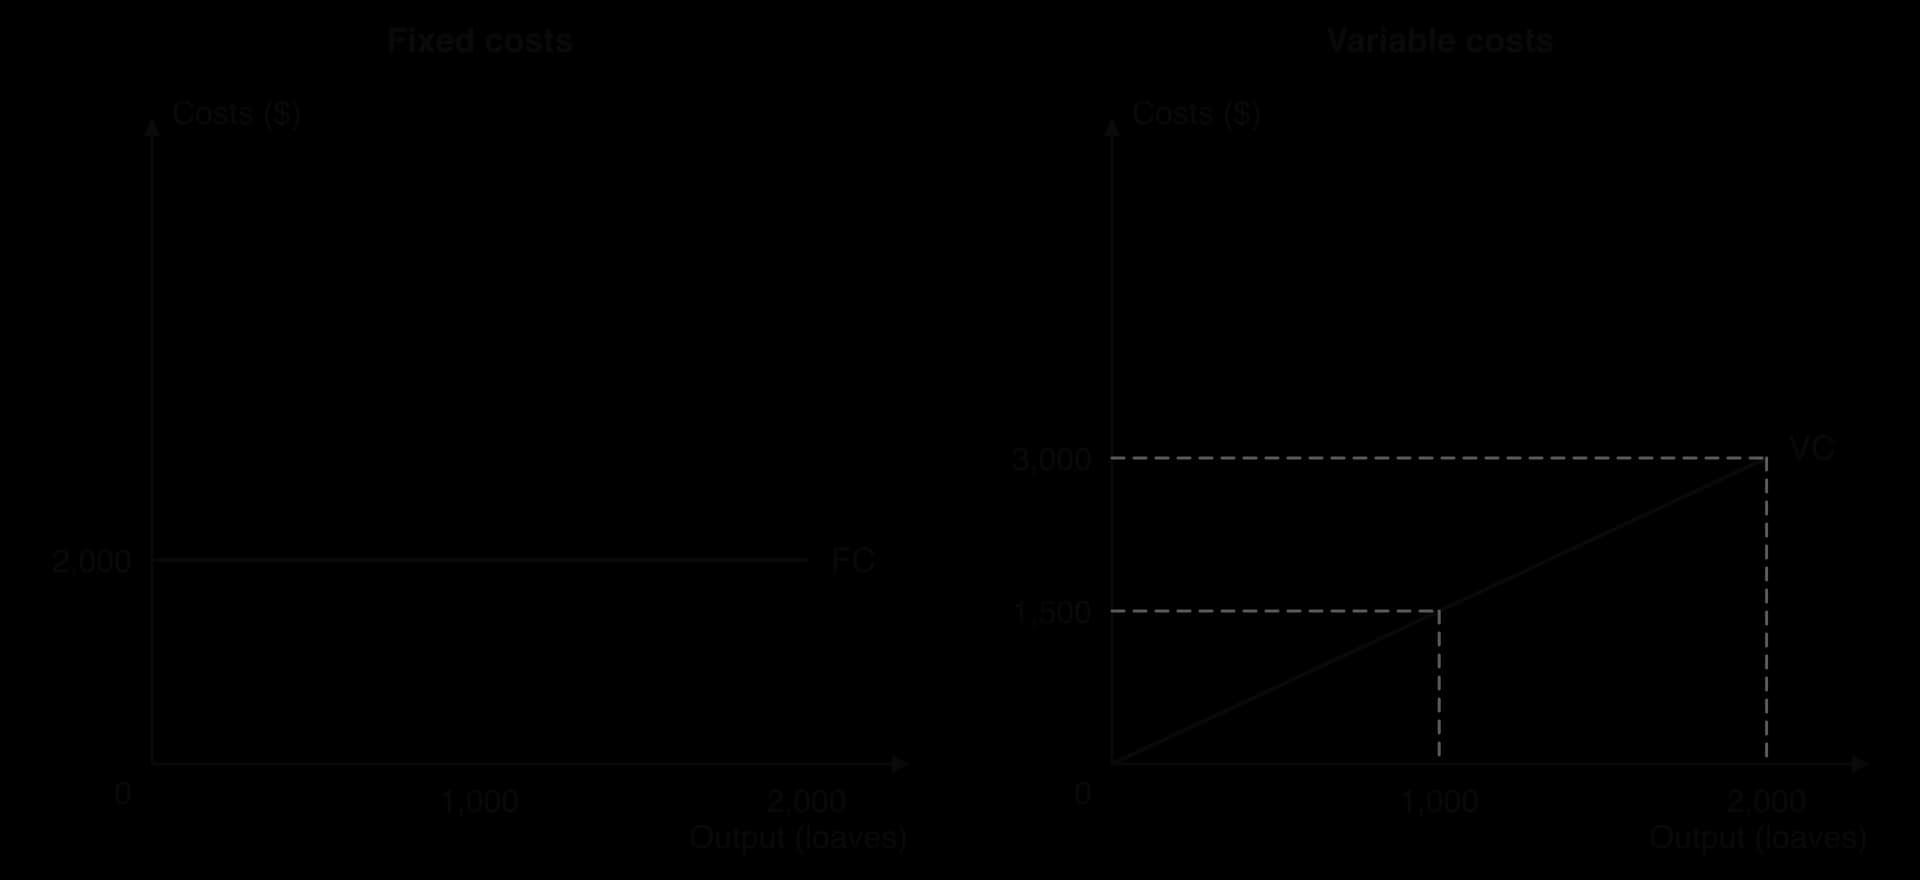
The two panels use the same hypothetical bakery, with fixed costs of $2,000 a month and a variable cost of $1.50 per loaf. The fixed cost line is flat at $2,000 at every output. The variable cost line starts at zero and rises by $1,500 for every 1,000 loaves, reaching $3,000 at 2,000 loaves.
 YouTube
Some costs have both a fixed part and a variable part. These are semi-variable costs. An electricity bill often has a fixed standing charge each month plus a charge for each unit of energy used. A salesperson may earn a fixed basic salary plus a commission on each sale. A delivery van has fixed costs (insurance, road tax) and variable costs (fuel, tyres) that rise with the distance driven.
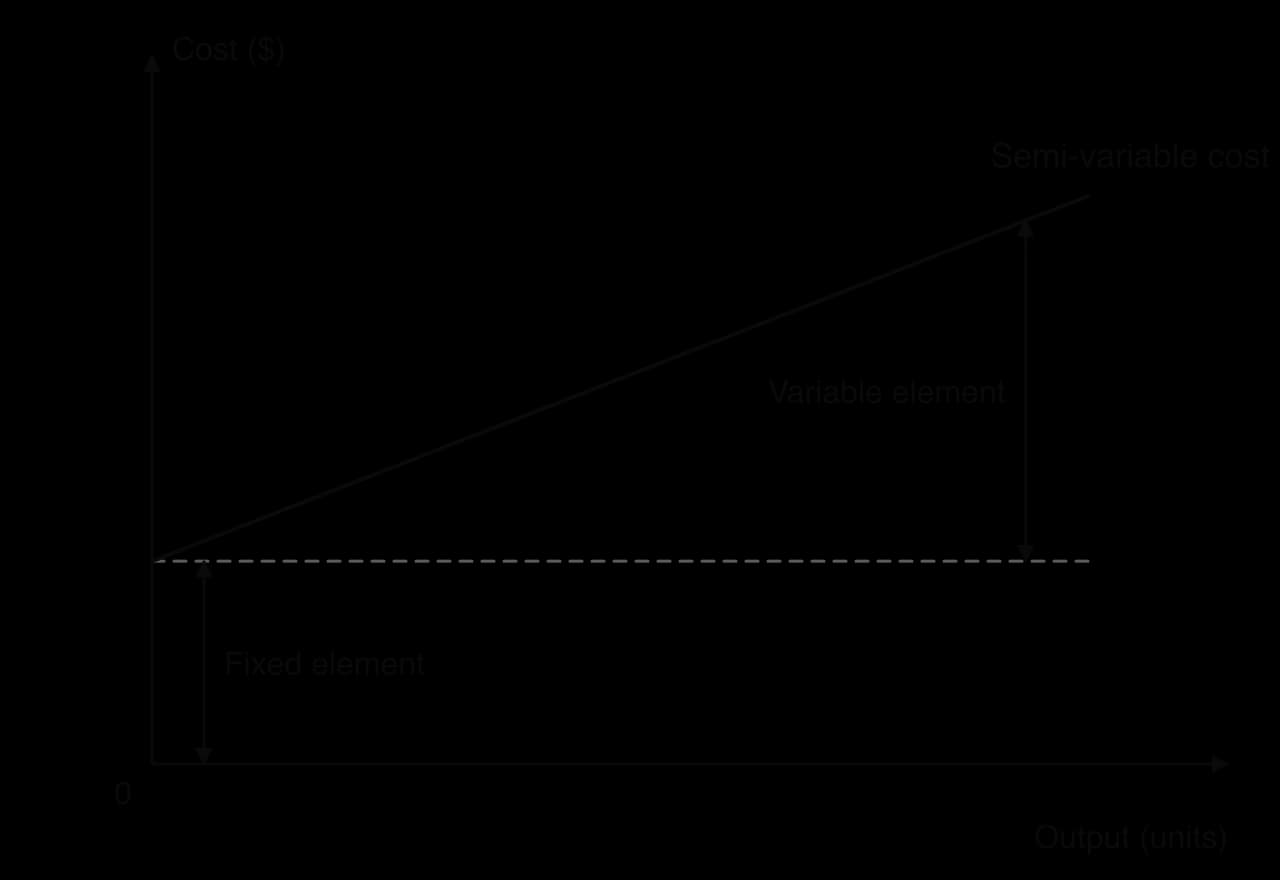
On a graph, a semi-variable cost starts on the cost axis at the level of its fixed element and rises from there. To use semi-variable costs in calculations, managers split them into their fixed and variable parts and add each part to the fixed or variable totals.
Total cost (TC) is the sum of all the costs of producing a given level of output: total fixed cost plus total variable cost. At zero output, total cost equals fixed cost; as output rises, total cost rises by the variable cost of each extra unit.
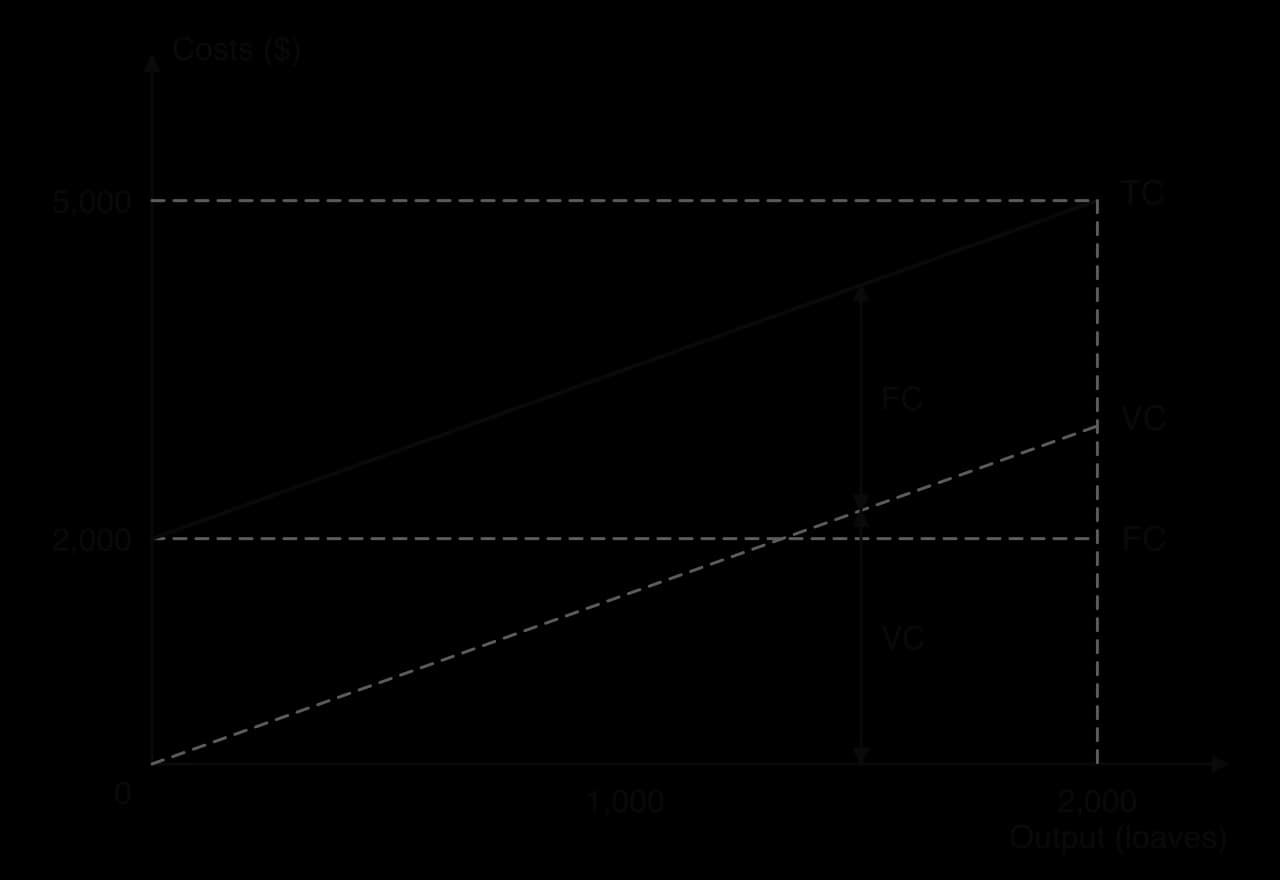
The graph shows how the three lines are related. The TC line starts at $2,000 on the cost axis, because the bakery pays its fixed costs even at zero output, and it has the same slope as the VC line, because each extra loaf adds $1.50 to both. At 2,000 loaves, total cost is $2,000 + $3,000 = $5,000.
Average cost is the total cost divided by the number of units produced. It is also called unit cost or cost per unit, and it tells a business how much each unit costs to make on average, which is essential for setting a price that covers costs.
Average cost usually falls as output rises, because the fixed costs are spread over more units. At 200 loaves, the bakery's $2,000 of fixed costs adds $10 to each loaf; at 2,000 loaves it adds only $1. The variable cost per loaf stays at $1.50, so average cost falls towards $1.50 but never reaches it.
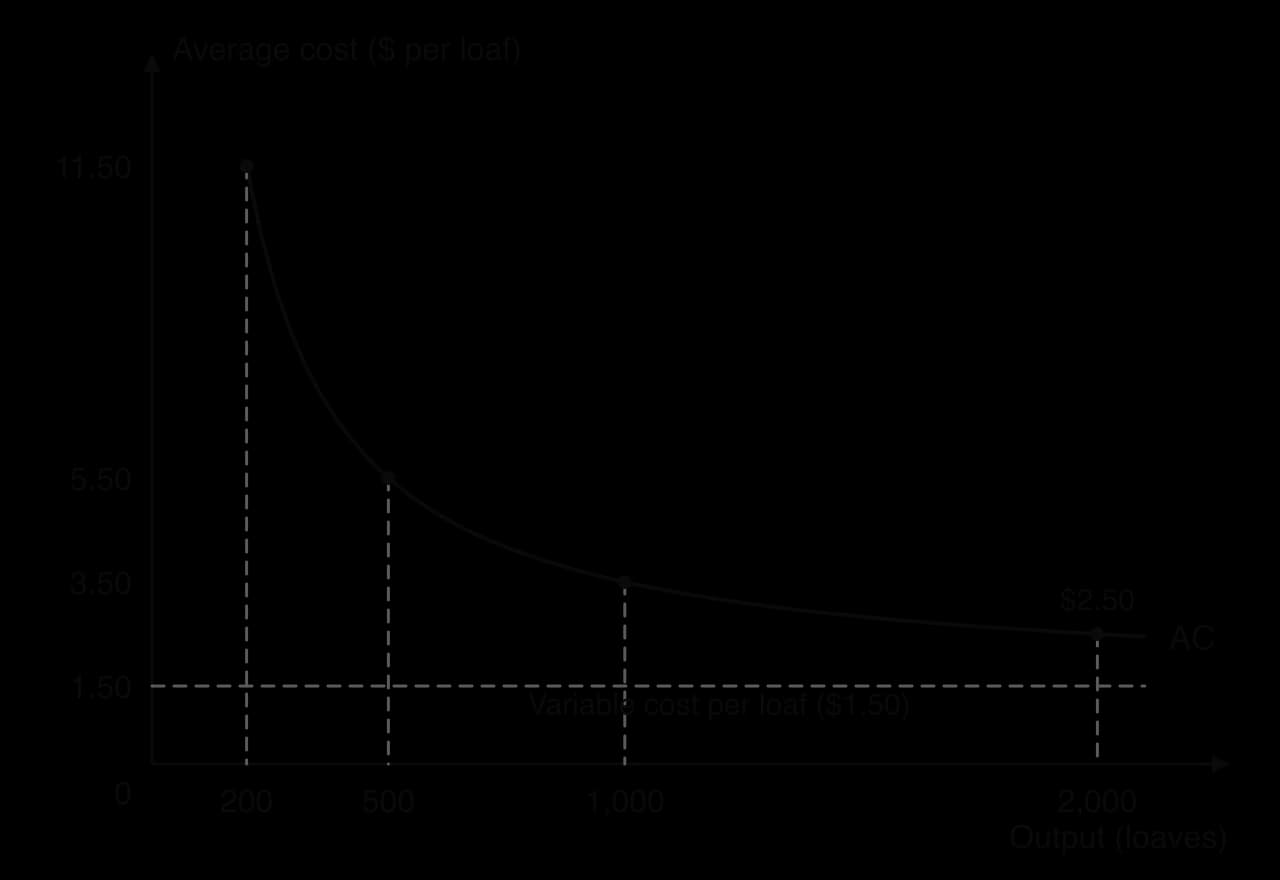
The curve shows why high fixed-cost businesses want to produce at high volumes: the more they produce, the lower their cost per unit, and the lower the price they can charge while still covering costs. Over a larger change in scale, such as building a second bakery, average cost can also fall through economies of scale, or rise through diseconomies of scale.
The second classification asks whether a cost can be traced to a particular product, service or department. Direct costs can be linked clearly to one product: the wood used in a table, the wages of a worker who only makes tables, or the packaging for a phone. If the business stopped making that product, the direct costs would disappear.
Indirect costs, also called overheads, are costs that are shared by the whole business or by several products, so they cannot be linked to any one of them. Examples are head office rent, the salaries of the managing director and the accounts department, insurance for the whole site, corporate advertising and the cost of the company website. These costs remain even if one product is dropped.
A furniture maker that produces tables, chairs and wardrobes illustrates the difference. The timber, fittings and hours of the workers on each product line are direct costs of that product. The rent of the factory, the electricity to light it, the salaries of the office staff and the delivery manager are indirect costs, because they support all three products. To find the full cost of a table, the business must add a share of these overheads to the table's direct costs, and there is no single correct way to divide them up.
Fixed or variable describes how a cost behaves as output changes; direct or indirect describes whether it can be traced to a product. Each cost has a place in both classifications.
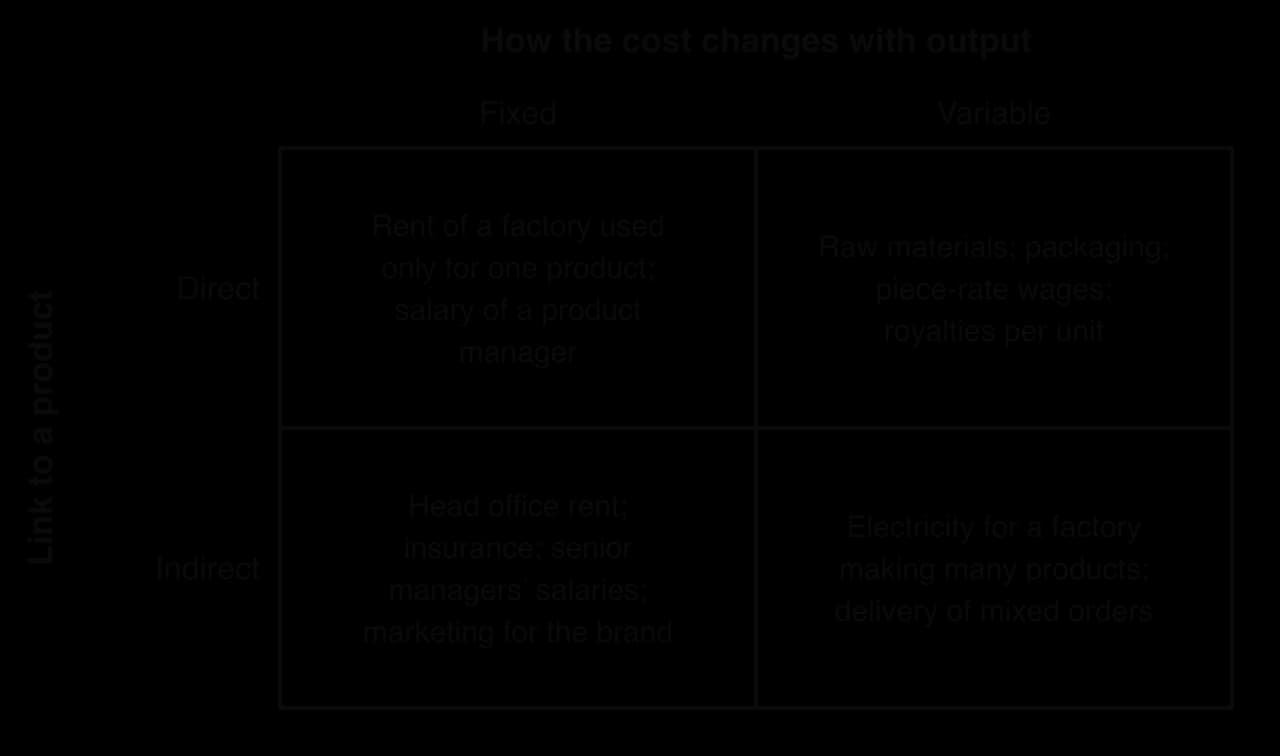
The matrix shows that "direct" does not mean "variable", and "indirect" does not mean "fixed". The salary of a manager who looks after only one product is fixed (it does not change with output) but direct (it belongs to that product). Electricity for a factory making many products varies with the hours the machines run, but it is indirect, because it is shared by all the products made there.
The same type of cost can be classified differently in different businesses, or in the same business over different periods, because what matters is how the cost actually behaves.
Labour. Drivers on a fixed monthly salary are a fixed cost for a delivery firm. Drivers paid for each delivery, as on many gig economy platforms, are a variable cost.
Energy. For a steelworks, energy for the furnaces is a large variable and direct cost; for a law firm, electricity for the office is a small indirect cost.
Size and range of products. In a business making one product, almost every cost is a direct cost of that product. In a business making hundreds of products, many of the same costs are shared overheads.
The time period. In the short run, rent and salaries are fixed. Over a longer period, a business can move to smaller premises or reduce its staff, so in the long run all costs can vary.
Some businesses change their cost structure deliberately. Leasing equipment, outsourcing and paying staff by results turn fixed costs into variable ones, which lowers the risk of losses when sales fall. The cost is usually a higher variable cost per unit when sales are strong.
Revenue is the money a business receives from its activities, mainly from selling goods and services. Total revenue (TR), also called sales revenue, is the price of a product multiplied by the quantity sold. A bakery that sells 1,800 loaves at $4 each has total revenue of $7,200.
Average revenue (AR) is total revenue divided by the quantity sold, which is the average price received for each unit. When every unit is sold at the same price, average revenue equals the price. When a business sells at different prices, for example with discounts for large orders or lower prices for students, average revenue shows the price it receives on average.
Revenue is not the same as profit. Profit is what is left from revenue after all costs have been paid. If total costs are greater than total revenue, the business makes a loss.
The difference between the price and the variable cost per unit is called contribution per unit. It is the starting point of break-even analysis, which uses fixed costs, variable costs and revenue to find the output a business must sell to cover all its costs.
The graph plots the bakery's total revenue and total cost. TR starts at zero and rises by $4 for each loaf; TC starts at $2,000 and rises by $1.50 a loaf. Where TR is above TC the bakery makes a profit, and where TC is above TR it makes a loss.
A revenue stream is a source of revenue for a business. Many businesses earn revenue from several streams, which can make their income larger and more stable. When one stream falls, others may hold up.
Revenue stream | How it works | Example |
|---|---|---|
Sales of goods and services | Customers pay a price for each product or service | A bakery selling bread; a hairdresser charging for a haircut |
Subscriptions | Customers pay a regular fee for continuing access | Music and video streaming; gym membership; software |
Advertising | Other businesses pay to show advertisements to the firm's users or audience | Free apps, websites, newspapers, television channels |
Licensing and royalties | Others pay for the right to use the firm's brand, design, patent or content | A cartoon character on children's clothing; a technology patent |
Commission | A fee as a percentage of each sale arranged for someone else | Estate agents; travel agents; online marketplaces |
Renting and leasing | Others pay to use the firm's assets for a period | Car rental; renting out spare office space |
Donations | Gifts from individuals or organisations, usually to non-profits | Charities and NGOs |
Interest and dividends | Income from the firm's savings and investments | Interest on cash in the bank; dividends from shares held |
Sale of assets | One-off income from selling assets no longer needed | Selling old vehicles or unused land |
Government grants and subsidies | Payments from the government for a purpose | Grants for research; subsidies for public transport |
Some of these streams are regular and some are one-off. Sales, subscriptions, advertising, licensing and commission recur as long as the business keeps trading; the sale of assets happens only once. Managers judging a business's future revenue focus on the recurring streams.
Football clubs show how one business can earn from several streams at once. In the year to 30 June 2026, Manchester United plc earned £677.6 million: £206.8 million from broadcasting rights, £160.5 million from sponsorship, £156.8 million from retail, merchandising, apparel and product licensing, and £153.5 million on matchdays from tickets and food.
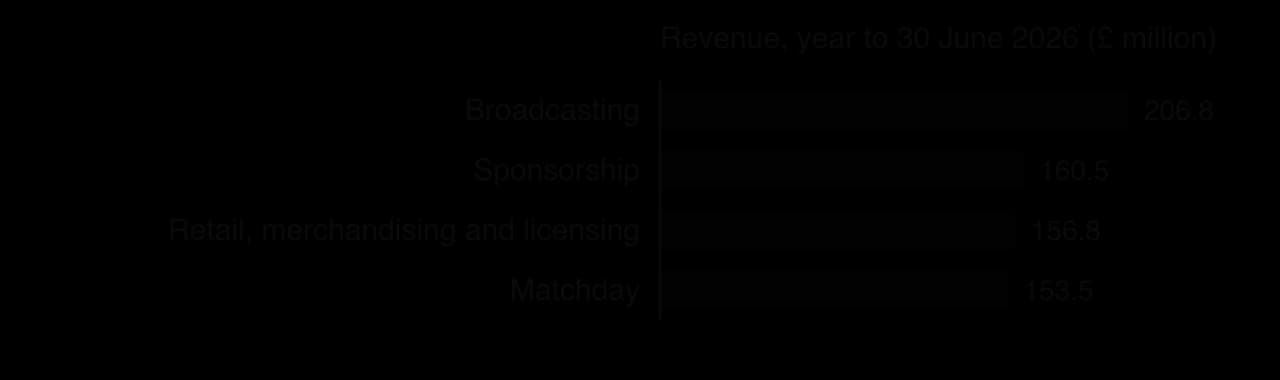
Each stream depends on different things. Broadcasting revenue depends on television contracts and on performance in competitions; sponsorship depends on contracts with a limited number of companies; matchday revenue depends on the size of the stadium and ticket prices. In the 2026 financial year, the club's sponsorship revenue fell by £27.9 million while its broadcasting revenue rose, showing how several streams can protect total revenue.
Sources: Manchester United plc, Annual Report on Form 20-F for the year ended 30 June 2026.
Several revenue streams spread risk and make better use of the business's assets and customers: a gym that already has members can sell them training and food. Recurring streams such as subscriptions also make revenue easier to forecast. However, each new stream brings its own costs and management time, and a stream that does not fit the brand can damage it, for example advertising that annoys paying customers. Whether more streams are worthwhile depends on how closely they fit the business's customers and image, the costs of running them, and how much they reduce the risk of depending on one source.
Spotify, founded in 2006, is the world's largest audio streaming subscription service. At the end of 2025 it had 751 million monthly active users in 184 countries and territories, of whom 290 million were Premium subscribers who pay a monthly fee and 476 million used the free, ad-supported service. Spotify's business is a clear example of two linked revenue streams and a cost structure dominated by variable costs.
Spotify has two revenue streams, which it reports as two segments. Premium revenue comes from subscriptions, which give users music without advertisements and extra features. Ad-Supported revenue comes from advertisers who pay to place audio, video and display advertisements in front of free users. The free service has a second purpose: it attracts users who may later upgrade to Premium.

The chart shows that Premium revenue rose by 81% between 2021 and 2025, from €8,460 million to €15,350 million, and in 2025 made up 89.3% of total revenue. Ad-Supported revenue was €1,836 million in 2025, slightly lower than in 2024, even though the number of free users rose. Spotify therefore depends mainly on subscriptions, a recurring stream that is relatively easy to forecast.
Spotify's largest cost is its cost of revenue, which consists mainly of royalties and the costs of distributing content. Royalties are paid to record labels, music publishers and other rights holders, and are calculated mainly from the revenue Spotify earns and from how much its users listen. They are therefore largely variable and direct costs: when Spotify earns more revenue, it pays more royalties. In 2025 cost of revenue was €11,690 million, 68% of revenue, and Spotify reported paying more than US$11 billion to the music industry in the year.
Spotify, € million | 2021 | 2022 | 2023 | 2024 | 2025 |
|---|---|---|---|---|---|
Premium revenue | 8,460 | 10,251 | 11,566 | 13,819 | 15,350 |
Ad-Supported revenue | 1,208 | 1,476 | 1,681 | 1,854 | 1,836 |
Total revenue | 9,668 | 11,727 | 13,247 | 15,673 | 17,186 |
Gross profit | 2,591 | 2,926 | 3,397 | 4,724 | 5,496 |
Gross margin | 26.8% | 25.0% | 25.6% | 30.1% | 32.0% |
Operating income | 94 | (659) | (446) | 1,365 | 2,198 |
The table shows the effect on profit. Because most of each euro of revenue is paid out again as royalties, Spotify's gross margin is low compared with many technology firms, and growth in revenue does not automatically bring large profits. Its fixed costs, including research and development (€1,393 million in 2025), sales and marketing (€1,426 million) and administration (€479 million), had to be covered by the gross profit left after royalties. After operating losses in 2022 and 2023, operating income was €1,365 million in 2024 and €2,198 million in 2025, as gross profit rose faster than these largely fixed operating costs, which fell slightly.
Royalties are not perfectly variable. Spotify reported minimum guaranteed royalty payments of €2,613 million due under its licence agreements at the end of 2025, which must be paid whatever its revenue, so part of its content cost behaves like a fixed cost. Between 2024 and 2025 revenue rose by 9.7% while cost of revenue rose by 6.8%, which helped the gross margin rise from 30.1% to 32.0%.
The case has limits as evidence. The figures are Spotify's own, in euros, and currency movements affected them: Spotify reported that exchange rates reduced its revenue growth in late 2025. Segment revenue shows where income comes from, but not the profit of each segment after all overheads, which would require dividing indirect costs between Premium and Ad-Supported.
Explain why Spotify's royalty payments are mainly variable costs, and why part of them behaves like a fixed cost.
Analyse why Spotify's operating income rose faster than its revenue between 2024 and 2025.
Explain one advantage and one disadvantage for Spotify of offering a free, ad-supported service alongside Premium.
Sources: Spotify Technology S.A., Q4 2025 shareholder deck (Form 6-K, 10 February 2026) and Annual Report on Form 20-F for 2025.
Calculation questions on costs and revenue are often followed by a short comment on the result.
Fixed costs do not change with output in the short run; variable costs change in proportion to output; semi-variable costs have a fixed and a variable element.
Total cost = total fixed cost + total variable cost; on a graph, TC starts at FC and runs parallel to VC.
Average cost = total cost ÷ output; it falls as output rises because fixed costs are spread over more units.
Direct costs can be traced to one product; indirect costs (overheads) are shared by the whole business.
Fixed/variable and direct/indirect are separate classifications, and how a cost is classified depends on the business and the time period.
Total revenue = price × quantity; average revenue = total revenue ÷ quantity; profit = total revenue − total cost.
Businesses earn revenue from several streams (sales, subscriptions, advertising, licensing, commission, renting and others), which can spread risk.
I can define fixed, variable, semi-variable, direct and indirect costs, with examples.
I can draw and explain graphs of fixed, variable and total cost.
I can distinguish direct from indirect costs and explain that this is a separate classification from fixed and variable.
I can explain why the classification of a cost depends on the business and the time period.
I can calculate total cost, average cost, total revenue, average revenue and profit.
I can explain the main revenue streams of businesses with real examples.
I can analyse how a business's costs and revenue streams affect its profit, using a case.
20 million: £5 200 000 ÷ 20 000 000 = £0.26 per brick
50 million: £12 500 000 ÷ 50 000 000 = £0.25 per brick
Award [1] for each correct answer with working. Award a maximum of [1] if the £ sign is missing in both answers. Accept answers in pence (26p and 25p).
State the level of output at which Hollis’s average cost is lowest.
1 mark
40 million bricks (average cost £0.23 per brick).
Award [1] for the correct output. Accept OFR from (a).
With reference to Hollis, explain two internal economies of scale that could explain the fall in average cost as output rises from 10 million to 40 million bricks.
4 marks
Possible answers include:
Technical economies: larger kilns and automated cutting machines produce far more bricks per worker and per unit of energy; their high fixed cost is spread over more bricks. Kilns running 24 hours a day are used at full capacity.
Purchasing economies: buying clay, fuel and packaging in larger quantities gives Hollis bulk discounts.
Financial economies: as a large plc with substantial assets, Hollis can raise finance more cheaply to fund its three expansions.
Managerial economies: a larger firm can employ specialist managers (engineering, logistics, sales) whose cost per brick falls as output grows.
Mark as 2 + 2. For each: award [1] for identifying a relevant internal economy of scale and [1] for explaining how it lowers the average cost per brick at Hollis.
Award a maximum of [2] for answers with no application to Hollis.
Using Table 1 and the information in paragraph 2, explain why Hollis’s average cost rises if output increases to 50 million bricks.
3 marks
Average cost rises from £0.23 to £0.25 per brick (about 8.70 %): Hollis would be experiencing diseconomies of scale.
Older back-up kilns are less efficient (more fuel and more breakages per brick).
Agency night staff are usually more expensive per hour and less experienced, so productivity falls.
A fourth layer of supervisors adds overhead costs and slows communication and coordination (managerial diseconomies).
Award [1] for recognising that average cost rises (diseconomies of scale), using the data.
Award [1] for each relevant reason explained in the context of paragraph 2, up to [2].
Accept OFR from (a).
Pinewood Print is a commercial printer in Halifax, Canada. It prints product catalogues for retailers. For an order of 20 000 catalogues on its existing press, the fixed costs of setting up the job are CAD 18 000 and the variable cost is CAD 0.60 per catalogue.
Pinewood Print has bought a large high-speed press. For a new order of 60 000 catalogues on the new press, the fixed costs of the job are CAD 30 000 and the variable cost falls to CAD 0.45 per catalogue because the press wastes less paper and ink.
Calculate the average cost per catalogue for each order (show all your working).
3 marks
Explain how a technical economy of scale helps to explain the difference in average cost between the two orders.
2 marks
Marco Ferri plans to open a Gelateria Nuvola franchise in Verona, Italy. Gelateria Nuvola, the franchisor, has 140 outlets. It charges each new franchisee an initial fee of €40 000, a royalty of 6 % of sales revenue and a marketing levy of 2 % of sales revenue. Franchisees must buy their gelato base from Gelateria Nuvola. Marco forecasts sales revenue of €350 000 in his first year.
Calculate the total amount Marco will pay Gelateria Nuvola in fees, royalties and levies in his first year (show all your working).
2 marks
Explain one advantage and one disadvantage for Marco of opening a Gelateria Nuvola franchise rather than his own independent gelateria.
4 marks