Explain who uses final accounts and why, prepare a statement of profit or loss and a statement of financial position in the IB layouts, explain intangible assets and (HL) calculate and evaluate depreciation.
Each is in the Business glossary, with every other term in the subject.
The rule that a business's assets always equal its liabilities plus equity, so that total assets minus total liabilities equals equity.
The total depreciation charged on a non-current asset since it was bought, deducted from its original cost in the statement of financial position to give its net book value.
The spreading of the cost of an intangible asset with a limited life, such as a patent or licence, over that life; the intangible equivalent of depreciation.
Resources owned or controlled by a business that have value and will bring future benefits, such as buildings, machinery, stock, debtors and cash.
An independent examination of a business's final accounts by qualified accountants (auditors), who give an opinion on whether the accounts present a true and fair view.
The money a business holds in notes and coins and in its bank accounts at a given date; the most liquid current asset.
A legal right that protects the owner of an original creative work, such as writing, music, film, software or art, from having it copied or used without permission for a set period.
The direct cost of producing or buying the goods a business sold during an accounting period, calculated as opening stock plus purchases minus closing stock.
Explain the purpose of final accounts for different internal and external stakeholders.
Explain the principles of ethical accounting, and how creative accounting and window dressing can mislead users of accounts.
Prepare a statement of profit or loss for a profit-making entity and for a non-profit entity from given data.
Prepare a statement of financial position, and complete one with missing figures, using the accounting equation.
Explain how the statement of profit or loss and the statement of financial position are linked.
Explain the different types of intangible assets and why they are difficult to value.
Calculate depreciation using the straight-line method and the units of production method, and prepare a depreciation schedule (HL).
Evaluate the appropriateness of each depreciation method for a given asset (HL).
Every business needs a record of how well it has performed and of what it owns and owes. Final accounts provide that record in a standard form, so that owners, managers, lenders, the government and other stakeholders can judge the business and compare it with others. They are the starting point for almost all financial analysis, including ratio analysis and investment decisions.
Final accounts are only useful if they are honest. The collapse of the German payments company Wirecard in 2020, after it admitted that €1.9 billion of cash in its accounts probably did not exist, shows how much depends on the accuracy of these statements and on the ethics of the people who prepare them.
70 exam-style questions on this subtopic, written in the style of the IB papers. The first has its markscheme open. Counted on
Sentul Precision Engineering Sdn Bhd makes metal components for medical devices in Kuala Lumpur, Malaysia. Table 1 shows an extract from its statement of financial position.
Table 1: Extract from the statement of financial position of Sentul Precision Engineering as at 31 December 2025 (RM000)
RM000 | |
|---|---|
Current liabilities | |
Bank overdraft | 600 |
Trade creditors | 900 |
Non-current liabilities | |
Borrowings—long term | 4 200 |
Equity | |
Share capital | 3 000 |
Retained earnings | 2 800 |
Using Table 1, calculate Sentul Precision Engineering’s gearing ratio (show all your working).
3 marks
The official deck for this part of the syllabus.
Define final accounts.
State the two main final accounts and what each one shows.
With a free account, Augment remembers where you stopped and what you have practiced.
The use of accounting methods, estimates and judgments that may be legal but are chosen to make a business's financial performance or position look better than it really is.
Suppliers and other organisations to which a business owes money for goods or services bought on credit; trade creditors are shown as a current liability.
Assets a business expects to turn into cash or use up within one year, mainly cash, debtors and stock.
Debts a business must pay within one year, such as bank overdrafts, trade creditors and short-term loans.
Customers who have bought goods or services on credit and still owe the business money; shown as a current asset in the statement of financial position.
The fall in the value of a non-current asset over its useful life because of wear and tear, obsolescence or the passage of time, recorded as an expense in the accounts.
The owners' stake in a business, made up of the capital they have put in (share capital for a company) and the profits kept in the business (retained earnings); equal to net assets.
The indirect costs of running a business over an accounting period, such as salaries, rent, marketing, insurance and depreciation, deducted from gross profit in the statement of profit or loss.
The financial statements a business prepares at the end of an accounting period, mainly the statement of profit or loss and the statement of financial position, to show its performance and financial position.
An intangible asset that arises when one business buys another for more than the fair value of its net assets; the excess paid for reputation, customers, staff and brands.
The profit a business makes from trading before its expenses are deducted, calculated as sales revenue minus cost of sales.
Non-current assets that have no physical form but bring a business value, such as patents, copyrights, trademarks, licences, brands and goodwill.
The debts a business owes to people and organisations outside it, such as suppliers, banks and other lenders, which must be paid in the future.
Loans a business must repay after more than one year, such as long-term bank loans, mortgages and debentures, shown under non-current liabilities.
The value of a business's total assets minus its total liabilities; it always equals total equity.
The value of a non-current asset in the accounts at a given date, calculated as its original cost minus the accumulated depreciation charged so far.
Assets a business expects to keep and use for more than one year, such as land, buildings, machinery, vehicles and intangible assets.
Debts a business does not have to repay within the next year, such as long-term bank loans, mortgages and debentures.
The loss of value of an asset because it has become out of date, for example when newer technology replaces it, even though it may still work.
A legal right granted by a government that gives the owner of an invention the exclusive right to make, use and sell it for a limited period, usually up to 20 years.
The profit a business makes from its operations, calculated as gross profit minus expenses, before interest on borrowing and tax are deducted.
The profit left after interest on a business's borrowing has been deducted from profit before interest and tax, and before tax on profits is paid.
The profit left for the owners after interest and tax have been deducted, calculated as profit before tax minus tax; it is either paid out as dividends or kept as retained profit.
The tangible non-current assets a business uses in its operations, such as land, buildings, machinery, vehicles and computers, shown at cost in the statement of financial position.
The amount a business expects to receive for a non-current asset when it sells or scraps it at the end of its useful life.
The total of all the profits a business has kept since it started, after tax and dividends, shown as part of equity in the statement of financial position.
The value of the goods and services a business sells during an accounting period, calculated as the price of each item multiplied by the quantity sold; the first line of the statement of profit or loss.
Loans and other borrowing a business must repay within one year, shown as other short-term loans under current liabilities in the statement of financial position.
A financial statement that shows what a business owns (assets), what it owes (liabilities) and the owners' equity at one particular date, usually the last day of the accounting period.
A financial statement that shows a business's sales revenue, costs and profit or loss over an accounting period, usually one year, and how the profit is divided between tax, dividends and retained profit.
The raw materials, work in progress and finished goods a business holds for production or sale; shown as a current asset and also called inventory.
A method of depreciation that charges the same amount each year, calculated as the cost of the asset minus its residual value, divided by its useful life in years.
Assets that have a physical form, such as land, buildings, machinery, vehicles and stock, as opposed to intangible assets.
A compulsory payment to the government; in the statement of profit or loss, the tax a company pays on its profits, deducted from profit before tax.
The value of everything a business owns at a given date, calculated as non-current assets plus current assets.
A registered sign, such as a name, logo, symbol or slogan, that distinguishes one business's goods or services from those of others and cannot legally be used by competitors.
A method of depreciation that charges each year according to how much the asset is used, calculated from cost minus residual value divided by the total expected units, times the units in the year.
The period over which a business expects to use a non-current asset, measured in years or in units of output, before it is sold or scrapped.
A form of creative accounting in which a business makes its final accounts look more attractive just before the reporting date, for example by delaying payments or temporarily selling assets.
Scope: SL and HL both study the purpose of accounts for different stakeholders, ethical accounting, the statement of profit or loss and the statement of financial position (for profit-making and non-profit entities) and the different types of intangible assets. HL also calculates depreciation by the straight-line and units of production methods and evaluates which method suits a given asset.
A business records every transaction during the year: each sale, each purchase, each wage payment, each loan. At the end of an accounting period, usually twelve months, these records are summarised into a small number of financial statements. Together these statements are the final accounts.
The two statements answer different questions. The statement of profit or loss shows how much profit or loss the business made over the period. The statement of financial position shows what the business owns and owes at the end of the period. Larger businesses also publish a statement of cash flows, which records the actual movement of cash; the difference between profit and cash flow is a separate topic in finance.
Both statements have other names that appear in textbooks, company reports and the business press. The statement of profit or loss is also called the profit and loss account or the income statement; the statement of financial position is also called the balance sheet. Each name describes the same statement; statement of profit or loss and statement of financial position are the names the IB uses.
Companies are legally required in most countries to prepare final accounts, and a publicly held company must publish them for anyone to read. The accounts of most companies are checked by an audit: independent accountants examine the records and give an opinion on whether the statements give a "true and fair view" of the business. A sole trader usually prepares accounts only for the tax authorities and for any bank that lends to the business.
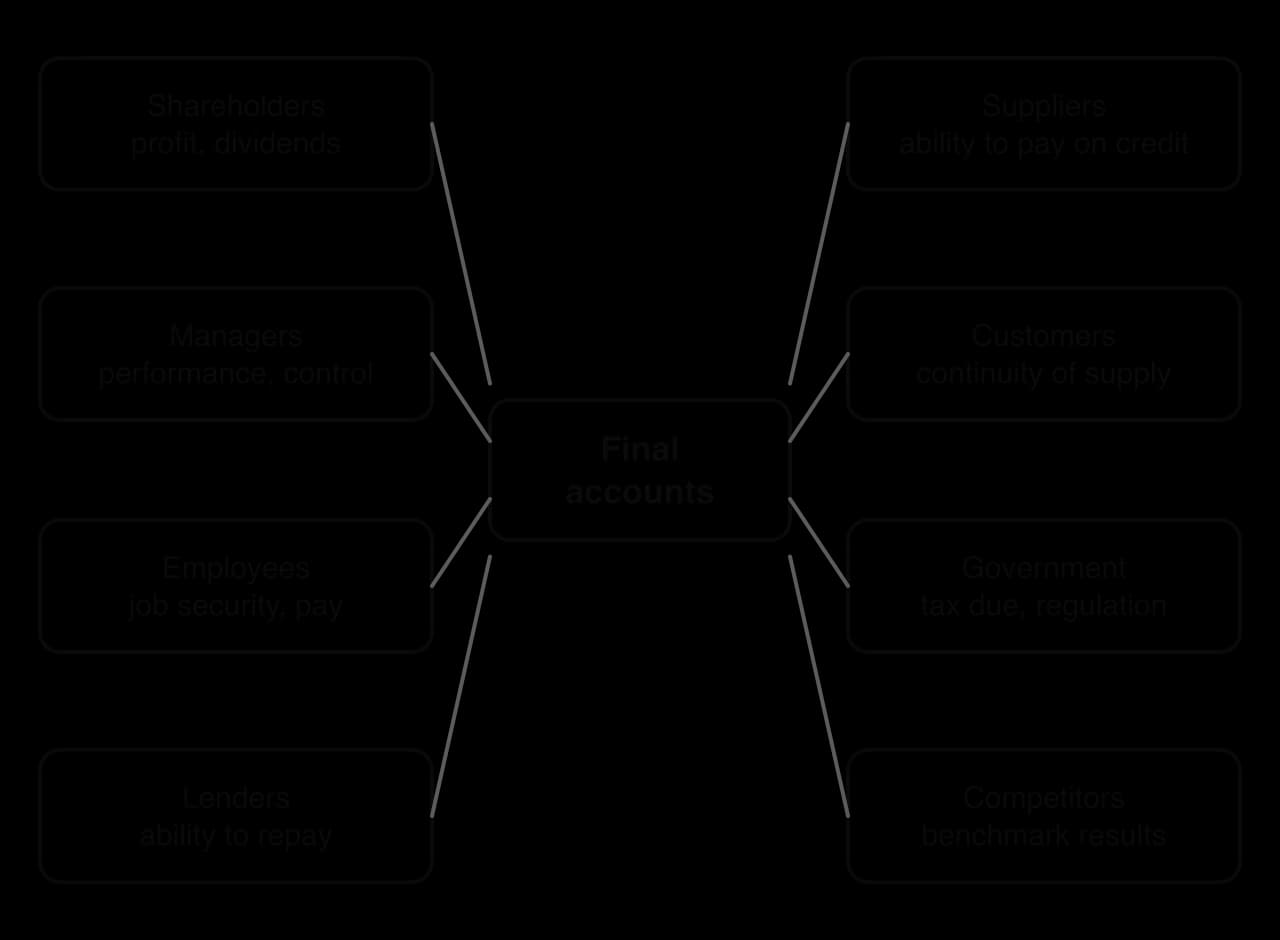
Final accounts are produced for the people who have an interest in the business, its stakeholders. Each stakeholder group reads the accounts with a different question in mind. Managers inside the business use them to plan and control; outsiders use them to decide whether to invest in, lend to, trade with or work for the business.
The diagram groups the main users of final accounts. The table sets out what each group wants to know and which figures it looks at most closely.
Stakeholder | Purpose of reading the accounts | Figures of most interest |
|---|---|---|
Shareholders and potential investors | To judge whether the business is profitable and growing, whether to buy, hold or sell shares, and whether the directors are running it well. | Profit for period, dividends, retained earnings, growth in sales revenue |
Managers and directors | To measure performance against objectives and budgets, to plan, to control costs and to make decisions such as expansion or closure. | Every line, compared with previous years and with targets |
Employees and trade unions | To judge job security and whether the business can afford higher pay or bonuses. | Profit, cash, the trend in profit over several years |
Lenders (banks, bondholders) | To decide whether to lend, how much, at what interest rate and with what security. | Profit before interest and tax, cash, liabilities, assets that could be used as security |
Suppliers | To decide whether to sell on credit and on what terms. | Cash, current assets, current liabilities |
Customers | To check that the business will survive to supply goods, spare parts, servicing and guarantees. | Profit trend, cash, debts |
Government and tax authorities | To calculate the tax due and check that the business follows the law. | Profit before tax, tax |
Competitors | To compare their own performance with a rival's and to spot its strengths and weaknesses. | Sales revenue, gross profit, profit for period |
Local community and pressure groups | To judge whether the business is likely to grow, cut jobs or invest locally, and whether it could afford to behave more responsibly. | Profit, investment in non-current assets |
Internal users have an advantage over external users. Managers see detailed internal reports every month, while outsiders see only the published accounts, often months after the year has ended. External users therefore depend heavily on the honesty of the published figures and on the work of the auditors.
The interests of these groups can conflict. A high profit pleases shareholders but may lead employees to demand higher wages, and a business may want to show a low profit to the tax authorities but a high profit to lenders and investors. These pressures are one reason why rules for preparing accounts, and the ethics of the accountants who follow them, matter so much.
Accounting involves many judgments: how long a machine will last, whether a customer will pay, how much a brand is worth. Because of this, two honest accountants can produce slightly different figures from the same records. Ethical accounting means making these judgments honestly and in a way that gives users a fair picture, not the picture the owners or managers would prefer.
Professional accounting bodies set out principles for accountants and auditors. The most important are:
Integrity: being honest and straightforward in all financial reporting; never knowingly presenting false or misleading figures.
Objectivity: not allowing bias, conflicts of interest or pressure from managers or owners to influence judgments.
Transparency: disclosing the information users need, including the accounting methods used and any risks or uncertainties, so that the figures can be understood and checked.
Accuracy and completeness: recording every transaction in the correct period and leaving nothing material out.
Consistency: using the same accounting methods from year to year, so that results can be compared over time, and explaining any change.
Professional competence and confidentiality: keeping knowledge up to date, and not using or revealing information gained at work for personal gain.
Ethical accounting is a form of sustainability for the business itself. Investors, lenders and suppliers deal with a business on trust; once accounts are shown to be misleading, that trust is lost, the cost of finance rises, and the business may not survive. Honest reporting also links to corporate social responsibility, since many stakeholders rely on the accounts to make decisions that affect their savings and jobs.
Accounting rules allow some choice. A business can choose, within limits, how quickly to depreciate its machinery, when to recognise revenue on a long contract, or how to value its stock. Creative accounting uses these choices, and sometimes stretches them, to make results look better than they really are.
Common forms of creative accounting include recording sales before the goods have been delivered, choosing a longer useful life for assets so that each year's expense is lower, valuing stock or intangible assets generously, and classifying normal running costs as one-off items so that underlying profit looks higher. When the rules are broken, for example when sales or cash are invented, creative accounting becomes fraud.
Window dressing is a type of creative accounting that focuses on the reporting date. Because the statement of financial position is a snapshot of a single day, a business can make it look healthier by actions taken just before that day and reversed just after.
Typical window-dressing actions include:
Delaying payments to suppliers until after the year end, so that cash looks higher.
Offering large discounts to persuade customers to pay before the year end, or pushing extra stock onto distributors so that sales revenue rises.
Selling an asset just before the year end and buying it back afterwards, or using a sale and leaseback to raise cash.
Repaying an overdraft with a short-term loan from elsewhere on the last day, so that borrowing appears lower.
The best-known example is Lehman Brothers, the US investment bank that collapsed in September 2008. A court-appointed investigator reported in March 2010 that, at the end of several quarters, Lehman had used transactions known as "Repo 105" to move assets temporarily off its balance sheet (about $50 billion at the end of the second quarter of 2008) and buy them back days later. Its debts looked smaller than they were, and one executive described the practice in an email as "basically window-dressing".
Sources: CBS News, "Lehman cooked books before collapse, report finds", 12 March 2010, reporting the court-appointed investigator's report by Anton R. Valukas.
The statement of profit or loss shows how a business's sales revenue becomes profit over an accounting period. It starts with the money earned from sales and subtracts each type of cost in turn, showing a subtotal of profit after each stage. The last lines show how the profit is shared between the government (tax), the owners (dividends) and the business itself (retained profit).
The IB presents the statement of a profit-making company in a fixed layout. Figures being subtracted are shown in brackets, a single line is drawn before each subtotal, and the final figure is double-underlined.
ABC Ltd (profit-making entity) | $m |
|---|---|
Sales revenue | 1,500 |
Cost of sales | (500) |
Gross profit | 1,000 |
Expenses | (300) |
Profit before interest and tax | 700 |
Interest | (100) |
Profit before tax | 600 |
Tax | (200) |
Profit for period | 400 |
Dividends | (150) |
Retained profit | 250 |
Each subtotal is found by subtracting the line above it: gross profit is $1,500m − $500m = $1,000m; profit before interest and tax is $1,000m − $300m = $700m, and so on down to retained profit of $400m − $150m = $250m.
Sales revenue is the value of all the goods and services the business sold during the period, whether the customers paid in cash or on credit. A sale is recorded when the goods are delivered or the service is provided, not when the money arrives. It is calculated as the selling price of each product multiplied by the quantity sold, added up across all products.
Sales revenue is not the same as cash received. A furniture shop that sells a $2,000 sofa on 30 December, to be paid for in February, includes the $2,000 in this year's sales revenue even though no cash has arrived.
Cost of sales is the direct cost of the goods that were actually sold during the period: the materials and stock bought in, and in a manufacturer the direct labour used to make them. Goods that were bought but are still in the warehouse at the end of the year are not part of cost of sales; they are closing stock, an asset.
The formula follows the stock through the year. The business starts with its opening stock, adds what it buys, and the goods that are not left at the end must have been sold. For example, a bookshop with opening stock of $12,000 that buys $50,000 of books and has $14,000 of books left at the year end has a cost of sales of $12,000 + $50,000 − $14,000 = $48,000.
Gross profit is the profit made on trading alone, before any running costs are paid. It shows how much the business earns from buying or making its products and selling them at a higher price.
Expenses are the indirect costs of running the business during the period, also called overheads: salaries of staff not directly involved in production, rent, insurance, marketing, utilities, administration and depreciation of non-current assets. They are revenue expenditure, the day-to-day costs of operating, as opposed to capital expenditure on assets that last for years.
Subtracting expenses from gross profit gives profit before interest and tax, the profit made by the business's operations. Because it comes before interest, it allows businesses with different levels of borrowing to be compared fairly, and it is the profit figure used in the profit margin and return on capital employed ratios.
Interest is the cost of the business's borrowing during the year, such as interest on bank loans, overdrafts and debentures. It is deducted next because it is a cost of how the business is financed, not of how it operates. The result is profit before tax.
Tax in the statement of profit or loss is the tax the business must pay on its profits, called corporation tax in many countries. It is usually a percentage of profit before tax, set by the government; a business that makes a loss normally pays no profit tax for that year. What remains after tax is the profit for period, the profit that belongs to the owners.
The directors of a company decide how much of the profit for period to pay to shareholders as dividends and how much to keep. The part that is kept is retained profit, which can be reinvested in the business and is one of the most important internal sources of finance. A sole trader or partnership takes drawings instead of dividends, but the principle is the same.
A business that pays out all its profit as dividends has no retained profit to fund growth, while one that pays nothing may disappoint shareholders who rely on the income. The balance depends on the company's objectives, its need for finance and the expectations of its shareholders.
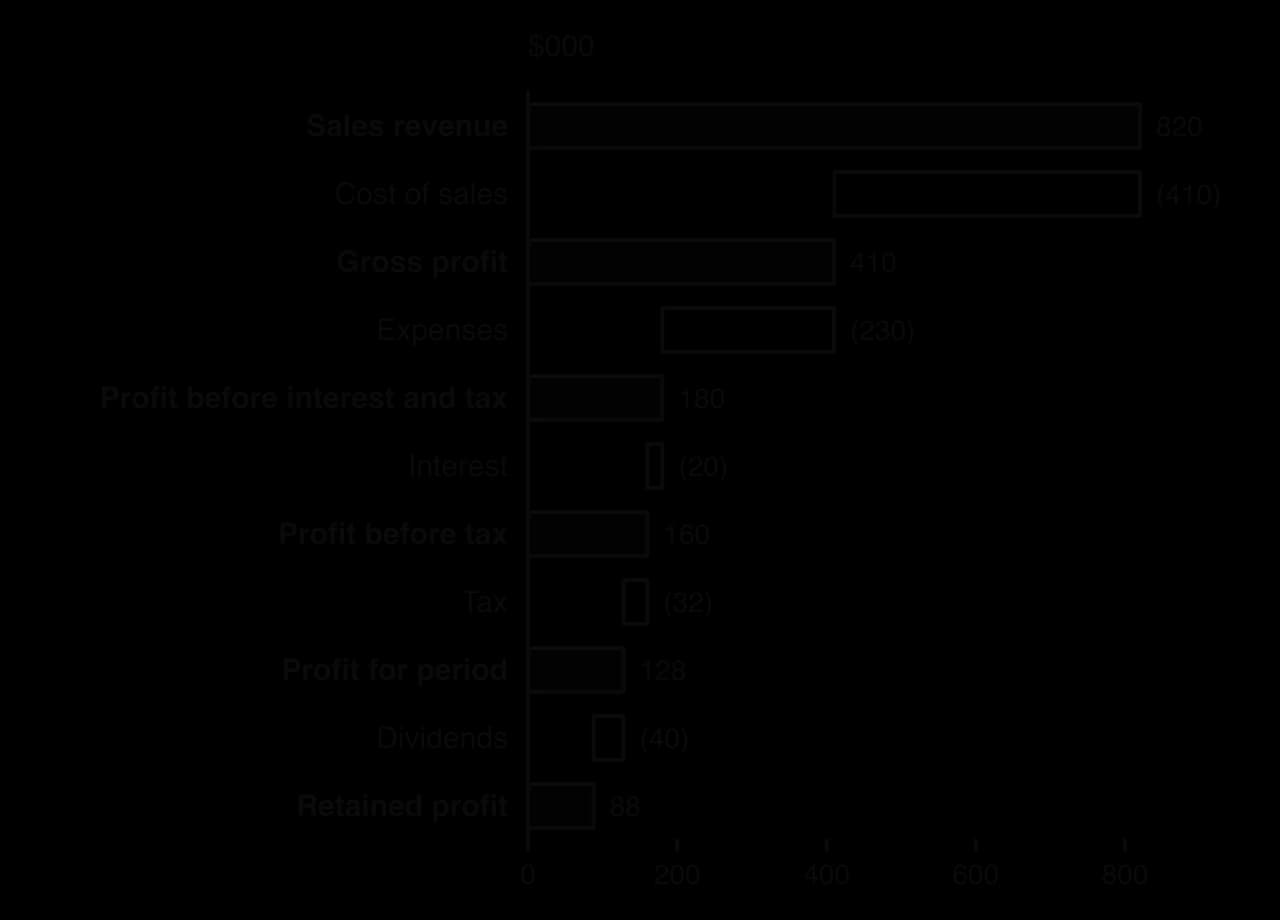
The waterfall shows the statement of profit or loss of Kaito Bikes Ltd, a hypothetical maker of electric bicycles. Reading down, each type of cost removes a slice of the revenue; the largest slices are cost of sales and expenses, so these are where cost control has the greatest effect on profit.
Preparing the statement from a list of figures takes four steps: pick out the items that belong in it (and leave out any that do not), calculate any figure that is not given directly, such as cost of sales, place each item on the correct line, and work out each subtotal in order.
The statement of financial position lists everything the business owns and everything it owes on the last day of the accounting period, and shows the value that belongs to the owners. It is built from three groups of items: assets, liabilities and equity.
The first group, assets, is everything of value that the business controls.
Assets can be tangible, with a physical form, such as buildings, machinery and stock, or intangible, such as patents and brands. They are also divided by how long the business expects to keep them: non-current assets for more than a year, current assets for less.
The IB layout of the statement of financial position for a profit-making company uses two columns: the inner column holds the individual items and the outer column holds the totals of each group.
ABC Ltd (profit-making entity) | $m | $m |
|---|---|---|
Non-current assets | ||
Property, plant and equipment | 900 | |
Accumulated depreciation | (100) | |
Non-current assets | 800 | |
Current assets | ||
Cash | 600 | |
Debtors | 400 | |
Stock | 100 | |
Current assets | 1,100 | |
Total assets | 1,900 | |
Current liabilities | ||
Bank overdraft | 200 | |
Trade creditors | 100 | |
Other short-term loans | 200 | |
Current liabilities | 500 | |
Non-current liabilities | ||
Borrowings—long term | 300 | |
Non-current liabilities | 300 | |
Total liabilities | 800 | |
Net assets | 1,100 | |
Equity | ||
Share capital | 100 | |
Retained earnings | 1,000 | |
Total equity | 1,100 |
The layout has a clear logic. It lists what the business owns (total assets $1,900m), then what it owes (total liabilities $800m). The difference is net assets ($1,100m), and the equity section shows who that value belongs to: the shareholders, through the capital they invested and the profits kept in the business. Net assets and total equity are always equal.
Non-current assets are assets the business expects to keep and use for more than a year to produce its goods and services. They are not bought to be resold. In the IB layout they are shown as property, plant and equipment (land, buildings, machinery, vehicles, computers, furniture), recorded at what they cost.
Property, plant and equipment is the main tangible part of non-current assets.
Most non-current assets lose value as they are used and as they age. The line "Accumulated depreciation" shows accumulated depreciation, the total fall in value recorded since the assets were bought, which is subtracted from their cost. In ABC Ltd's statement, assets that cost $900m have lost $100m in value, so they are shown at $800m. The intangible non-current assets of a business, such as patents and goodwill, are also part of non-current assets, although the simplified IB layout does not give them a line of their own.
Current assets are short-term assets that the business expects to turn into cash, or use up, within a year. They are what keeps the business running from day to day, and they are central to its liquidity, its ability to pay its short-term debts.
The IB layout lists three current assets:
Cash: the money held by the business in notes, coins and its bank accounts at the reporting date. It is the most liquid asset because it can be used immediately to pay debts.
Debtors: customers who have bought on credit and have not yet paid. A business that sells to other businesses typically gives 30 to 90 days to pay, so at any date some of its sales are still owed to it.
Stock: raw materials, work in progress and finished goods held for production or sale. Stock is also called inventory. It is the least liquid current asset, because it must first be sold, and then perhaps paid for on credit, before it becomes cash.
Non-current assets plus current assets give total assets, the value of everything the business owns at the reporting date. For ABC Ltd, total assets are $800m + $1,100m = $1,900m.
Current liabilities are debts the business must pay within a year. They are the claims that will soon take cash out of the business, so comparing them with current assets is the basis of liquidity analysis. The IB layout shows three:
Bank overdraft: the amount the business has withdrawn from its bank account beyond its balance, up to an agreed limit. The bank can usually ask for it to be repaid at short notice.
Trade creditors: suppliers who have provided goods or services on trade credit and have not yet been paid. Creditors are the mirror image of debtors: debtors owe the business money, while the business owes creditors money.
Other short-term loans: short-term borrowing that must be repaid within a year, including the part of a long-term loan that falls due in the next twelve months.
Non-current liabilities are debts that do not have to be repaid within the next year, shown in the IB layout as "Borrowings—long term". They include long-term borrowing such as bank loans repayable over several years, mortgages on property and debentures. They finance the purchase of non-current assets and long-term growth.
Current liabilities plus non-current liabilities give total liabilities, everything the business owes. Subtracting total liabilities from total assets gives net assets, the value that would be left for the owners if every asset were sold at its value in the accounts and every debt paid.
Equity is the owners' stake in the business. For a company it has two parts. Share capital is the money shareholders have paid into the company in exchange for its shares. Retained earnings are all the profits the company has kept since it started, year after year, rather than paying them out as dividends.
The second part of equity grows each year that the business makes a profit and keeps some of it.
Retained earnings are not a pile of cash. The profits that were kept have already been spent on machinery, stock, vehicles or other assets, or used to repay debts. A company with $1,000m of retained earnings may have very little cash, because the value is spread across all its assets.
 YouTube
Every statement of financial position balances: the value of the assets always equals the claims on those assets, either from outsiders (liabilities) or from the owners (equity). This rule is the accounting equation.
The equation always holds because every transaction has two effects that keep it in balance. If a business borrows $10,000 from a bank, cash (an asset) rises by $10,000 and borrowing (a liability) rises by $10,000. If it buys stock for cash, one asset (stock) rises and another (cash) falls by the same amount. If it makes a profit, its assets rise and its retained earnings, part of equity, rise by the same amount.
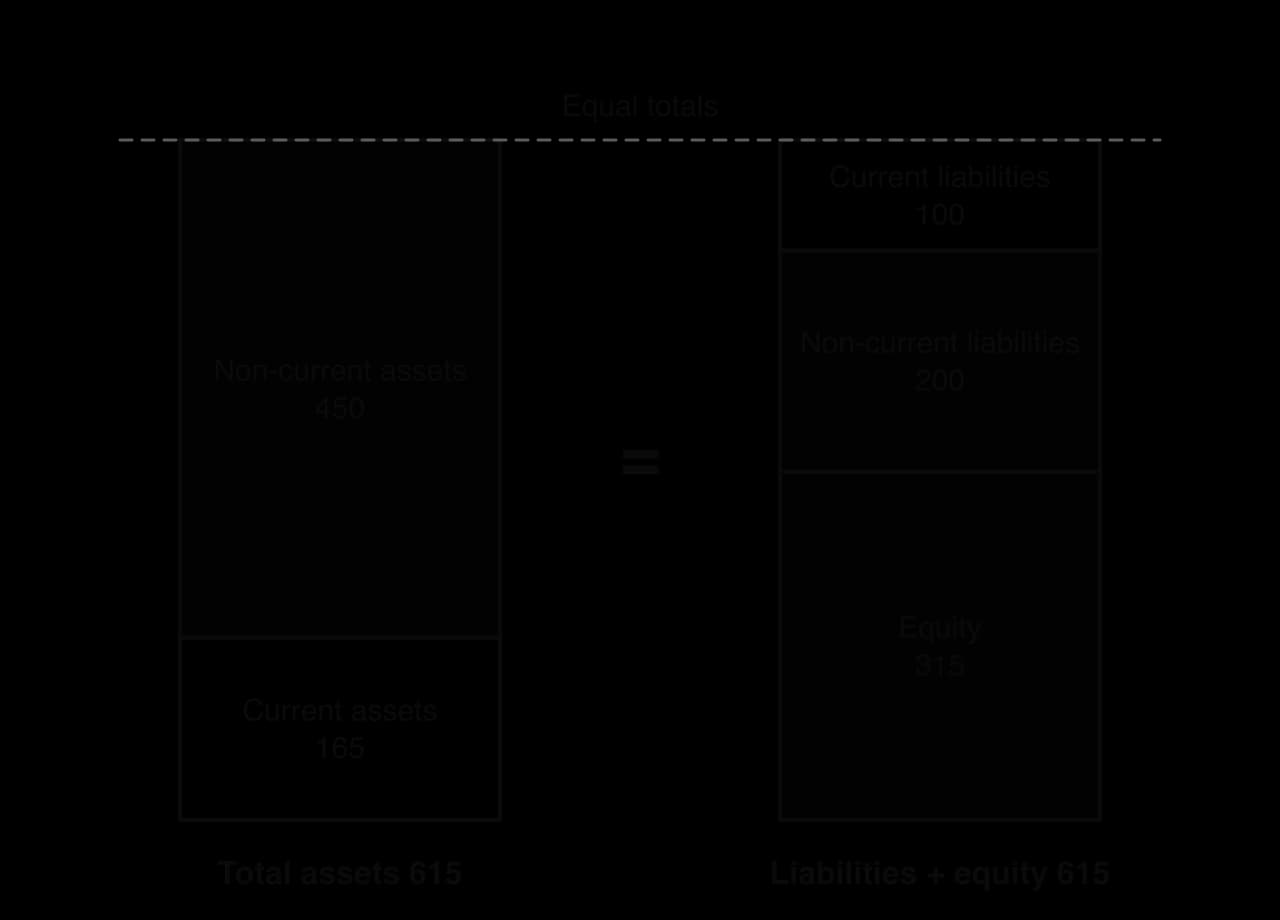
The diagram shows the statement of financial position of Kaito Bikes Ltd as two columns. The left column is what the business owns; the right column shows where the money for those assets came from. More than half of Kaito's assets are financed by its owners, and the rest by borrowing and suppliers.
As well as checking a statement, the equation can find a missing figure. If any one of total assets, total liabilities or equity is unknown, it can be calculated from the other two, and within each section a missing item can be found from its total.
The incomplete statement of financial position of Mehta Textiles Ltd (hypothetical data) has five missing figures, A to E. All figures are in $m.
Mehta Textiles Ltd | $m | $m |
|---|---|---|
Non-current assets | ||
Property, plant and equipment | 84 | |
Accumulated depreciation | (24) | |
Non-current assets | 60 | |
Current assets | ||
Cash | A | |
Debtors | 18 | |
Stock | 22 | |
Current assets | 52 | |
Total assets | B | |
Current liabilities | ||
Bank overdraft | 6 | |
Trade creditors | 14 | |
Other short-term loans | 5 | |
Current liabilities | 25 | |
Non-current liabilities | ||
Borrowings—long term | 35 | |
Non-current liabilities | 35 | |
Total liabilities | C | |
Net assets | D | |
Equity | ||
Share capital | 20 | |
Retained earnings | E | |
Total equity | D |
The statement of profit or loss and the statement of financial position are prepared from the same records, so their figures are linked. The most important link is through profit: the retained profit for the year, the last line of the statement of profit or loss, is added to the retained earnings brought forward from the start of the year.
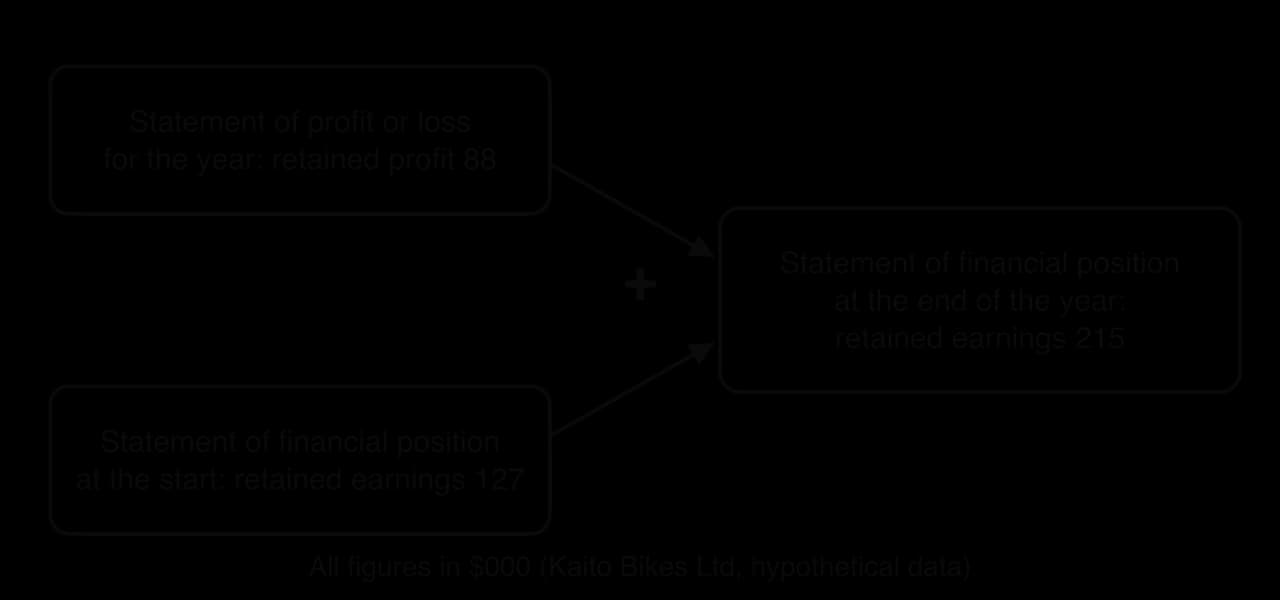
The diagram uses the figures for Kaito Bikes Ltd. The company started 2025 with retained earnings of $127,000 and kept $88,000 of the year's profit, so it ends the year with retained earnings of $215,000. If the company makes a loss, retained earnings fall instead.
There are other links. Closing stock is used in calculating cost of sales and also appears as a current asset. The cost of using non-current assets during the year appears as an expense in the statement of profit or loss, while the total fall in their value appears as accumulated depreciation in the statement of financial position. Interest in the statement of profit or loss is the cost of the borrowings shown as liabilities.
A charity or other non-profit organisation also prepares final accounts, but it does not aim to make a profit for owners. The difference between its income and its costs is called a surplus (or a deficit if costs are higher). A non-profit entity has no shareholders, so it pays no dividends, and in many countries it pays no tax on its surplus. The whole surplus is kept and used for its purpose.
The IB layout for a non-profit entity follows the same order as for a company, with "surplus" in place of "profit":
ABC (non-profit entity) | $m |
|---|---|
Sales revenue | 1,500 |
Cost of sales | (500) |
Gross surplus | 1,000 |
Expenses | (300) |
Surplus before interest | 700 |
Interest | (100) |
Surplus before tax | 600 |
Tax | 0 |
Surplus for period | 600 |
Retained surplus | 600 |
Its statement of financial position is the same as a company's down to net assets. The equity section is simpler: with no shareholders there is no share capital, so equity consists only of retained earnings, the surpluses kept over the years. Non-profit entities still need final accounts, because donors, grant-giving bodies, regulators of charities and lenders want to see that money is used as promised and that the organisation can continue.
Many of the most valuable things a business owns cannot be touched: the legal right to an invention, the reputation of a brand, the loyalty of customers. These are intangible assets. In technology, media, pharmaceuticals and consumer goods, intangible assets are often worth far more than buildings and machinery.
A patent gives the inventor of a new product or process the exclusive right to make, use and sell it for a limited time, in return for publishing how it works. In the United Kingdom, for example, a patent lasts up to 20 years and must be renewed every year. During that time competitors cannot copy the invention without permission, which allows the owner to charge higher prices and recover the cost of research and development.
A patent is valuable only while it lasts and while the invention is in demand. Pharmaceutical companies often see sales of a medicine fall sharply when its patent expires and other firms begin to sell cheaper generic versions. The protection of patents and their role in innovation are part of research and development.
A copyright protects original creative work (books, music, films, software, photographs, designs) from being copied without permission. Unlike a patent, it usually arises automatically when the work is created and lasts for many decades. In the United States, works published in 1928 were protected for 95 years: Disney's first Mickey Mouse film, Steamboat Willie (1928), entered the public domain on 1 January 2024, so anyone may now copy that original film, though not later versions of the character.
Sources: Duke University School of Law, Center for the Study of the Public Domain, "Public Domain Day 2024".
A trademark is a sign that distinguishes one business's products from those of others: a name, logo, symbol, slogan or even a sound or colour. Registration usually lasts ten years and can be renewed indefinitely, so a trademark can protect a brand for as long as the business keeps paying the fees. This makes trademarks among the longest-lasting intangible assets.
Sources: UK Government, guidance on patents (gov.uk); World Intellectual Property Organization, "Trademarks" (wipo.int).
A licence is a right, bought from its owner, to use something the business does not own: a broadcasting frequency, a mobile phone network spectrum, the right to make a branded product, or a software platform. A franchise agreement gives a franchisee the right to use another firm's brand and business model. Both are intangible assets because they bring future benefits, and both usually last for a fixed period, after which their value falls to zero.
When one business buys another, it usually pays more than the value of the separate assets it acquires minus the liabilities it takes on. The extra amount pays for things that are not recorded as separate assets: the reputation of the business, its loyal customers, its skilled staff, its location and its relationships with suppliers. This extra amount is recorded as goodwill in the buyer's statement of financial position.
For example, if a retailer pays $50 million for a smaller chain whose assets minus liabilities are worth $35 million, it records goodwill of $50m − $35m = $15m. Goodwill appears in the accounts only after an acquisition; the goodwill a business builds up itself is not recorded.
Goodwill can lose value quickly if the acquired business performs worse than expected. In February 2019 the US food company Kraft Heinz recorded non-cash impairment charges of $15.4 billion, cutting the value of goodwill (by about $7.1 billion) and of intangible assets, mainly the Kraft and Oscar Mayer trademarks (by about $8.3 billion). The write-down turned its fourth-quarter result into a large loss and showed that its earlier valuations of brands and goodwill had been too optimistic.
Sources: The Kraft Heinz Company, "Kraft Heinz Reports Fourth Quarter and Full Year 2018 Results", 21 February 2019.
A strong brand allows a business to charge higher prices and keep loyal customers, so it has brand value. Consultancies estimate brand values every year: Interbrand's 2025 ranking valued the Coca-Cola brand at about US$60.1 billion, seventh in the world. Yet a brand that a business has built itself, through years of marketing, does not appear in its statement of financial position, because accounting rules allow only brands that have been bought from another business to be recorded. Two companies with equally strong brands can therefore show very different assets depending on whether they bought their brands or built them.
Sources: Interbrand, "Best Global Brands 2025".
Type | What it protects or represents | How long it lasts | Example |
|---|---|---|---|
Patent | An invention (a product or process) | Usually up to 20 years | A new medicine or battery design |
Copyright | Original creative work | Many decades (95 years for older US works) | A film, a song, software code |
Trademark | A name, logo, symbol or slogan | Usually 10 years, renewable indefinitely | A company's logo |
Licence or franchise | The right to use something owned by another business | The length of the agreement | Mobile spectrum, a fast-food franchise |
Goodwill | Reputation, customers, staff and other advantages of an acquired business | As long as those advantages last | The premium paid in a takeover |
Brand | Customers' recognition and loyalty | Indefinite, if maintained | A global soft drinks brand |
Tangible assets such as machinery have a purchase price and a market where similar machines are sold. Intangible assets usually have neither, so their value depends heavily on judgment:
No physical form and often no market. A patent or a brand is unique, so there is no market price to compare it with.
Value depends on the future. A patent is worth the extra profit it will bring over its remaining life, which depends on demand, competition and technology, all of which are uncertain.
Value can change suddenly. A product recall, a scandal or a new competing technology can destroy the value of a brand or patent almost overnight.
Internally generated intangibles are not recorded. A brand or reputation built by the business itself does not appear in the accounts, so the statement of financial position understates its true value.
Scope for creative accounting. Because the figures rest on estimates, managers can value intangibles generously to make the business look stronger, as goodwill write-downs such as Kraft Heinz's later show.
Final accounts are the most widely used source of information about a business, but users who rely on them alone can be misled. Their main limitations are:
They are historical. They describe the past year, often several months after it ended, while users are interested in the future.
They show only quantitative information. Staff morale, customer satisfaction, the quality of management, the strength of competitors and the business's environmental impact do not appear in the figures.
The statement of financial position is a snapshot. It shows one day, which may not be typical, and it can be window-dressed.
Assets are mostly shown at historical cost. Land bought decades ago may be worth far more than its value in the accounts, and internally built intangibles are left out altogether.
They depend on estimates and accounting policies. Different choices about depreciation, stock valuation and intangible assets give different profits, which makes comparison between businesses difficult.
Inflation distorts comparisons over time. Rising sales revenue may simply reflect rising prices rather than more goods sold.
They can be manipulated. Creative accounting and, at worst, fraud can make the figures unreliable, as the case of Wirecard shows.
How useful final accounts are therefore depends on who is reading them and why. A manager comparing this year with last year within the same business, using the same accounting policies, can learn a great deal. An investor comparing two businesses in different countries, or a lender trying to judge whether a firm will survive the next five years, should combine the accounts with ratio analysis, cash flow information, industry data and qualitative information about the business and its market.
Final accounts connect with each of the four key concepts, as the table summarises.
Key concept | How it applies to final accounts |
|---|---|
Ethics | Accountants and directors must present a true and fair view; creative accounting, window dressing and fraud deceive investors, lenders, employees and the public. |
Change | Final accounts record the effect of change (growth, a recession, new competitors) and are used to plan responses, such as cutting costs or raising finance. |
Creativity | Creativity in financial reporting can help, by presenting information clearly to stakeholders, or harm, when "creative" accounting is used to hide poor performance. |
Sustainability | Honest reporting keeps the trust on which long-term survival depends; many large companies now also report on social and environmental performance alongside their final accounts, in line with the triple bottom line. |
Non-current assets such as machinery, vehicles and computers lose value over time. Depreciation is the accounting method that records this loss of value as a cost spread over the years in which the asset is used, rather than charging the whole purchase price as a cost in the year the asset is bought.
Spreading the cost matches each year's revenue with the cost of the assets used to earn it. A delivery van that costs $48,000 and is used for five years helps to earn revenue in all five years; charging $48,000 in the first year would make that year's profit too low and the next four years' profits too high.
Wear and tear: physical use gradually reduces an asset's ability to work (an engine, a printing press, a delivery van).
Obsolescence: the asset becomes out of date because newer, better technology is available, even if it still works (computers, phones, older production equipment).
The passage of time: some assets are used up simply as time passes, such as a lease on a building that runs for ten years.
Depletion: natural resources such as a mine or an oil field are used up as they are extracted.
Three figures are needed before any depreciation can be calculated: the cost of the asset, its useful life and its residual value. The cost is known; the other two are estimates made when the asset is bought.
The second estimate is what the asset will be worth when the business has finished with it.
Each year the depreciation charged so far is added up as accumulated depreciation. Subtracting accumulated depreciation from the original cost gives the net book value (NBV), the value of the asset in the accounts at that date. At the end of the asset's useful life its net book value equals its residual value.
Accumulated depreciation is the running total that links the depreciation schedule to the statement of financial position.
The straight-line method charges the same amount of depreciation in every year of the asset's life. The amount to be written off, cost minus residual value, is divided equally between the years. On a graph of net book value against time, the asset's value falls in a straight line, which gives the method its name.
The units of production method links depreciation to how much the asset is used rather than to how much time has passed. The useful life is measured in units of output (items made, kilometres driven, hours run, tonnes extracted), and a depreciation rate per unit is calculated. Each year's depreciation is that rate multiplied by the units produced in the year, so a busy year carries more depreciation than a quiet one.
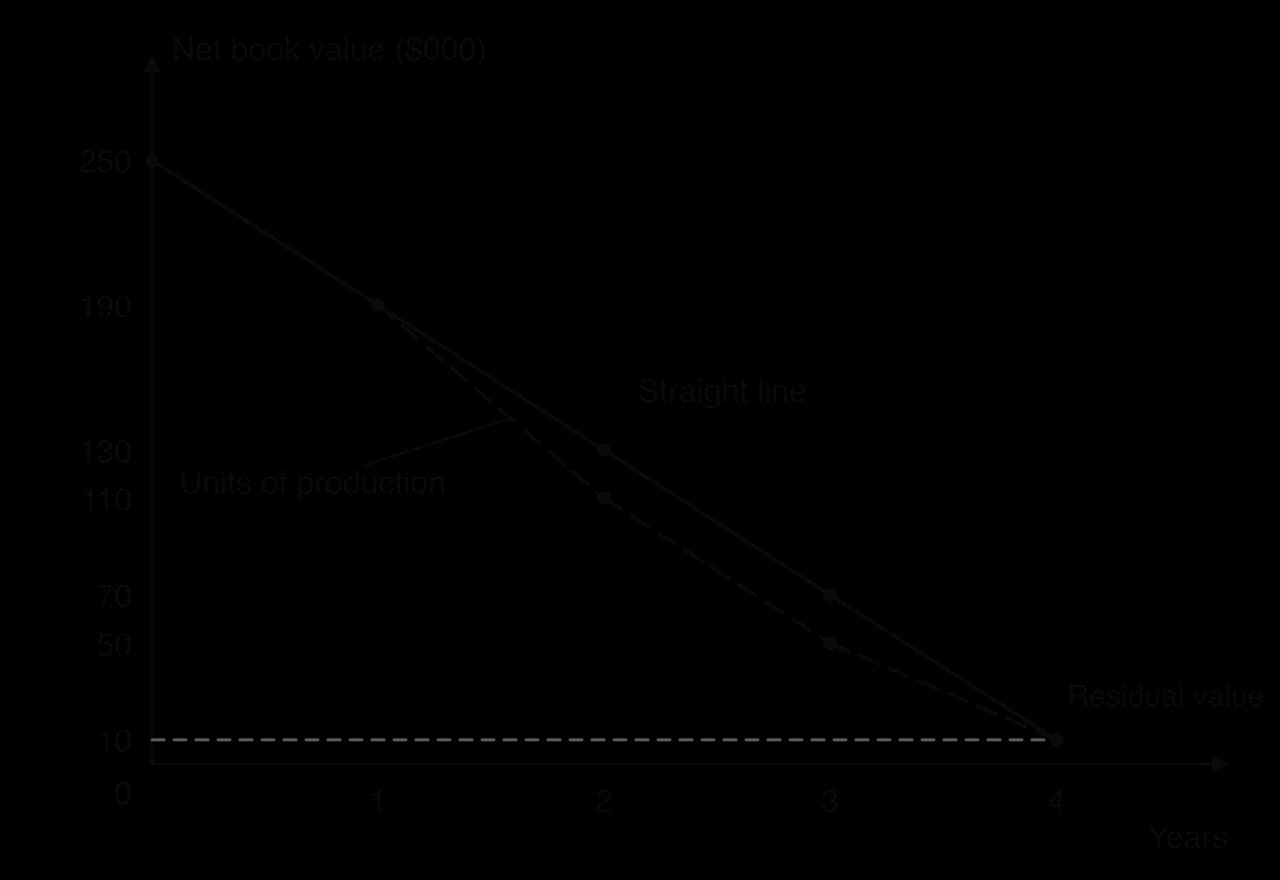
The graph plots the two schedules for the filling machine. Over the whole life the total depreciation is identical ($240,000); the methods differ only in how it is spread between the years, and so in how much profit is reported in each year.
The units of production method is widely used in mining. BHP, the Australian mining company, depreciates mineral rights and much of its mine-related plant on a units of production basis linked to its proved and probable reserves, and other plant and equipment on a straight-line basis over 3 to 30 years, because the pattern in which a mine's assets are used follows the tonnes extracted.
Sources: BHP Group Limited, Annual Report on Form 20-F for the year ended 30 June 2025, note on property, plant and equipment.
Depreciation affects both statements. Each year's depreciation charge is included in expenses in the statement of profit or loss, which reduces profit before interest and tax. The total charged so far appears as accumulated depreciation in the statement of financial position, where it is subtracted from the cost of property, plant and equipment to give the net book value of non-current assets.
For the filling machine at the end of year 2 under the units of production method, the statements would show:
Statement | Line | Amount ($) |
|---|---|---|
Statement of profit or loss, year 2 | Expenses include depreciation of | 80,000 |
Statement of financial position, end of year 2 | Property, plant and equipment (at cost) | 250,000 |
Accumulated depreciation | (140,000) | |
Non-current assets (net book value) | 110,000 |
Depreciation is a non-cash expense. The cash left the business when the machine was bought; the yearly depreciation charge reduces profit but no money is paid out. This is one reason why a business's profit and its cash flow differ. Intangible assets with a limited life, such as a patent or licence, are written off in the same way through amortisation.
Both methods are accepted in published accounts, and a business may use different methods for different types of asset. The aim is to choose the method that best reflects the pattern in which the asset's benefits are used up.
| Straight-line method | Units of production method |
|---|---|---|
Advantages | Simple to calculate and to understand; the same charge every year makes profits easy to compare and budgets easy to set; needs only an estimate of life in years. | Matches the cost of the asset to the output it produces, so the charge rises in busy years and falls in quiet ones; reflects wear and tear more accurately for heavily used machinery and vehicles. |
Disadvantages | Ignores how much the asset is actually used; many assets lose more value in their early years (vehicles, computers), so the net book value may be far above the market value. | Needs an estimate of total lifetime output, which is hard to predict; needs records of use each year; the charge, and so profit, varies from year to year; ignores loss of value through obsolescence or time when the asset is idle. |
Most suitable for | Assets used fairly evenly over time or that lose value with time: buildings, office furniture, leases, fixtures and fittings. | Assets whose wear depends on use: production machinery, delivery vehicles (kilometres), aircraft engines (flight hours), mines and quarries (tonnes). |
The choice depends first on the nature of the asset. If an asset wears out mainly through use, as a printing press or a mining truck does, the units of production method gives a fairer picture of each year's cost. If an asset loses value mainly with time or through obsolescence, as an office building or a laptop does, units of production makes little sense and the straight-line method is more appropriate.
It also depends on the pattern of the business's output. A business whose output is stable will find that the two methods give similar results, so the simpler straight-line method is usually preferred. A seasonal or cyclical business, such as a construction firm or a farm machinery contractor, may prefer units of production so that depreciation falls in quiet years when revenue is also low, although this makes profit more volatile.
Finally, the reliability of the estimates matters. Units of production depends on an estimate of lifetime output that may prove wrong, and both methods depend on estimates of useful life and residual value. Because these estimates change reported profit, the choice of method and of estimates can be used for creative accounting: extending an asset's useful life from five to eight years, for example, cuts each year's depreciation and raises profit without any change in the business. Consistency from year to year, and disclosure of the method used, are what make either method trustworthy to users of the accounts.
Wirecard AG was a German payments company, based near Munich, that processed card and online payments for retailers and issued payment cards. It grew rapidly in the 2010s and in September 2018 joined the DAX, then the index of Germany's 30 largest listed companies, replacing Commerzbank. Its final accounts showed fast-rising sales revenue and profit, and they were audited by EY (Ernst & Young), one of the world's largest accounting firms, which issued an unqualified (clean) audit opinion on them.
Wirecard's 2018 annual report showed sales revenue of €2,016.2 million, up from €1,488.6 million in 2017, and earnings after tax of €347.4 million. Its statement of financial position at 31 December 2018 showed total assets of €5,854.9 million. Nearly half of those assets (€2,719.8 million, or 46%) were cash, and a further €1,409.5 million were intangible assets, half of which was goodwill from the businesses it had bought.
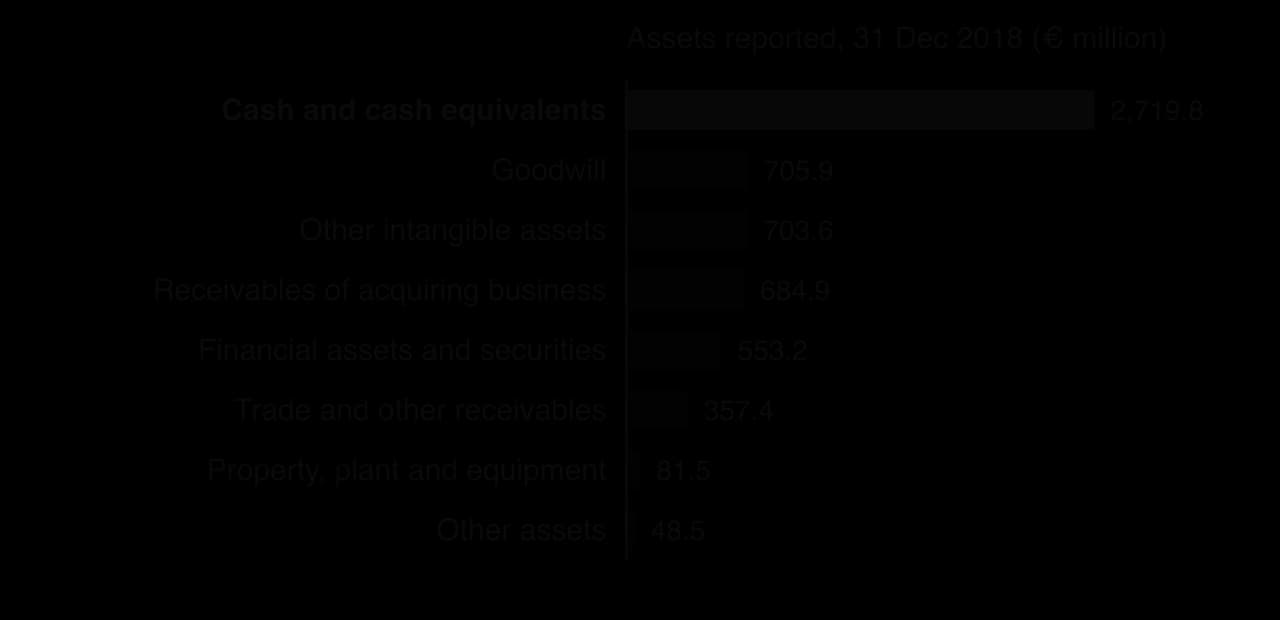
From 2015 onwards the Financial Times published a series of investigations questioning Wirecard's accounts, including reports in 2019 that staff in its Singapore office had used forged contracts to inflate sales. Wirecard denied the claims and took legal action against the newspaper, while BaFin, Germany's financial regulator, focused its own investigations on short-sellers and journalists rather than on the company. A special investigation by the accounting firm KPMG, published in April 2020, found failings in Wirecard's records.
On 18 June 2020 Wirecard announced that EY had refused to sign off its 2019 accounts, because it could not confirm that €1.9 billion of cash supposedly held in trust accounts in Asia existed, about a quarter of the balance sheet. Two banks in the Philippines said that documents showing the deposits were false. The chief executive, Markus Braun, resigned the next day; on 22 June the company said there was a "prevailing likelihood" that the money did not exist and withdrew its earlier results.
Braun was arrested on the evening of 22 June, and on 25 June 2020 Wirecard applied for insolvency at the Munich court, the first DAX member to fail. Its shares, which had traded above €100 before the scandal, fell to under €3, and banks had lent it about €1.75 billion. Braun's criminal trial for fraud, breach of trust and market manipulation began in Munich in December 2022.
 YouTube
Who relied on the accounts. Almost every stakeholder group was misled. Shareholders bought shares at prices based on reported profits; banks and bondholders lent on the strength of a statement of financial position showing billions in cash; employees, customers and partner businesses assumed the company was secure; the DAX included it because of its reported size. Internal users with the power to manipulate the records had information that external users did not.
Which figures were most open to manipulation. The two largest items in Wirecard's assets were cash said to be held by third parties and intangible assets, the figures that are hardest for outsiders to verify. Cash is normally the easiest asset to check, but only if the auditor confirms the balances directly with the banks. The case shows why auditors' independence and their checks on the existence of assets are central to ethical accounting.
Ethics and the limitations of accounts. The fraud broke the central principles of ethical accounting, including integrity, objectivity and transparency. It also illustrates the limitations of final accounts. Even audited statements can be false, a strong set of figures says nothing about the honesty of management, and users who looked beyond the accounts (journalists and short-sellers comparing the reported business with what they could see on the ground) found the truth before the regulators did. The collapse prompted an overhaul of BaFin, which was heavily criticised for ignoring the early warning signs.
Limits of the case. Wirecard was fraud, not creative accounting within the rules, so it is an extreme case: most businesses' accounts are broadly reliable. Many details of what happened are still being decided in the courts, and the 2018 figures are those Wirecard reported at the time, many of which are now known to be untrue.
Explain why lenders and shareholders relied on Wirecard's statement of financial position, and which figures in it should have concerned them.
Analyse why cash held by third parties and intangible assets are harder to verify than property, plant and equipment.
To what extent can an audit protect stakeholders from misleading final accounts?
Sources: Wirecard AG, Annual Report 2018; Reuters, "Total disaster: Phantom billions plunge Wirecard into chaos", 22 June 2020 (via MarketScreener); Al Jazeera, 22 June 2020; The Irish Times, 22 June 2020; Finance Magnates, "Wirecard Files for Insolvency with Missing €1.9 Billion", 25 June 2020; AFP via TechXplore, "Ex-Wirecard CEO goes on trial over 'unparalleled' fraud", 5 December 2022.
Final accounts are tested mainly in Paper 2, where you may be asked to prepare or complete a statement from data, calculate a missing figure, or explain how a transaction affects the statements. Paper 1 can ask about the purpose of accounts for stakeholders, ethical accounting and intangible assets. HL students may also be asked to calculate depreciation and evaluate the methods in Paper 2.
A definition earns full marks when it is precise and adds a second, developing point; an example alone, with no definition, earns at most one mark.
Statements in the answer should always balance; if they do not, check the arithmetic of each section before moving on, because examiners can award follow-through marks only for working they can see.
Structured questions on intangible assets usually ask for explanation applied to the case rather than a list of types.
A follow-up question might ask which method is more appropriate for the drone. The answer would argue that a drone's motors and batteries wear out mainly through flying, so units of production matches the cost to use; but drones also become obsolete quickly as technology improves, which favours writing off value with time, and a judgment would depend on which effect is stronger for SkyDrop.
Final accounts are the statement of profit or loss (performance over a period) and the statement of financial position (assets, liabilities and equity at one date).
Different stakeholders use the accounts for different decisions, and external users depend on honest, audited figures.
Ethical accounting rests on integrity, objectivity and transparency; creative accounting and window dressing make accounts look better than the business really is.
The statement of profit or loss runs from sales revenue through gross profit, profit before interest and tax, profit before tax and profit for period to retained profit; a non-profit entity reports surpluses and pays no dividends.
In the statement of financial position, total assets − total liabilities = net assets = total equity (the accounting equation); retained profit links the two statements through retained earnings.
Intangible assets (patents, copyrights, trademarks, licences, goodwill, brands) are valuable but hard to value, and brands built by the business itself are not recorded.
Depreciation spreads the cost of a non-current asset over its useful life: equal amounts by the straight-line method, or in proportion to use by the units of production method (HL).
The appropriate depreciation method depends on how the asset loses value, the pattern of output and the reliability of the estimates (HL).
I can explain why shareholders, managers, employees, lenders, suppliers, customers, government and competitors use final accounts.
I can explain the principles of ethical accounting and distinguish creative accounting, window dressing and fraud.
I can prepare a statement of profit or loss in the IB layout, including calculating cost of sales and leaving out items that do not belong.
I can prepare a statement of profit or loss and a statement of financial position for a non-profit entity.
I can prepare and complete a statement of financial position and check it with the accounting equation.
I can explain how retained profit, closing stock and depreciation link the two statements.
I can explain the types of intangible assets and why they are difficult to value.
I can calculate depreciation by the straight-line and units of production methods and prepare a depreciation schedule (HL).
I can evaluate which depreciation method is more appropriate for a given asset (HL).
= 42.00 %
Award [1] for calculating capital employed (RM10 000 000, or 10 000 in RM000), [1] for correct substitution into the gearing formula, and [1] for the correct answer with the % sign.
N.B. Current liabilities (the overdraft and trade creditors) are not part of capital employed. If a candidate includes them (5 700 ÷ 11 500 × 100 = 49.57 %, or 4 200 ÷ 11 500 × 100 = 36.52 %), award a maximum of [1].
Award a maximum of [2] if the % sign is missing.
Andean Bean Exporters (ABE) buys coffee from farmers in the Huila region of Colombia, roasts it and exports it to Europe and Asia. All figures below are in US$000 and refer to the year ending 31 December 2025.
Table 1: Extracts from ABE’s final accounts for the year ending 31 December 2025 ($000)
Item | $000 |
|---|---|
Sales revenue | 9 800 |
Profit before interest and tax | 1 260 |
Interest | 196 |
Current liabilities | 900 |
Non-current liabilities (bank loan) | 2 800 |
Share capital | 3 000 |
Retained earnings | 4 200 |
Calculate ABE’s return on capital employed (ROCE) for 2025 (show all your working).
3 marks
Volta Solar Installers (VSI) sells and fits solar panels for homes and small businesses in Accra and Kumasi, Ghana.
Table 1: VSI’s statement of profit or loss for the year ending 31 December 2025 (GH₵)
GH₵ | |
|---|---|
Sales revenue | 2 400 000 |
Cost of sales | (1 560 000) |
Gross profit | 840 000 |
Expenses | (504 000) |
Profit before interest and tax | 336 000 |
Interest | (60 000) |
Profit before tax | 276 000 |
Tax | (69 000) |
Profit for period | 207 000 |
Using Table 1, calculate VSI’s gross profit margin and profit margin for 2025 (show all your working).
4 marks
18 |
Non-current liabilities |
Borrowings—long term | 50 |
Non-current liabilities | 50 |
Total liabilities | 68 |
Net assets | 100 |
Equity |
Retained earnings | 100 |
Total equity | 100 |