Notes on A.3.3 Fatigue and recovery
Learning objectives
Outline what fatigue is and distinguish between central fatigue and peripheral fatigue.
Describe the sites along the pathway from the brain to the cross-bridge where fatigue can arise.
Explain how depletion of phosphocreatine, muscle glycogen and liver glycogen contributes to fatigue.
Explain how changes in sodium and potassium ions, acidosis and the accumulation of inorganic phosphate contribute to fatigue.
Explain how dehydration and hyperthermia affect the cardiovascular system and impair performance.
Analyse which causes of fatigue dominate in different activities and environments.
Describe physiological, symptomatic and psychological signs of recovery, and how each is measured.
Evaluate nutritional strategies for recovery: water and sodium, carbohydrate and protein, creatine monohydrate and polyphenol-rich foods.
Evaluate recovery techniques, including myofascial release, compression garments, thermotherapy and cold-water immersion.
Evaluate sleep as a recovery strategy, including the effects of training load and travel across and within time zones.
Introduction
Fatigue is the reduced ability to keep producing force or power during exercise, and recovery is the set of processes that return the body to its pre-exercise state and prepare it for the next session. How quickly an athlete fatigues limits performance in a single event, and how well they recover limits how much training they can absorb over weeks and months.
Fatigue and recovery matter for both health and performance. For performance, the causes of fatigue explain why a 400 m runner slows in the final 100 m and why a marathon runner can “hit the wall”, and recovery strategies decide whether a team can play three tournament matches in five days. For health, the same knowledge helps an untrained adult starting an exercise programme tolerate the first weeks of muscle soreness, protects workers and athletes from heat illness, and links poor sleep with illness, injury and low mood.
What fatigue is
In everyday language “fatigue” means tiredness. In exercise physiology it has a narrower meaning. A muscle is fatigued when it can no longer produce the force or power it produced at the start, or when the same force can only be kept up with a greater sense of effort. Fatigue therefore has a measurable, physical side and a perceived side.
Fatigue begins long before an athlete stops. In laboratory studies, maximal voluntary force is tested at intervals during a task, and it often falls steadily from the first minutes even though the athlete is still able to keep up the submaximal effort the task requires. Exhaustion, or task failure, is the end point: the moment the required force or pace can no longer be produced.
Fatigue is also task-specific. A sprinter who can no longer hold top speed after 300 m can still walk and talk easily, and a cyclist exhausted after a 3-hour ride can still produce a short burst of high power. The causes of fatigue depend on the intensity and duration of the activity, the environment and the individual, so there is no single “fatigue substance” in the body.
Central and peripheral fatigue
Every voluntary movement depends on a chain of events. The motor cortex of the brain sends impulses down the spinal cord to motor neurons; each motor neuron carries impulses to the muscle fibres of its motor unit; at the neuromuscular junction a neurotransmitter (acetylcholine) starts an action potential along the sarcolemma and into the T-tubules; this triggers the release of calcium ions (Ca²⁺) from the sarcoplasmic reticulum; calcium allows myosin heads to bind to actin and form cross-bridges, which pull the filaments together using energy from adenosine triphosphate (ATP). Fatigue can arise at any link in this chain.
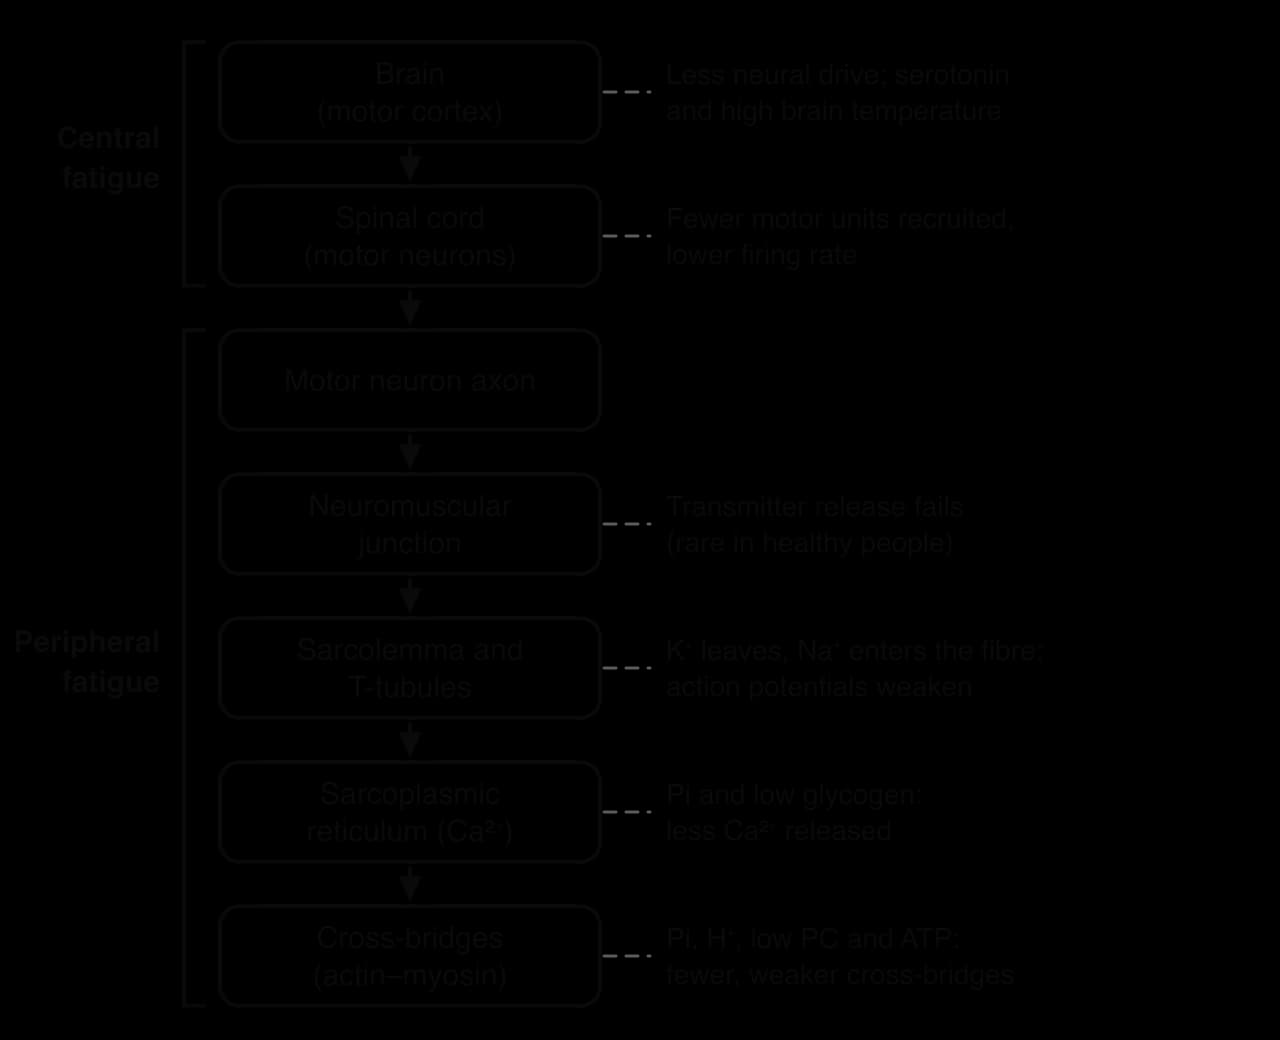
The figure divides the pathway into two parts. Central fatigue arises in the central nervous system, the brain and spinal cord, when the nervous drive to the muscles falls. Peripheral fatigue arises at or beyond the neuromuscular junction, inside the muscle itself, when the fibres respond less strongly to the same nervous drive.
A centrally fatigued muscle could still produce more force if the nervous system activated it fully.
Scientists separate the two with an electrical technique. During a maximal voluntary contraction, a brief electrical stimulus is applied to the motor nerve. If the stimulus adds extra force, the brain was not activating the muscle fully, which points to central fatigue. If the muscle produces less force even when stimulated directly, the muscle itself has fatigued, which points to peripheral fatigue. Most exercise produces a mixture of both.
Mechanisms of central fatigue
Central fatigue reduces the number of motor units the brain recruits and the rate at which their motor neurons fire. Fatigue therefore changes motor unit recruitment: as fibres fatigue, the nervous system must recruit additional motor units to hold the same force, and when central drive falls it can no longer do so. Several mechanisms are proposed:
Brain neurotransmitters. The serotonin hypothesis proposes that prolonged exercise raises serotonin activity in the brain, which increases feelings of tiredness and lethargy and reduces motor drive. Dopamine, linked with motivation and arousal, may act in the opposite direction. The evidence comes partly from animal studies and from drug trials, and changing serotonin with supplements has not reliably changed performance in humans.
Feedback from the muscles. Small sensory nerve fibres in fatiguing muscle signal rising metabolites (H⁺, Pi, potassium). This feedback inhibits motor neurons in the spinal cord and contributes to the sensation of effort.
High brain temperature and low blood glucose. Both reduce the brain’s output, and both matter most in prolonged exercise in the heat.
Perception and motivation. The rating of perceived exertion rises steadily during a fixed task. Motivation, encouragement, music and competition can raise the effort an athlete is willing to tolerate, which shows that the brain does not always recruit everything available.
This last point links fatigue with sports psychology. If perceived effort helps decide when an athlete slows down, then motivation, confidence and arousal can change endurance performance even when the muscles are unchanged.
The central governor model
The central governor model is a theory proposed by Timothy Noakes and colleagues from the late 1990s. It suggests that the brain continuously regulates exercise intensity, using information from the body (temperature, fuel stores, oxygen levels) and knowledge of how far is left to go, so that exercise ends before damage to the body occurs. Fatigue, in this model, is a sensation created by the brain to protect homeostasis, not a direct result of the muscles failing.
Evidence used to support the model includes the “end spurt”, in which runners speed up in the final stage of a race even though they were apparently fatigued, and the observation that athletes stop exercising in the heat before core temperature reaches dangerous levels.
Critics argue that the model is hard to test because almost any result can be explained as “the governor deciding”, that maximal efforts do sometimes reach true muscular limits, and that peripheral changes in the muscle are measurable and strongly linked to force loss. The model is best treated as a debated idea that has drawn attention to the role of the brain in fatigue.
Feature | Central fatigue | Peripheral fatigue |
|---|---|---|
Site | Brain and spinal cord | Neuromuscular junction, sarcolemma, sarcoplasmic reticulum, cross-bridges |
What changes | Reduced neural drive: fewer motor units recruited, lower firing rate | Reduced response of the muscle fibres to the same neural drive |
Main causes | Brain neurotransmitters (serotonin), feedback from fatiguing muscle, high brain temperature, low blood glucose, perception of effort | Fuel depletion, ionic changes (K⁺, Na⁺), acidosis, inorganic phosphate, impaired calcium release |
Typical activity | Prolonged exercise, especially in the heat | High-intensity exercise; also the late stages of prolonged exercise when glycogen is low |
How it is detected | Electrical nerve stimulation during a maximal contraction adds force | Force is lower even when the muscle is stimulated electrically |
In practice the two interact: a muscle with low fuel and rising metabolites sends signals that reduce central drive, and reduced central drive changes how the remaining motor units are used.
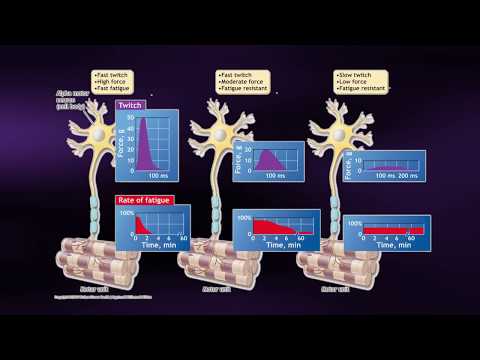 YouTube
Insufficient fuel
A muscle can only keep contracting while ATP is resynthesised as fast as it is used. ATP itself rarely falls by more than about a third, even at exhaustion, because the cell protects it. Instead, fatigue occurs when the fuels that rebuild ATP run low, so the rate of ATP resynthesis falls and the athlete must slow down to an intensity the remaining fuel supply can support.
Phosphocreatine depletion
In maximal efforts lasting a few seconds, ATP is resynthesised mainly by the phosphagen system, which breaks down phosphocreatine (PC) stored in the muscle. PC stores are small. During an all-out sprint, PC falls to low levels within about 10 seconds, and the fall in PC closely matches the fall in power output. The glycolytic system then supplies more of the ATP, but at a lower maximal rate, so speed drops.
PC depletion explains why a 100 m sprinter decelerates slightly in the final 20–30 m and why repeated sprints get slower when recovery between them is short. About half of the PC is restored within 30 seconds of rest and most within about 3 minutes, so in team sports such as football, rugby and basketball, players who must sprint again after a few seconds of recovery do so with only partly restored PC.
The breakdown of PC also has a second consequence. Each molecule of PC that is split releases one inorganic phosphate (Pi), and the rising concentration of Pi is now thought to be one of the most important causes of fatigue in high-intensity exercise.
Muscle glycogen depletion
Glycogen is the stored form of carbohydrate in muscle and liver. During exercise lasting more than about 90 minutes at moderate to high intensity, muscle glycogen is the main fuel. Glycogen depletion occurs when these stores fall to very low levels in the working muscles, and it is a major cause of fatigue in prolonged exercise such as marathon running, road cycling and long team-sport matches.
Muscle glycogen matters because carbohydrate can be broken down to resynthesise ATP about twice as fast as fat. When glycogen runs out, the muscle has to rely more on fat oxidation through the oxidative system. Fat stores are large, but they cannot supply ATP fast enough for high-intensity endurance exercise, so the athlete can continue only at a much lower pace. Low glycogen also appears to reduce calcium release from the sarcoplasmic reticulum, which links fuel supply with excitation–contraction coupling.
The classic evidence comes from some of the earliest studies to use the needle biopsy technique in exercising humans, carried out in Stockholm in the 1960s. Nine physical education students cycled to exhaustion at about 75% of VO₂ max three times: after a normal mixed diet, after three days of a fat and protein diet, and after three days of a high-carbohydrate diet. Each diet produced a different starting level of muscle glycogen.

The chart shows two patterns. First, starting glycogen and time to exhaustion rise together: about 0.6 g per 100 g of muscle (1 g per 100 g is about 62 mmol kg⁻¹ wet muscle) lasted 57 minutes, while about 3.3 g per 100 g lasted 167 minutes, almost three times as long. The authors reported a strong correlation between starting glycogen and work time (r = 0.92). Second, glycogen was nearly exhausted at the end of every trial, whatever the diet. This is the origin of carbohydrate loading, the practice of increasing carbohydrate intake in the days before an endurance event.
Liver glycogen depletion and hypoglycaemia
The liver stores glycogen and releases glucose into the blood to keep blood glucose concentration within its normal range. During prolonged exercise the muscles take up glucose from the blood faster than at rest, and the liver’s store can run low after 2–3 hours. When the liver can no longer keep up, blood glucose falls, a condition called hypoglycaemia.
Hypoglycaemia causes fatigue mainly through the brain, which relies almost entirely on glucose as its fuel. Low blood glucose produces dizziness, poor concentration, weakness and a sharp rise in perceived effort, so it contributes to central fatigue. In a study of seven trained cyclists riding at 71% of VO₂ max, fatigue after about 3 hours on a placebo drink was preceded by a fall in plasma glucose to 2.5 mmol L⁻¹. When the same cyclists drank carbohydrate during the ride, blood glucose stayed normal and they rode for about one hour longer.
Endurance athletes describe the combination of muscle glycogen depletion and falling blood glucose as “hitting the wall” in running or “bonking” in cycling: a sudden, severe slowing, often in the last third of a marathon, with heavy legs and difficulty thinking clearly. Taking in carbohydrate during the event delays it; carbohydrate loading before the event raises the starting stores.
Sources: Bergström et al., Acta Physiologica Scandinavica, 1967; Coyle et al., Journal of Applied Physiology, 1986.
Metabolic and ionic causes of fatigue
Within the muscle fibre, intense exercise changes the concentration of several ions and metabolites. Each of these changes can reduce force by disturbing a different step of excitation–contraction coupling, the sequence from the action potential to the cross-bridge described by the sliding filament theory.
Sodium and potassium ions
A muscle fibre at rest has a high concentration of potassium ions (K⁺) inside and a high concentration of sodium ions (Na⁺) outside. Each action potential lets Na⁺ flow into the fibre and K⁺ flow out. The sodium–potassium pump, which uses ATP, then moves the ions back. During intense, repeated contractions the pump cannot keep pace, so K⁺ accumulates in the fluid outside the fibres, especially in the narrow T-tubules, and Na⁺ accumulates inside.
These changes reduce the excitability of the sarcolemma. The resting membrane potential becomes less negative, action potentials become smaller and slower, and some may fail to travel deep into the T-tubules. Less calcium is released from the sarcoplasmic reticulum, and the fibre produces less force. Blood potassium rises noticeably during intense exercise because so much K⁺ leaves the working muscles, and it falls back quickly when exercise stops.
Training increases the number of sodium–potassium pumps in the muscle, which is one reason trained athletes tolerate repeated high-intensity efforts better. Epinephrine released during exercise also stimulates the pumps, helping to protect excitability.
Acidosis
During high-intensity exercise, the glycolytic system breaks down glucose and glycogen very rapidly. Hydrogen ions (H⁺) are released, mainly from the breakdown of ATP and from glycolysis, faster than the muscle’s buffers can absorb them. Muscle pH can fall from about 7.0 at rest to around 6.5 after an all-out effort of 1–2 minutes. This fall in pH is called acidosis.
Acidosis is proposed to contribute to fatigue in three ways:
It inhibits enzymes. Phosphofructokinase (PFK), a key enzyme of glycolysis, works more slowly at low pH, which slows ATP resynthesis by the glycolytic system.
It interferes with calcium. H⁺ competes with Ca²⁺ for binding sites, including those on troponin, so more calcium is needed to move tropomyosin and expose the binding sites on actin.
It increases the sense of discomfort. H⁺ stimulates sensory nerve endings in the muscle, which adds to perceived effort and central fatigue.
Acidosis was long thought to be the main cause of fatigue. Experiments on isolated muscle fibres since the 1990s have shown that, at normal body temperature, the direct effect of low pH on force is smaller than was believed from earlier experiments at cooler temperatures. Acidosis contributes, especially in efforts of 30 seconds to a few minutes, but it is now seen as one cause among several.
Accumulation of inorganic phosphate
Inorganic phosphate (Pi) is released when ATP is broken down to ADP and when phosphocreatine is broken down to resynthesise ATP. In high-intensity exercise, PC falls rapidly and Pi rises in proportion: its concentration in the muscle can increase several times over within a minute of maximal work.
Pi reduces force in two ways. At the cross-bridge, a high Pi concentration slows the step in which the myosin head moves into its strongly bound, force-producing state, so fewer cross-bridges produce force at any instant. In the sarcoplasmic reticulum, Pi can enter and combine with calcium, forming calcium phosphate, which leaves less free Ca²⁺ to be released with each action potential. Studies on isolated fibres show that these effects are large enough to explain much of the force loss in intense exercise, which is why Pi is now considered a major cause of fatigue in high-intensity exercise.
PC depletion and Pi accumulation result from the same reaction. In a 400 m race, for example, the phosphagen system is used heavily in the first 100–150 m, so PC is low and Pi is high by the final straight, while H⁺ is also accumulating from glycolysis. Several causes of fatigue are therefore acting at once, which is typical of real sport.
Calcium handling
Many of these mechanisms meet at the same step: the release of calcium from the sarcoplasmic reticulum and its binding to troponin. Weaker action potentials, Pi, low glycogen and, in prolonged exercise, reactive oxygen species all reduce calcium release or calcium sensitivity, so impaired calcium handling is a common final pathway in peripheral fatigue.
Sources: Allen, Lamb and Westerblad, Physiological Reviews, 2008; Noakes, Frontiers in Physiology, 2012.
Dehydration and hyperthermia
In prolonged exercise, especially in hot or humid conditions, two linked problems develop: the body loses water faster than it is replaced, and it gains heat faster than it can lose it. Both place extra strain on the cardiovascular system, and both reduce performance well before they become dangerous to health.
How dehydration affects the cardiovascular system
Sweating is the main way the body loses heat during exercise, and sweat comes from the plasma. Dehydration, a fall in total body water, therefore reduces plasma volume. With less blood in circulation, less blood returns to the heart, the ventricles fill less, and stroke volume falls. To keep cardiac output up, heart rate rises. This gradual rise in heart rate during prolonged exercise at a constant intensity is called cardiovascular drift.
Once heart rate approaches its maximum, cardiac output can no longer be maintained. The cardiovascular system then has to share a limited cardiac output between the working muscles, which need oxygen, and the skin, which needs blood flow to lose heat. Less oxygen reaches the muscles, more glycogen is used, and the athlete must slow down. Endurance performance in warm conditions is typically impaired once water loss exceeds about 2% of body mass, although the size of the effect varies between individuals.
How hyperthermia causes fatigue
Hyperthermia is a raised core temperature caused by heat production and heat gain exceeding heat loss. During exercise, about three quarters of the energy released in the muscles appears as heat. In a hot, humid environment, sweat evaporates poorly, so heat is stored and core temperature rises steadily.
Hyperthermia contributes to fatigue in several ways. More cardiac output goes to the skin, which reduces venous return and adds to the fall in stroke volume. Heart rate rises towards its maximum at a lower work rate. Muscle temperature rises and glycogen is used faster. Most importantly, a high brain temperature reduces the drive from the motor cortex, which is a form of central fatigue. Athletes in the heat report a much higher rating of perceived exertion at the same pace.
In a laboratory study in 40 °C heat, trained cyclists who started exercise precooled, at normal temperature or prewarmed all stopped at almost the same core temperature, about 40 °C, so those who started warmer reached the limit sooner. This finding suggests that a critical core temperature of about 40 °C limits exercise in uncompensable heat, in which the body cannot lose heat as fast as it gains it.
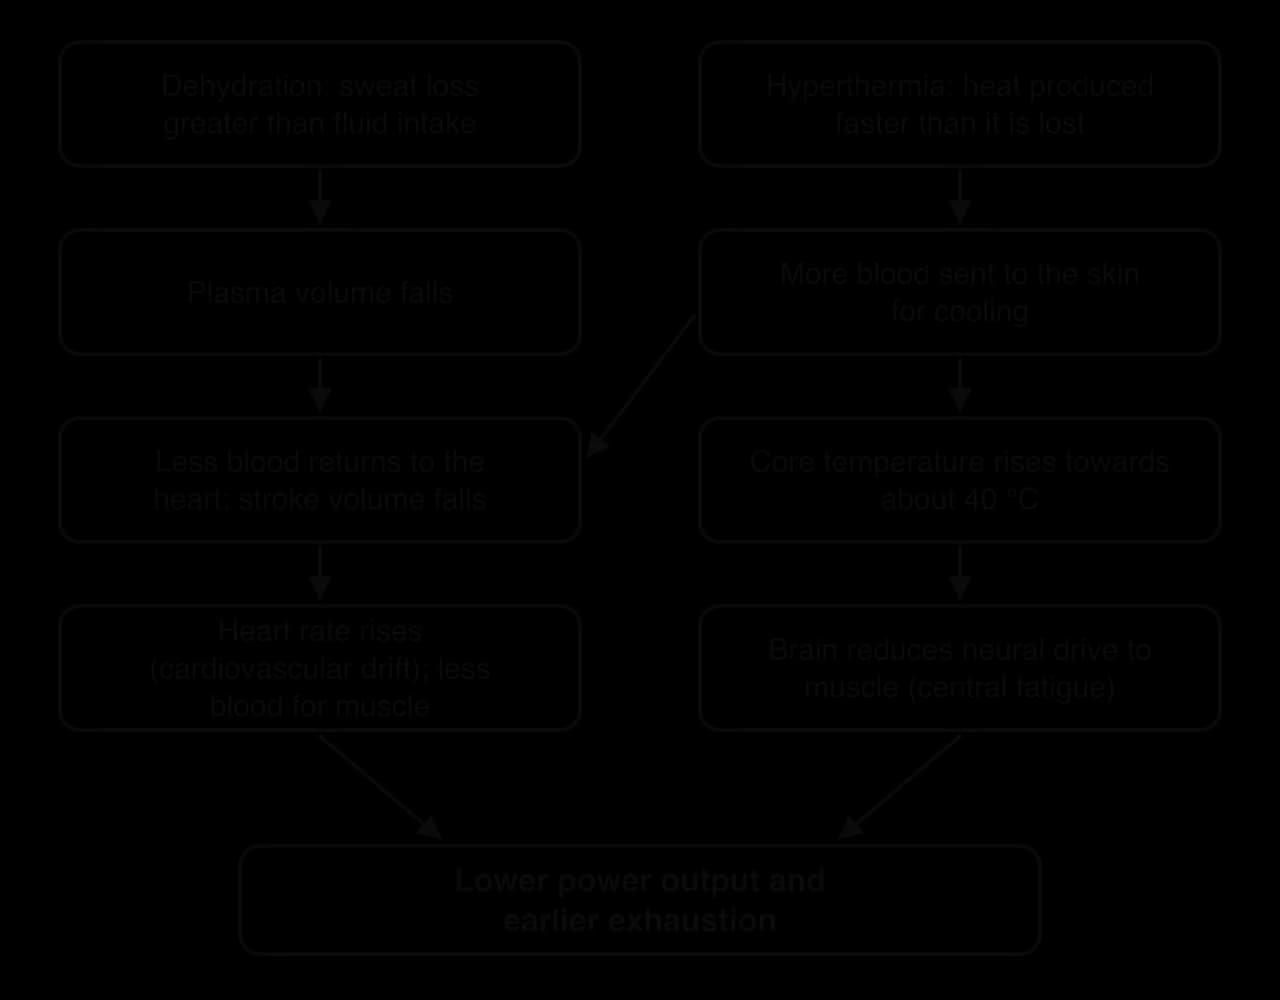
The two pathways reinforce each other. Dehydration lowers sweat rate and skin blood flow, so heat is lost more slowly and core temperature rises faster; a higher core temperature in turn increases sweating and fluid loss. Heat illness is a health risk as well as a performance limit, and the strategies that reduce it, such as drinking to limit fluid loss and heat acclimatisation, also delay fatigue. Precooling with ice slurry drinks or cooling vests before an event in the heat works on the same principle: it lowers starting core temperature, so the critical temperature is reached later.
Sources: González-Alonso et al., Journal of Applied Physiology, 1999.
Which causes of fatigue dominate in which activity
The causes of fatigue differ with the intensity and duration of an activity and with the environment. Knowing which causes dominate allows a coach to choose the right preparation, pacing, fuelling and recovery.
Activity | Main energy system(s) | Dominant causes of fatigue | Practical implication |
|---|---|---|---|
100 m sprint (about 10 s) | Phosphagen, with glycolytic | PC depletion; Pi accumulation; some central fatigue in the final metres | Full recovery (about 3 min or more) between maximal repetitions in training |
400 m (about 45–60 s) | Glycolytic and phosphagen, with oxidative | Pi accumulation, acidosis (H⁺), K⁺ loss reducing excitability; PC very low | Pacing strategy to avoid starting too fast; buffering capacity improved by training |
5,000 m (about 13–20 min) | Oxidative, with glycolytic | Acidosis and Pi in surges and the final kilometre; ionic changes; rising perceived effort | Training to raise the lactate inflection point; even pacing |
Marathon (2–5 h) | Oxidative | Muscle glycogen depletion; liver glycogen depletion and hypoglycaemia; dehydration and hyperthermia; central fatigue | Carbohydrate loading, carbohydrate during the race, drinking plan |
Team sport match (e.g. football, 90 min) | All three, switching constantly | Short-term: PC depletion and Pi after repeated sprints; long-term: glycogen depletion in type II fibres, dehydration; central fatigue late in the match | Substitutions, carbohydrate at half-time, recovery between matches |
Any prolonged event in heat and humidity | Mainly oxidative | Hyperthermia (core temperature near 40 °C), dehydration and cardiovascular drift, central fatigue | Heat acclimatisation, precooling, fluid and sodium, adjusted pacing |
The table shows a general rule. The shorter and more intense the activity, the more fatigue is caused by local metabolic changes in the muscle (PC depletion, Pi, H⁺, K⁺). The longer the activity, the more fatigue depends on fuel stores, fluid balance, temperature and the brain. Team sports combine both, which is why players show temporary fatigue after an intense passage of play and a gradual decline in sprinting late in a match.
Recovery from exercise
Recovery is the return of the body’s systems to their pre-exercise state after exercise, together with the adaptations that follow. It happens on several time scales: within seconds between sprints (PC resynthesis), within minutes and hours after a session (oxygen consumption, heart rate, lactate, fluid and glycogen) and over days after heavy or unfamiliar training (repair of muscle damage).
Recovery links with several ideas from other parts of the course. Immediately after exercise, oxygen consumption stays above resting levels during excess post-exercise oxygen consumption (EPOC), which supports PC resynthesis and lactate removal. Over days and weeks, recovery is one of the training principles: training causes temporary fatigue, and adaptation happens during recovery, which is the basis of supercompensation. When training load repeatedly exceeds recovery, functional overreaching can turn into non-functional overreaching or the overtraining syndrome.
Signs of recovery
Coaches and sports scientists judge recovery with three kinds of indicator: physiological markers measured in the body, symptoms the athlete feels, and psychological readiness. No single indicator is reliable on its own, so monitoring systems combine several.
Physiological indicators
Blood lactate concentration. After high-intensity exercise, blood lactate can be over 10 mmol L⁻¹. It falls back towards its resting value of about 1 mmol L⁻¹ over roughly 30–60 minutes as lactate is oxidised by the heart and muscles or converted to glucose in the liver. A falling blood lactate is a sign of short-term recovery; lactate clearance is faster with light activity than with complete rest.
Heart rate. Heart rate falls quickly in the first minute after exercise and then more slowly. A faster fall in heart rate, and a resting heart rate on waking that is back to its normal value, indicate recovery. A morning heart rate several beats per minute above normal can indicate incomplete recovery, illness or dehydration.
Heart rate variability (HRV). The variation in the time between successive heartbeats, which reflects the activity of the autonomic nervous system.
Creatine kinase (CK). An enzyme that leaks from damaged muscle fibres into the blood, so its concentration indicates muscle damage.
Performance tests. A countermovement jump, a short sprint or a grip strength test, repeated regularly, shows whether neuromuscular function has returned to normal.
The heart does not beat like a metronome. At rest, the interval between beats varies by tens of milliseconds, mainly because the parasympathetic nervous system (the vagus nerve) slows the heart slightly with each breath out. When the body is stressed by hard training, poor sleep, illness or anxiety, sympathetic nervous system activity rises, parasympathetic activity falls, and the beat-to-beat variation decreases. A fall in resting HRV below an athlete’s normal range is therefore used as a sign that recovery is incomplete.
HRV is usually measured for a minute or more on waking, lying or sitting, with a chest strap or a smartphone camera, and reported as RMSSD (the root mean square of successive differences between beats, in milliseconds). Because HRV varies greatly between people and from day to day, it is compared with the individual’s own rolling average, not with other athletes.
Blood CK concentration rises after unaccustomed, eccentric or very long exercise, often peaking 1–4 days later, and falls as the muscle repairs. CK has clear limits as a recovery marker: it varies enormously between individuals, some people show large rises after modest exercise (“high responders”), it requires a blood sample, and it does not closely match muscle function or soreness. It is useful for following one athlete over time, not for comparing athletes.
Symptomatic indicators: muscle soreness
The most familiar symptom of incomplete recovery is muscle soreness. Soreness felt during or immediately after intense exercise disappears within hours. Delayed-onset muscle soreness (DOMS) is different: it appears the day after unaccustomed exercise and is worst one to three days later.
DOMS is caused by exercise-induced muscle damage. Eccentric contractions, in which a muscle produces force while lengthening, cause the most damage: running downhill, lowering weights slowly, landing from jumps and the deceleration movements of team sports. Some sarcomeres are overstretched, Z discs are disrupted and the membranes of the fibres are damaged. Over the following hours, inflammation develops: immune cells enter the muscle, fluid accumulates and chemicals that sensitise pain receptors are released. The soreness is caused by this inflammation and sensitisation, not by lactate, which has been cleared long before DOMS begins.
The sketch shows why soreness is a useful but imperfect sign of recovery. Strength may be reduced for several days, even after soreness has eased, and soreness does not always mean damage is severe. A useful feature of DOMS is the repeated bout effect: after one bout of unaccustomed eccentric exercise, the same exercise a week or two later causes much less damage and soreness. This explains why sessions of a new type are introduced gradually at the start of a season or an exercise programme.
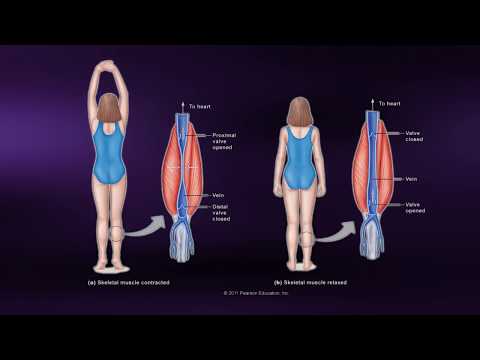 YouTube
Psychological indicators
An athlete who is recovered feels ready for the next session or competition: motivated, alert, in a stable mood and confident. Psychological indicators are often the first to change when recovery is incomplete. Low motivation, irritability, poor concentration, disturbed sleep and a feeling of heavy legs are typical early warning signs of non-functional overreaching.
These indicators are measured with questionnaires. Short daily wellness questionnaires ask the athlete to rate fatigue, sleep quality, muscle soreness, stress and mood, usually on a 1–5 or 1–10 scale. Longer validated questionnaires include the Profile of Mood States (POMS), which measures vigour, fatigue, tension, depression, anger and confusion, and the Recovery–Stress Questionnaire for Athletes (RESTQ-Sport). The rating of perceived exertion for a standard warm-up can also be compared with its usual value.
Type of indicator | Example | How it is measured | Strength | Limitation |
|---|---|---|---|---|
Physiological | Blood lactate falls | Finger-prick or earlobe blood sample, portable analyser | Objective; shows short-term recovery | Invasive; recovers within an hour so says little about next-day readiness |
Physiological | Heart rate and HRV return to baseline | Chest strap, wearable or smartphone on waking | Non-invasive, daily, sensitive to overall stress | Large individual and day-to-day variation; affected by sleep, illness, alcohol |
Physiological | Creatine kinase returns to baseline | Blood sample | Indicates muscle damage | Huge variation between people; poorly linked to function |
Symptomatic | Less muscle soreness (DOMS) | Rating scale or pressure on the muscle | Simple, meaningful to the athlete | Subjective; soreness eases before strength returns |
Psychological | Improved readiness, mood and motivation | Wellness questionnaire, POMS, RESTQ-Sport | Sensitive early warning of overreaching | Self-report bias; questionnaire fatigue |
Nutritional strategies for recovery
What an athlete eats and drinks after exercise affects how quickly fluid balance is restored, glycogen is replaced and muscle is repaired. The best strategy depends on the activity goal and, above all, on how soon the next session or competition will be. An athlete with two sessions in one day needs a much more deliberate plan than someone who trains once every two days.
Water and sodium
After exercise, an athlete’s loss of body mass is almost entirely water lost in sweat and breath, so 1 kg of mass lost is about 1 L of fluid. Rehydration aims to replace this loss before the next session. Two findings guide it. First, the athlete must drink more than they have lost, because urine production continues during recovery: guidelines usually recommend about 125–150% of the fluid lost, consumed over the hours after exercise. Second, the drink or the food eaten with it must contain sodium, because sodium keeps the drink in the extracellular fluid and reduces urine production.
A study of twelve men dehydrated by 2% of body mass showed both effects. They drank volumes equal to 50%, 100%, 150% or 200% of the mass lost, with a low-sodium or a higher-sodium drink. Only drinking more than the volume lost restored fluid balance, and the larger volumes were retained only when the drink contained enough sodium; with the low-sodium drink, extra volume was mostly lost as urine.
Evaluation. Rehydration with water and sodium is cheap, safe and strongly supported by controlled laboratory studies, so it is one of the most reliable recovery strategies.
Its importance depends on the situation: it is essential when a second session follows within a few hours or when sweat losses are large (heat, long sessions, heavy sweaters), and much less important when the next session is a day later and the athlete eats and drinks normally. Drinking far more than the loss, especially plain water, carries a risk of hyponatraemia. A practical judgment is that every athlete should know their typical sweat loss by weighing before and after training, and plan to replace it with sodium-containing fluid when recovery time is short.
Macronutrients: carbohydrate and protein
Carbohydrate for glycogen resynthesis
Muscle glycogen is resynthesised from carbohydrate eaten after exercise. The rate of resynthesis is highest in the first few hours, because exercise increases the uptake of glucose by the muscle and activates the enzyme that builds glycogen. When rapid restoration is needed, sports nutrition position stands recommend about 1.0–1.2 g of carbohydrate per kg of body mass per hour for the first four hours after exercise, preferably from foods with a high glycaemic index, taken as frequent snacks or drinks. Full restoration of muscle glycogen after it has been depleted usually takes about 24 hours with a high daily carbohydrate intake.
Protein for muscle repair
Protein provides the amino acids needed to repair damaged muscle fibres and to build new contractile proteins. Exercise, especially resistance exercise, stimulates muscle protein synthesis, and eating protein increases it further. The two effects add together, so protein after training supports both repair and adaptation.
The International Society of Sports Nutrition recommends a dose of about 20–40 g of high-quality protein (about 0.25–0.40 g per kg of body mass) every 3–4 hours across the day, including soon after training. Protein sources rich in the amino acid leucine, such as milk, whey, eggs, meat and fish, stimulate muscle protein synthesis most. About 30–40 g of slowly digested casein protein before sleep increases muscle protein synthesis overnight. The total daily intake recommended for most athletes is about 1.4–2.0 g kg⁻¹ day⁻¹.
Co-ingestion and the activity goal
Eating carbohydrate and protein together after exercise is called co-ingestion. When carbohydrate intake is below the optimal rate, adding protein can increase glycogen resynthesis; when carbohydrate intake is already high, protein adds little to glycogen storage but still supports muscle repair. A glass of chocolate milk or a meal of rice with chicken is a practical way to provide both.
Activity goal | Recovery priority | Practical recovery nutrition |
|---|---|---|
Endurance athlete with two sessions a day | Rapid glycogen restoration and rehydration | 1.0–1.2 g kg⁻¹ h⁻¹ carbohydrate for 4 h, 20–40 g protein, 125–150% of fluid lost with sodium |
Strength or power athlete | Muscle repair and growth | 20–40 g protein within a couple of hours, then every 3–4 h; moderate carbohydrate; casein before sleep |
Team sport player in a tournament (several matches in a few days) | Glycogen, fluid and repair between matches | Carbohydrate and protein together immediately after each match; fluid and sodium; regular meals |
Recreational exerciser aiming to lose body fat | Normal meals; energy balance | No special recovery products needed; a normal meal with protein and vegetables; water |
Evaluation. The evidence that carbohydrate restores muscle glycogen is strong: it comes from muscle biopsy studies over more than fifty years. Precise timing, however, matters mainly when recovery time is short (under about 8 hours); with 24 hours or more, total daily carbohydrate intake is more important than eating immediately.
Some endurance athletes deliberately recover with low carbohydrate before selected easy sessions (“train low”) to increase training adaptations, so the right strategy depends on whether the next session is for performance or for adaptation. The evidence for protein is also strong for muscle protein synthesis, but most studies measure synthesis over a few hours in young men, and long-term gains in strength depend more on total daily protein and training. A reasoned judgment is that carbohydrate timing is essential for athletes with a quick turnaround, protein after training is useful for everyone in hard training, and recreational exercisers can meet their needs with normal meals.
Creatine monohydrate
Creatine monohydrate is the most widely studied sports supplement. Creatine is made in the liver and kidneys and eaten in meat and fish; most of the body’s creatine is stored in muscle, about two thirds of it as phosphocreatine. Supplementation increases the creatine and PC content of muscle by about 20–40%, especially in people whose stores are low, such as vegetarians.
The usual methods are a loading phase of about 20 g a day (four doses of 5 g, or about 0.3 g kg⁻¹ day⁻¹) for 5–7 days, followed by a maintenance dose of 3–5 g a day, or a lower dose of about 3 g a day for four weeks, which reaches the same stores more slowly. Taking creatine with carbohydrate, or with carbohydrate and protein, increases its uptake into muscle. Once supplementation stops, stores return to normal in about 4–6 weeks.
Creatine supports recovery in several ways. Higher PC stores mean that PC is resynthesised to a higher level between repeated sprints, so repeated sprint performance falls less, which matters in team sports and interval training. Over weeks, athletes can complete more work in training, which increases gains in strength and lean mass. Some studies also show that creatine reduces markers of muscle damage and helps maintain performance during periods of very heavy training, and that taking it with carbohydrate increases glycogen storage.
Evaluation. The International Society of Sports Nutrition concludes that creatine monohydrate is the most effective nutritional supplement available for increasing high-intensity exercise capacity and lean mass, and that it is safe in healthy people at recommended doses. Its benefits are largest for repeated short, high-intensity efforts and much smaller for endurance events.
The main side effect is a gain in body mass of about 1–2 kg in the first week, mostly water held in the muscle, which is a disadvantage in weight-category sports, in running and in sports where the body must be lifted against gravity. Some people are non-responders, whose muscle stores are already high. As with any supplement, products can be contaminated with banned substances, so athletes subject to drug testing should use batch-tested products.
A reasonable judgment is that creatine is well supported for recovery between repeated sprints and for strength training, but it is of little value for a marathon runner and its mass gain must be weighed against its benefit.
Polyphenol-rich foods
Polyphenols are a large group of plant compounds that give fruits, vegetables, tea and cocoa much of their colour and taste. Rich sources include Montmorency tart cherries, blueberries, blackcurrants, pomegranate, cocoa and dark chocolate, and green tea. In the laboratory they act as antioxidants and anti-inflammatory compounds, so they have been proposed as a way to reduce the oxidative stress and inflammation that follow hard exercise and cause DOMS.
The best-known example is tart cherry juice. In a study of twenty recreational marathon runners, those who drank tart cherry juice for five days before, on the day of and for 48 hours after the race recovered their isometric strength faster and showed lower markers of inflammation than those given a placebo drink, although most markers of muscle damage did not differ. A 2021 meta-analysis of 14 studies found small benefits for muscle soreness and moderate benefits for the recovery of strength and power.
A review of fruit-derived polyphenols concluded that more than about 1,000 mg of polyphenols a day, for at least 3 days before and after exercise, is needed to improve recovery from muscle damage, which is roughly two servings of concentrated cherry juice a day.
Evaluation. The evidence for polyphenol-rich foods is promising but mixed. Many studies are small, use different products and doses, and measure different outcomes, and the certainty of the evidence in recent meta-analyses ranges from very low to moderate. A placebo drink that tastes and looks like the juice is difficult to make, so participants may be able to guess which drink they had.
There is also a possible cost: inflammation and reactive oxygen species are signals that drive training adaptation, and high doses of some antioxidants can blunt it. In one study of older men, supplements of the polyphenol resveratrol taken during a training programme blunted the improvements in cardiovascular health that training alone produced.
For these reasons, polyphenol-rich foods are best used selectively, when fast recovery matters more than adaptation (a tournament, a stage race, the days between competitions), rather than every day during training phases. As whole foods, berries and cherries are healthy anyway, so including them in a normal diet carries little risk.
Strategy | Proposed mechanism | Strength of evidence | Best used for | Main limitations |
|---|---|---|---|---|
Water and sodium (125–150% of fluid lost) | Restores plasma volume and total body water; sodium reduces urine loss | Strong (controlled laboratory trials) | Short turnaround; heavy sweat loss; heat | Overdrinking plain water risks hyponatraemia |
Carbohydrate (1.0–1.2 g kg⁻¹ h⁻¹ for 4 h) | Resynthesises muscle and liver glycogen | Strong (muscle biopsy studies) | Endurance and team-sport athletes with less than about 8 h to recover | Less important with 24 h or more; may reduce adaptation if always high |
Protein (about 0.25–0.40 g kg⁻¹, 20–40 g per meal) | Stimulates muscle protein synthesis for repair and adaptation | Strong for protein synthesis; moderate for long-term outcomes | All athletes in hard training, especially strength and power | Total daily intake matters more than exact timing |
Creatine monohydrate (loading then 3–5 g day⁻¹) | Raises muscle PC stores, faster PC resynthesis | Strong for repeated high-intensity exercise | Repeated sprints, strength training, team sports | Body mass gain; non-responders; contamination risk |
Polyphenol-rich foods (e.g. tart cherry, more than 1,000 mg polyphenols a day) | Antioxidant and anti-inflammatory effects | Mixed; small studies, low to moderate certainty | Competition periods needing fast recovery | May blunt training adaptation; hard to blind; product variation |
Taken together, the nutritional strategies with the strongest evidence are the simplest: replace fluid and sodium, eat enough carbohydrate for the next session, and spread protein across the day. Creatine monohydrate has strong evidence for one kind of athlete, and polyphenol-rich foods are a reasonable addition in competition periods but not a substitute for the basics.
Sources: Shirreffs et al., Medicine and Science in Sports and Exercise, 1996; Kerksick et al., Journal of the International Society of Sports Nutrition, 2017; Jäger et al., Journal of the International Society of Sports Nutrition, 2017; Kreider et al., Journal of the International Society of Sports Nutrition, 2017; Howatson et al., Scandinavian Journal of Medicine and Science in Sports, 2010; Hill et al., International Journal of Sport Nutrition and Exercise Metabolism, 2021; Bowtell and Kelly, Sports Medicine, 2019; Gliemann et al., Journal of Physiology, 2013.
Recovery techniques
Alongside nutrition and sleep, athletes use physical techniques to speed recovery: low-intensity exercise, massage and foam rolling, compression garments, and the application of heat or cold. Each has a proposed mechanism, a body of evidence of varying quality, practical costs, and a time in the training year when it is most useful. The popularity of several techniques has run ahead of the evidence for them.
Active recovery and massage
Active recovery is light exercise performed after a session or between bouts, such as an easy jog, swim or spin at a low intensity for 5–20 minutes. Compared with resting completely, it keeps blood flow through the muscles high, which speeds the removal of lactate and H⁺. It is cheap, needs no equipment and suits the gap between heats, rounds or matches on the same day. Its benefit for next-day performance is less clear, and when glycogen is low, extra exercise uses fuel the athlete needs to restore.
Massage involves a therapist applying pressure and kneading movements to the muscles. A 2018 meta-analysis of 99 studies of recovery techniques found that massage was the most effective technique for reducing DOMS and perceived fatigue, and that massage and cold exposure produced the largest falls in markers of inflammation. Its main limits are cost and access: it needs a trained therapist and time, so it is used mostly in elite and professional sport.
Myofascial release and foam rolling
Fascia is the sheet of connective tissue that surrounds and links muscles. Myofascial release applies sustained pressure to the muscle and its fascia, either by a therapist or by the athlete using a foam roller, a roller stick or a massage ball.
When athletes apply the pressure themselves it is called self-myofascial release. The most common form is foam rolling, in which the athlete rolls slowly along the length of a muscle on a cylinder of firm foam.
The proposed mechanisms are an increase in local blood flow, a reduction in muscle stiffness, and, probably most important, changes in how the nervous system processes pain and stretch signals from the muscle. The pressures used are far too small to physically reshape fascia, so explanations about “breaking up knots” are not supported.
A meta-analysis of 21 studies compared foam rolling before exercise (as part of a warm-up) and after exercise (for recovery). Rolling before exercise produced a small improvement in sprint performance (+0.7%) and flexibility (+4.0%). Rolling after exercise slightly reduced the fall in sprint (+3.1%) and strength performance (+3.9%) and reduced the perception of muscle pain (+6.0%). The authors judged the effects to be rather minor and concluded that the evidence better justifies foam rolling as part of a warm-up than as a recovery tool.
Evaluation. Foam rolling is cheap, portable and self-administered, so it can be used daily by recreational exercisers and athletes alike, and it carries little risk. Its benefits for recovery are small and partly based on perception, which is difficult to blind: participants know whether they have rolled. It is most useful for reducing the sensation of soreness and maintaining range of motion between sessions. It should not replace sleep and nutrition, but as a quick, low-cost addition its use is reasonable.
Compression garments
Compression garments are tight-fitting clothes, such as tights, socks, sleeves and tops, that apply graduated pressure to the limbs, usually highest at the ankle or wrist and decreasing towards the body. They are worn during exercise, after it and while travelling.
The proposed mechanisms are that external pressure reduces the space available for swelling in damaged muscle, helps venous return so that metabolites are removed faster, and reduces the vibration of muscles during exercise, which may limit damage. A meta-analysis of 23 studies found small, very likely benefits of compression on the recovery of strength, power and endurance. The largest benefits were for strength recovery between 2 and 8 hours and after more than 24 hours, especially after resistance exercise, and compression was also recommended to improve next-day cycling performance.
Evaluation. Compression garments are relatively cheap, easy to use and can be worn for many hours, including on long journeys, where they also reduce swelling in the legs. The benefits are small, and many studies did not measure the pressure applied, so the “dose” needed is unclear; off-the-shelf garments may apply too little pressure on some people. Like other techniques, they are hard to blind. Their use is reasonable after strength sessions, between closely spaced matches and during travel, where the cost is low and the evidence, while modest, is consistent.
Thermotherapy and cold-water immersion
Heat and cold have opposite effects on the blood vessels and tissues, and both are used for recovery. Thermotherapy uses heat. Cold is used for recovery mainly as cold-water immersion; ice packs and other forms of cryotherapy are used mainly to treat acute injuries. Contrast water therapy alternates between heat and cold.
Thermotherapy (heat therapy)
Heat causes vasodilation, increasing blood flow through the muscle, which may deliver nutrients and remove metabolites faster. It also makes connective tissue more extensible and reduces pain. A 2021 meta-analysis of 32 randomised controlled trials found that heat treatment reduced DOMS pain both within 24 hours and after 24 hours, with hot packs showing the largest effect, while cold therapy reduced pain only within the first 24 hours.
Evaluation. Heat is cheap and comfortable, and it may help with soreness and stiffness in the days after hard training. It is not suitable straight after an acute injury, when vasodilation would increase swelling, nor after exercise in hot conditions, when the athlete needs to lose heat. The number of high-quality studies is small, and most measure perceived pain rather than performance. Heat is a sensible option for soreness and stiffness more than a day after training, rather than immediately after competition.
Cold-water immersion
Cold causes vasoconstriction, reducing blood flow, swelling and the inflammatory response in damaged muscle. It slows nerve conduction, which reduces pain, and it lowers core temperature, which helps after exercise in the heat. Water also presses on the body (hydrostatic pressure), which may help fluid move from the tissues back into the blood. Whole-body cryotherapy chambers, which expose the body to very cold air for a few minutes, are an expensive and less studied alternative.
An umbrella review of 15 meta-analyses, covering 161 studies, found that cold-water immersion reduced muscle soreness for up to 96 hours, lowered creatine kinase between 24 and 72 hours and improved muscular power and jump performance 24–48 hours after intense or eccentric exercise. Jump performance was impaired in the first hours after immersion, because cold muscles produce force more slowly. Protocols of 10–15 minutes at about 10–15 °C appeared most effective. The overall certainty of the evidence was rated low to very low.
The most important finding concerns training adaptation. In a 12-week study, 21 physically active men did strength training twice a week, followed by either 10 minutes of cold-water immersion or 10 minutes of active recovery. The active recovery group gained more strength and muscle mass; type II fibre cross-sectional area and the number of nuclei per fibre increased in the active recovery group but not in the cold-water group. Muscle biopsies showed that cold blunted the signalling pathways and satellite cell activity that drive muscle growth. The umbrella review confirmed that regular cold-water immersion impairs strength and hypertrophy gains.
Contrast water therapy is used when athletes want some of the effects of cold without staying in cold water for long. The 2018 meta-analysis of recovery techniques found that it reduced DOMS, and a network meta-analysis ranked it second to hot packs for pain relief in the first 24 hours. The pumping mechanism has not been shown directly, and the best ratio and temperatures are uncertain.
Evaluation. Cold-water immersion is relatively cheap with a bath or an ice tub, and it is useful when the next performance matters more than long-term adaptation: between matches in a tournament, between stages of a cycling race, and after exercise in the heat, when lowering core temperature is itself valuable.
It is uncomfortable, carries a small risk of cold injury and cold shock, and its benefits for soreness are partly perceptual and hard to blind. Because it can blunt gains in strength and muscle size, it should not follow every resistance-training session during a phase aimed at building strength. The best judgment is to periodise it: use cold in competition phases and congested schedules, and avoid it after strength sessions in preparation phases.
Comparing recovery techniques
Technique | Proposed mechanism | Evidence | Practicality | When to use |
|---|---|---|---|---|
Active recovery | Maintains blood flow; faster removal of lactate and H⁺ | Good for lactate clearance; limited for next-day performance | Free; no equipment | Between heats, rounds and same-day matches |
Massage | Mechanical pressure; reduced inflammation; relaxation | Most effective technique for DOMS and perceived fatigue in a large meta-analysis | Expensive; needs a therapist | Elite settings; after competition |
Myofascial release (foam rolling) | Altered pain and stretch perception; reduced stiffness; blood flow | Small benefits for soreness, sprint and strength recovery | Cheap; self-administered | Daily; before training for range of motion |
Compression garments | Limits swelling; aids venous return; reduces muscle oscillation | Small but consistent benefits, especially strength at 2–8 h and >24 h | Moderate cost; worn for hours, including on journeys | After strength sessions; congested fixtures; travel |
Thermotherapy (heat) | Vasodilation; tissue extensibility; pain relief | Reduces DOMS pain, including beyond 24 h; few high-quality trials | Cheap (hot packs) to moderate (sauna) | For soreness 24 h or more after training; not after acute injury or in heat |
Cold-water immersion | Vasoconstriction; less swelling and inflammation; slower nerve conduction; lower core temperature | Reduces soreness and CK; restores power at 24–48 h; impairs strength and hypertrophy gains |
Several patterns appear across the table. Most techniques reduce the sensation of soreness more than they restore performance, and most of the research is short-term, involves young male participants and cannot be fully blinded. The effects are small compared with those of sleep, fuel and fluid. The overall judgment is that recovery techniques are useful additions when they match the situation: cheap techniques such as active recovery, foam rolling and compression can be used widely, while cold-water immersion is best kept for periods when performance in the next few days matters more than adaptation.
Sources: Dupuy et al., Frontiers in Physiology, 2018; Wiewelhove et al., Frontiers in Physiology, 2019; Brown et al., Sports Medicine, 2017; Wang et al., Physical Therapy in Sport, 2021; Wang et al., Journal of Rehabilitation Medicine, 2022; Roberts et al., Journal of Physiology, 2015; Berjisian et al., Sports Medicine – Open, 2026.
Sleep and recovery
Sleep is the most important recovery strategy available to athletes and the one most often neglected. It affects almost every system of the body, and the effects of losing it on performance are larger than the effects of most recovery products.
Sleep stages
Sleep is not a single state. A night of sleep consists of four or five cycles, each lasting about 90 minutes, through two kinds of sleep. Non-rapid eye movement (NREM) sleep has three stages: N1, the light transition from waking; N2, a deeper stage that makes up about half of the night; and N3, deep slow-wave sleep, when the brain’s electrical activity shows large, slow waves and the sleeper is hardest to wake. REM sleep (rapid eye movement sleep) follows, with fast brain activity, vivid dreams and the skeletal muscles temporarily relaxed.
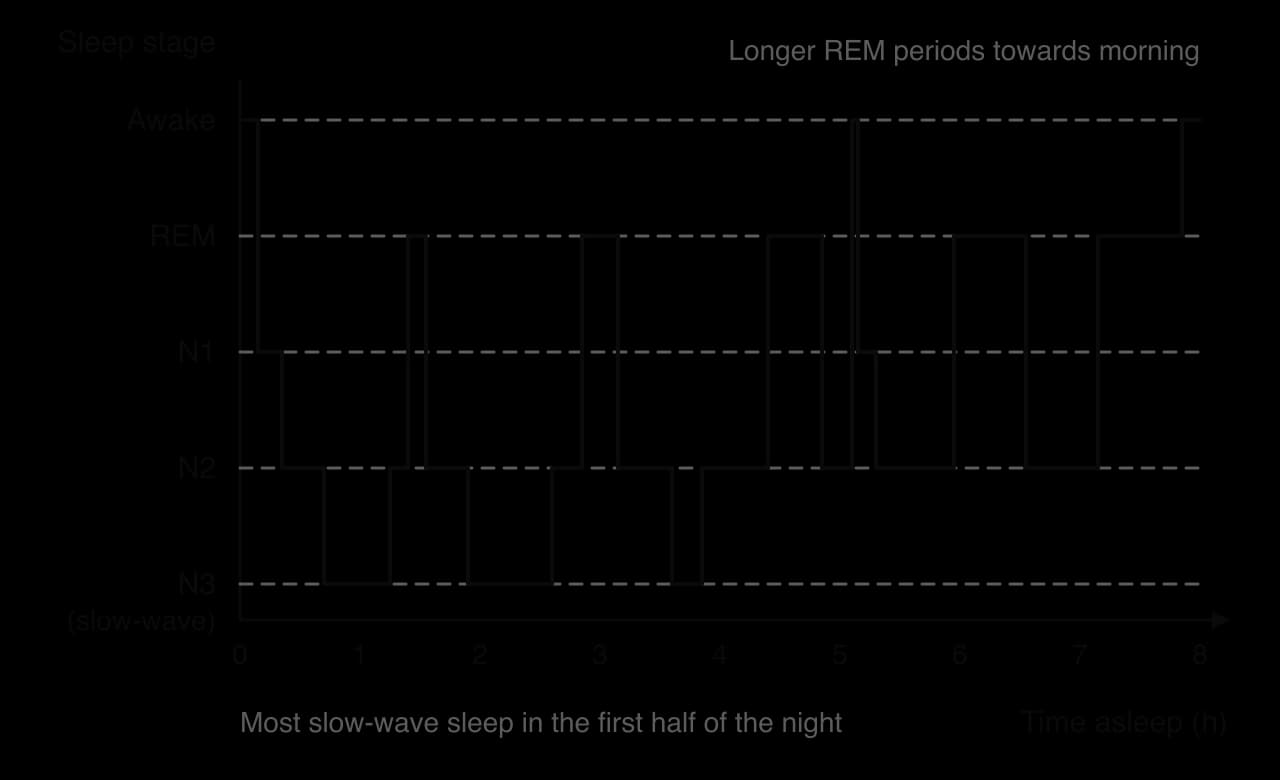
REM sleep is quite different from slow-wave sleep: the brain is highly active even though the body is still.
The stages have different roles in recovery. During slow-wave sleep, growth hormone is released in pulses from the pituitary gland; it stimulates protein synthesis and tissue repair and helps mobilise fat for energy. Slow-wave sleep is also when the parasympathetic nervous system dominates, heart rate is lowest and HRV is highest. REM sleep, together with N2, is associated with the consolidation of memories, including the consolidation of newly practised skills, which links sleep with motor learning.
How much sleep is needed
The US National Sleep Foundation recommends 7–9 hours of sleep a night for adults and 8–10 hours for teenagers aged 14–17. These are general recommendations for health. The amount an athlete needs beyond them depends on the training load: heavy training increases the need for tissue repair, glycogen restoration and nervous system recovery, so many athletes in heavy training benefit from sleeping at the upper end of the range or above it, including naps.
Athletes often sleep less well than the general population. When the sleep of 47 British Olympic athletes was measured with wrist-worn actigraphy, their total sleep time did not differ significantly from that of non-athletic controls, but their sleep efficiency (the percentage of time in bed actually spent asleep) was lower, 80.6% compared with 88.7%, and their sleep was more fragmented. Early morning training, evening competitions, travel, caffeine, nerves before competition and the pain of hard training all disturb sleep.
Effects of sleep loss on performance and health
Sleep loss reduces performance across almost every type of exercise. A 2022 meta-analysis of 69 studies found that sleep loss (6 hours or less in 24 hours) reduced exercise performance by about 7.6% on average, with negative effects for anaerobic power, speed, high-intensity intervals, strength, endurance and skill. The effect was larger the longer a person had been awake before the task: about 0.4% worse for every extra hour awake. Most participants (89%) were male, so the results may not apply equally to women.
Sleep loss affects performance through several of the mechanisms of fatigue. It raises perceived exertion at a given intensity, which contributes to central fatigue, slows reaction time and decision making, lowers mood and motivation, and may reduce glycogen restoration. For health, short sleep is associated with weaker immune function and more upper respiratory infections, with poorer regulation of blood glucose and appetite, with low mood and, in some observational studies of young athletes, with a higher risk of injury. Many of these links come from observational studies, so they show association rather than proof that short sleep is the cause.
Effect of poor or short sleep | Performance lens | Health lens |
|---|---|---|
Nervous system | Slower reaction time; poorer decisions and accuracy in skill tasks | Poorer concentration and learning at school or work |
Perceived effort and mood | Higher RPE at the same pace; lower motivation | Low mood, irritability, higher risk of anxiety and depression |
Repair and fuel | Less growth hormone release; possibly slower glycogen restoration | Poorer tissue repair; disturbed appetite and blood glucose regulation |
Immune system | More training days lost to illness | More upper respiratory infections |
Injury | Associated with higher injury risk in some studies of young athletes | Higher risk of accidents (for example, drowsy driving) |
Sleep hygiene and napping
Sleep hygiene is the set of habits and environmental conditions that help a person fall asleep easily and sleep well. It is the first strategy recommended to athletes with poor sleep.
Go to bed and wake up at about the same time every day, including at weekends.
Keep the bedroom cool, dark and quiet; use an eye mask and earplugs when travelling.
Avoid caffeine in the 6 hours before bed and avoid alcohol, which reduces REM sleep and sleep quality.
Reduce bright light and screen use in the hour before bed, because light, especially blue light, delays the release of melatonin.
Have a relaxing routine before bed (reading, a warm shower, relaxation or breathing techniques), and avoid heavy meals and intense exercise immediately before sleep.
Get out of bed if unable to sleep after about 20 minutes, and return when sleepy, so that the bed is associated with sleep.
Naps can make up for lost night-time sleep and add to the total for athletes in heavy training. A meta-analysis found that, after a normal night’s sleep, a daytime nap improved performance in a repeated shuttle-run test but had no clear effect on muscle force. Short naps of about 20–30 minutes in the early afternoon avoid waking from slow-wave sleep, which causes grogginess (sleep inertia); longer naps of about 90 minutes allow a whole sleep cycle. Late or long naps can make it harder to fall asleep at night.
Circadian rhythm and travel
Many body functions follow a circadian rhythm, a cycle of about 24 hours controlled by a “master clock” in the hypothalamus (the suprachiasmatic nucleus). Core temperature, alertness, hormone release and muscle strength all vary across the day; in most people, strength and power are highest in the late afternoon and early evening, when core temperature peaks. The main time-giver that keeps the clock in step with the day is light; meal times, exercise and social contact also contribute.
Melatonin is a hormone released by the pineal gland in the evening when it becomes dark; it promotes sleep. Light, especially bright and blue light, suppresses its release. Melatonin is one of the signals that link the body clock with the sleep–wake cycle, and synthetic melatonin can be used to shift the clock after travel.
Travel across time zones: jet lag
Jet lag occurs after rapid travel across three or more time zones. The body clock stays on home time for several days, so the athlete feels sleepy, hungry and alert at the wrong times, sleeps poorly, and may train or compete at a time when the body clock says it is the middle of the night. Symptoms include disturbed sleep, daytime fatigue, poor concentration, digestive problems and reduced performance.
The body clock adapts by only about 1–2 hours a day. A 2021 consensus statement on athletes’ travel gives a rule of thumb: about one day per time zone crossed after travelling east and about half a day per time zone after travelling west. Travelling east is harder because the athlete must fall asleep and wake earlier than the body clock expects (a phase advance), and the natural tendency of the human clock is to run slightly longer than 24 hours, which makes delaying easier than advancing.
The consensus statement recommends planning the journey carefully, maximising the rate at which the body clock adapts with timed periods of light exposure and light avoidance, preserving sleep, matching training with light exposure, adjusting meal times to the destination and making sensible use of melatonin at the destination. It also notes that the evidence on assessing and managing jet lag in athletes is limited, so its recommendations are based mainly on expert agreement and on laboratory studies.
Travel within time zones: travel fatigue
Long journeys disturb recovery even when no time zones are crossed. Travel fatigue is the general tiredness caused by the journey itself: early starts, long periods sitting in cramped seats, dry cabin air, mild hypoxia in aircraft, dehydration, disrupted meals and broken sleep. It is common in large countries where teams travel long distances for domestic matches, and in sports with frequent away fixtures.
Travel fatigue usually resolves after a night or two of good sleep, whereas jet lag lasts until the body clock has adjusted. Strategies include planning journeys to avoid very early starts, sleeping during travel where possible (eye mask, earplugs, neck pillow), drinking regularly, moving and stretching during long journeys, wearing compression garments, and keeping normal meal and sleep routines on arrival.
Evaluation: sleep as a recovery strategy
The evidence that sleep matters for recovery is strong and comes from many types of study: sleep deprivation experiments, observational studies of athletes and sleep extension trials. It is free, it has no side effects and its effects on performance are larger than those of most recovery techniques.
Its limitations lie in measurement and application. Polysomnography in a sleep laboratory is accurate but expensive and unfamiliar; wrist-worn actigraphy and consumer wearables are practical but less accurate at identifying sleep stages; and self-reported sleep is often overestimated. Individual differences are large, so “8 hours” suits some athletes but not others, and early training times or competitions are not always under the athlete’s control.
A reasoned judgment is that sleep should be the foundation of every recovery plan: athletes and coaches should protect sleep opportunity, especially during heavy training and travel, before spending money on supplements or techniques whose effects are much smaller. Monitoring sleep with simple diaries or wearables, together with HRV and wellness questionnaires, helps detect when training load has run ahead of recovery.
Case study: sleep extension in college basketball players
In 2011, researchers at Stanford University published a study of the effect of extra sleep on athletic performance. Eleven healthy players from the university’s men’s varsity basketball team, with a mean age of 19.4 years, took part. For the first 2–4 weeks they kept their normal sleep habits (the baseline period). For the following 5–7 weeks they extended their sleep, aiming to spend at least 10 hours in bed each night and to sleep as much as possible.
Sleep was measured objectively with wrist actigraphy and recorded in sleep diaries. After every practice, the players completed a timed 282-foot (about 86 m) sprint and shooting tests of free throws and three-point shots. Reaction time was measured with the psychomotor vigilance task, daytime sleepiness with the Epworth Sleepiness Scale and mood with the Profile of Mood States (POMS).
Measure | Result of sleep extension (compared with baseline) |
|---|---|
Total nightly sleep time (actigraphy) | Increased by 110.9 ± 79.7 minutes a night (P < 0.001) |
282-foot (86 m) timed sprint | 16.2 ± 0.61 s at baseline → 15.5 ± 0.54 s at the end (P < 0.001) |
Free throw percentage | Increased by 9 percentage points (P < 0.001) |
Three-point field goal percentage | Increased by 9.2 percentage points (P < 0.001) |
Reaction time (psychomotor vigilance task) | Faster (P < 0.01) |
Daytime sleepiness (Epworth Sleepiness Scale) | Lower (P < 0.01) |
Mood (POMS) | Vigour increased, fatigue decreased (P < 0.001) |
The players slept almost two hours more per night on average. Every performance measure improved, and the players also reported better physical and mental well-being during practices and games. The chart shows the change in sprint time.
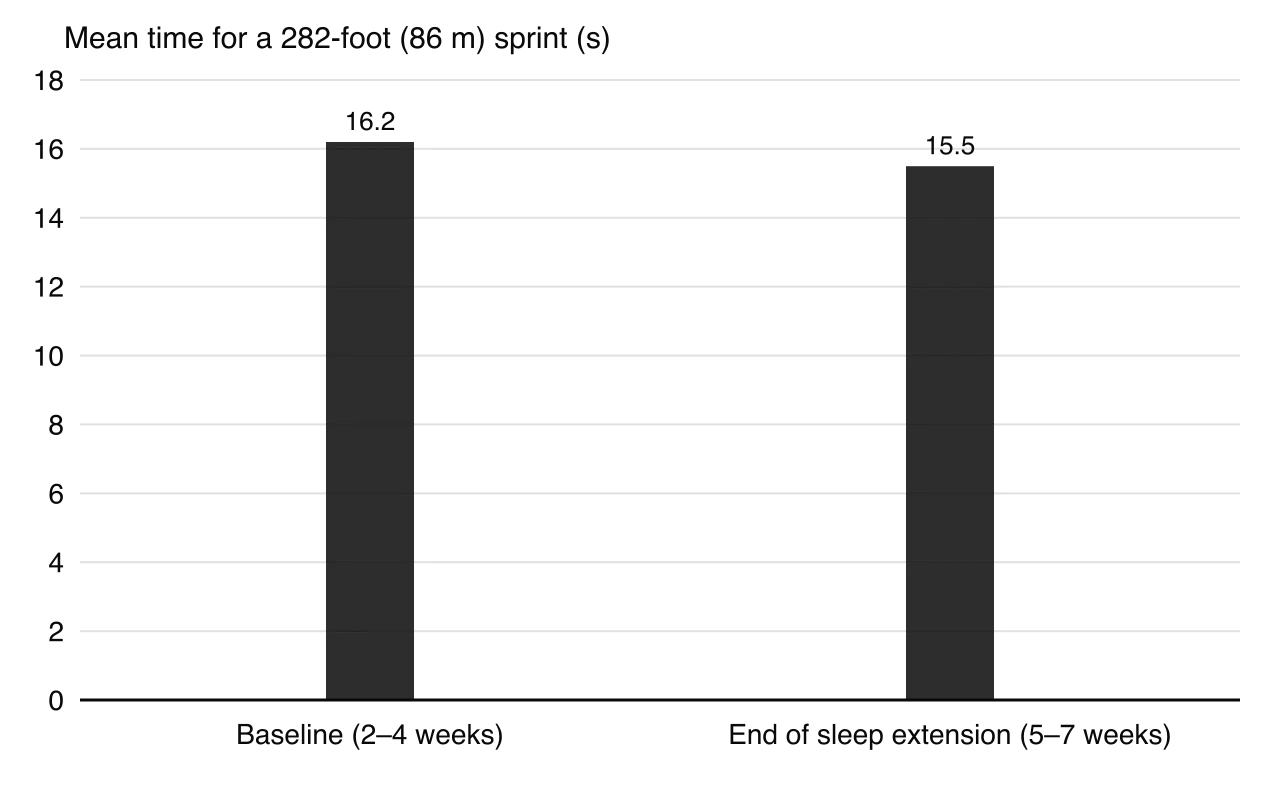
Several mechanisms of fatigue and recovery can explain the results. The players were probably carrying a chronic sleep debt at baseline, as many student athletes do. Extra sleep would increase slow-wave sleep and growth hormone release for tissue repair, restore the balance of the autonomic nervous system, and improve the functioning of the brain: faster reaction time and lower sleepiness point to reduced central fatigue, and better shooting accuracy is consistent with improved attention and fine motor control. The fall in POMS fatigue and rise in vigour suggest higher readiness and motivation, the psychological indicators of recovery.
The study has important limitations, which illustrate the nature of science in exercise research. There was no control group: every player extended their sleep, so improvements could also be explained by several more weeks of training and shooting practice, by changes in fitness or by the team’s schedule.
The sample was small, all male and from one team at one university, so the results may not generalise to women, to other sports or to athletes who already sleep well. The players knew the aim of the study, so expectations (a placebo effect) and increased motivation may have affected both their effort in the sprint and their self-reported mood. Shooting percentages from practice sessions are also influenced by many other factors.
Despite these limits, the findings agree with the wider evidence that sleep loss reduces performance and that sleep is a central part of recovery. The study shows how a small, practical field study can draw attention to an overlooked recovery strategy, and also why its conclusions need confirming with stronger designs, such as randomised trials with a control group or a cross-over design.
Using the data in the table, calculate the percentage improvement in sprint time, and comment on its size compared with the standard deviations.
Suggest how the study could be redesigned to separate the effect of extra sleep from the effect of several more weeks of training and practice.
To what extent could the improvements in shooting accuracy be explained by a reduction in central fatigue rather than by physical recovery?
How might motivation affect the relationship between fatigue and performance in this study?
Sources: Mah et al., Sleep, 2011; Hirshkowitz et al., Sleep Health, 2015; Leeder et al., Journal of Sports Sciences, 2012; Craven et al., Sports Medicine, 2022; Boukhris et al., Sports Medicine, 2024; Janse van Rensburg et al., Sports Medicine, 2021.
Exam practice
At HL, fatigue and recovery can appear in Paper 1A, Paper 1B and Paper 2. Paper 1A questions test the mechanisms of fatigue and the facts behind recovery strategies. Paper 1B uses data from fatigue and recovery studies: time to exhaustion, glycogen concentrations, soreness ratings, HRV. Paper 2 asks for explanations of fatigue mechanisms and, very often, extended responses that evaluate a recovery strategy.
Multiple-choice questions often include an option based on a common misconception, such as lactate causing fatigue or DOMS. Eliminate those first.
A second question tests a mechanism of peripheral fatigue.
A third question tests travel and the body clock.
Data-based question
Paper 1B: Seven trained cyclists exercised to exhaustion at 60% of VO₂ max in a laboratory at 40 °C. Before each trial they were immersed in water for 30 minutes to set their starting oesophageal (core) temperature at about 36 °C, 37 °C or 38 °C, in a random order. The mean (± standard error) times to exhaustion were 63 ± 3 min, 46 ± 3 min and 28 ± 2 min respectively. Core temperature at exhaustion was 40.1–40.2 °C in every condition, and heart rate at exhaustion was 196–198 beats min⁻¹.
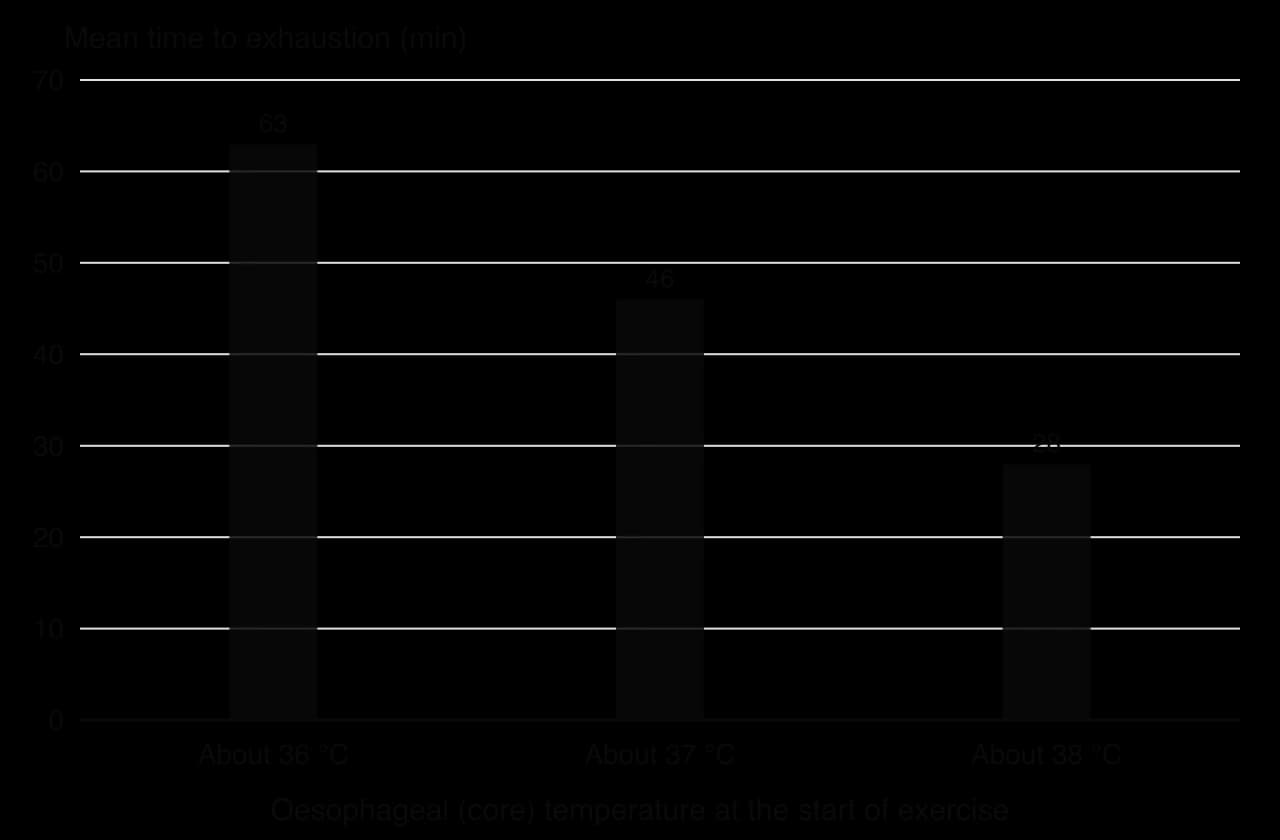
The questions use the data in the description and the chart.
Structured questions
Short structured questions on fatigue and recovery usually test definitions, the distinction between central and peripheral fatigue, one mechanism explained step by step, and calculations from recovery guidelines.
An explain question asks for a mechanism as a chain of causes.
A describe question on DOMS needs its cause and time course.
A calculate question uses a recovery guideline and needs units at every step.
Extended response
Extended responses on fatigue and recovery usually ask for an evaluation of a recovery strategy, or a discussion of several strategies for a named athlete. The answer needs the mechanism, evidence, what the outcome depends on and a justified conclusion.
Summary
Fatigue is a reduction in the force or power muscles can produce, or a rise in the effort needed to maintain it; it usually has several causes acting together.
Central fatigue arises in the brain and spinal cord (reduced neural drive); peripheral fatigue arises at or beyond the neuromuscular junction. The central governor model, which says the brain regulates exercise to protect homeostasis, is debated.
Phosphocreatine depletion limits maximal efforts of a few seconds; muscle and liver glycogen depletion and hypoglycaemia limit prolonged exercise (“hitting the wall”).
Potassium loss and sodium gain reduce the excitability of the sarcolemma; acidosis (H⁺) inhibits PFK and calcium binding; inorganic phosphate reduces cross-bridge force and calcium release. Lactate is not the cause of fatigue.
Dehydration and hyperthermia reduce plasma volume and stroke volume, raise heart rate (cardiovascular drift) and, near a core temperature of about 40 °C, reduce neural drive.
Signs of recovery are physiological (falling blood lactate, heart rate and HRV back to baseline, CK), symptomatic (less DOMS, which peaks at 24–72 hours after eccentric exercise) and psychological (readiness, mood, motivation).
Recovery nutrition: about 125–150% of fluid lost with sodium; 1.0–1.2 g kg⁻¹ h⁻¹ of carbohydrate for 4 hours when recovery time is short; 20–40 g of protein per meal; creatine monohydrate for repeated high-intensity exercise; polyphenol-rich foods with mixed evidence.
Foam rolling and compression garments give small benefits; heat reduces DOMS pain; cold-water immersion aids short-term recovery but can blunt strength and hypertrophy gains, so it should be periodised.
Sleep (7–9 hours for adults, 8–10 for teenagers, more with heavy training) is the foundation of recovery; sleep loss reduces performance by about 7–8% on average.
Jet lag after crossing three or more time zones takes about one day per zone to resolve going east and half a day going west; travel fatigue comes from the journey itself.
Self-check
- To do:
I can define fatigue and distinguish between central and peripheral fatigue.
- To do:
I can draw the fatigue pathway from the brain to the cross-bridge and mark where each cause acts.
- To do:
I can explain how phosphocreatine depletion, glycogen depletion and hypoglycaemia cause fatigue.
- To do:
I can explain how sodium and potassium ions, acidosis and inorganic phosphate reduce force.
- To do:
I can explain how dehydration and hyperthermia impair performance through the cardiovascular system and the brain.
- To do:
I can identify the dominant causes of fatigue in a named activity and environment.
- To do:
I can describe physiological, symptomatic and psychological signs of recovery and how each is measured.
- To do:
I can evaluate water and sodium, carbohydrate, protein, creatine monohydrate and polyphenol-rich foods as recovery strategies, and calculate intakes from guidelines.
- To do:
I can evaluate foam rolling, compression garments, thermotherapy and cold-water immersion, and say when each should be used.
- To do:
I can evaluate sleep as a recovery strategy and suggest how to manage jet lag and travel fatigue.