 YouTube
Read, sketch and build Voronoi diagrams, find the equations of edges and the coordinates of vertices, calculate cell areas, add a new site, estimate values by nearest neighbour interpolation and solve the toxic waste dump problem.
Each is in the Maths AI glossary, with every other term in the subject.
A finite sequence of precisely stated steps that solves a problem or carries out a task, and that can be followed mechanically.
The region of a Voronoi diagram that contains one site and every point that is closer to that site than to any other site.
The division of the region between a set of sites into triangles, formed by joining every two sites whose Voronoi cells share an edge.
A boundary between two neighbouring cells of a Voronoi diagram; it is a line segment or ray lying on the perpendicular bisector of the two sites whose cells it separates.
The length of the straight line segment joining two points, calculated in two dimensions as
State the meaning of a site, a cell, an edge and a vertex in a Voronoi diagram, and identify the site closest to a given point.
Explain why every edge of a Voronoi diagram lies on a perpendicular bisector and why every vertex is equidistant from three or more sites.
Sketch a Voronoi diagram for a small set of sites, using symmetry where it helps.
Find the equation of an edge from the coordinates of two sites, and find the coordinates of a vertex by intersecting edges, using technology where appropriate.
Calculate the area of a cell by splitting it into triangles, rectangles and trapezoids, and interpret cell areas in context.
Determine the new cell and the changed edges when a site is added to an existing Voronoi diagram.
Estimate the value of a quantity at a point by nearest neighbour interpolation.
Solve the toxic waste dump problem by comparing the distances from the vertices to their nearest sites, and justify the choice.
Comment on the assumptions and limitations of a Voronoi diagram used as a model of a real situation.
Many everyday decisions come down to the question "which one is closest?": the nearest hospital, the nearest phone mast, the nearest supermarket or the nearest weather station. A Voronoi diagram gives the answer for every point of a map at once. It divides the map into regions, one around each given point, so that everything inside a region is closer to that region's point than to any other. Planners use these diagrams to set the catchment areas of schools and fire stations, meteorologists use them to spread rain-gauge readings over an area, and epidemiologists use them to link cases of a disease to their likely source.
36 exam-style questions on this subtopic, written in the style of the IB papers. The first has its markscheme open. Counted on
A telecommunications company has three mobile phone masts at A, B and C, where distances are measured in kilometres.
The entries of the mathematics: applications and interpretation formula booklet that 3.6 uses. Each opens in the explained booklet.
With a free account, Augment remembers where you stopped and what you have practiced.
A method of constructing a Voronoi diagram by adding the sites one at a time, updating the existing diagram after each new site is added.
The largest circle, centred inside a given region, that has no site inside it; its centre solves the toxic waste dump problem and its radius is the distance from that centre to the nearest site.
Estimating the value of a quantity at a point by the value measured at the nearest site, so that every point in a Voronoi cell is given the value of that cell's site.
One of the given points around which a Voronoi diagram is built, such as a town, a shop, a phone mast or a weather station.
The problem of finding the point in a given region whose distance to the nearest site is as large as possible.
A point where three or more edges of a Voronoi diagram meet; it is equidistant from the three or more sites whose cells meet there.
A division of a plane, or of a region of it, into cells, one for each of a given set of sites, in which every point of a cell is closer to that cell's site than to any other site.
The mathematics behind a Voronoi diagram is mostly familiar: midpoints, gradients, perpendicular lines, distances and areas. What is new is the way these ideas fit together into a single picture of space, and the questions that picture makes it possible to answer: where a boundary runs, which region a point belongs to, how much land a new site takes from its neighbours, and where a facility should go to stay as far as possible from everyone.
YouTubeA Voronoi diagram depends on how distance is measured. Unless a question says otherwise, distance means the length of the straight line between two points, found with Pythagoras' theorem. For points and it is given by the distance formula from prior learning.
Euclidean distance is a modelling choice. A driver cannot always travel in a straight line, and a city grid of streets makes the real travel distance longer than the straight-line distance. Using it anyway keeps the mathematics simple, and for open country, flying aircraft or radio signals it is close to the truth.
The points that a Voronoi diagram is built around have a special name, and so does the region around each of them.
Each site claims the part of the plane that is closer to it than to any other site. That region is the site's cell.
Two neighbouring cells meet along a boundary. Points on the boundary are exactly as close to one of the two sites as to the other, so they belong to neither cell in particular.
The point where edges meet is a vertex. Most vertices join three edges and three cells, though four or more can meet when the sites are arranged symmetrically (four sites at the corners of a square give one vertex at the centre).
With these parts in place the whole object can be named.
The diagram of five villages A(1, 1), B(9, 1), C(11, 7), D(5, 9) and E(5, 5) in a rectangular district 12 km wide and 10 km tall shows every part. The cell of E is a five-sided region bounded by four edges and a short stretch of the district's western boundary. The cells of A, B, C and D also reach the edge of the district, and the district's boundary closes them off. Three vertices, , and , lie inside the district.
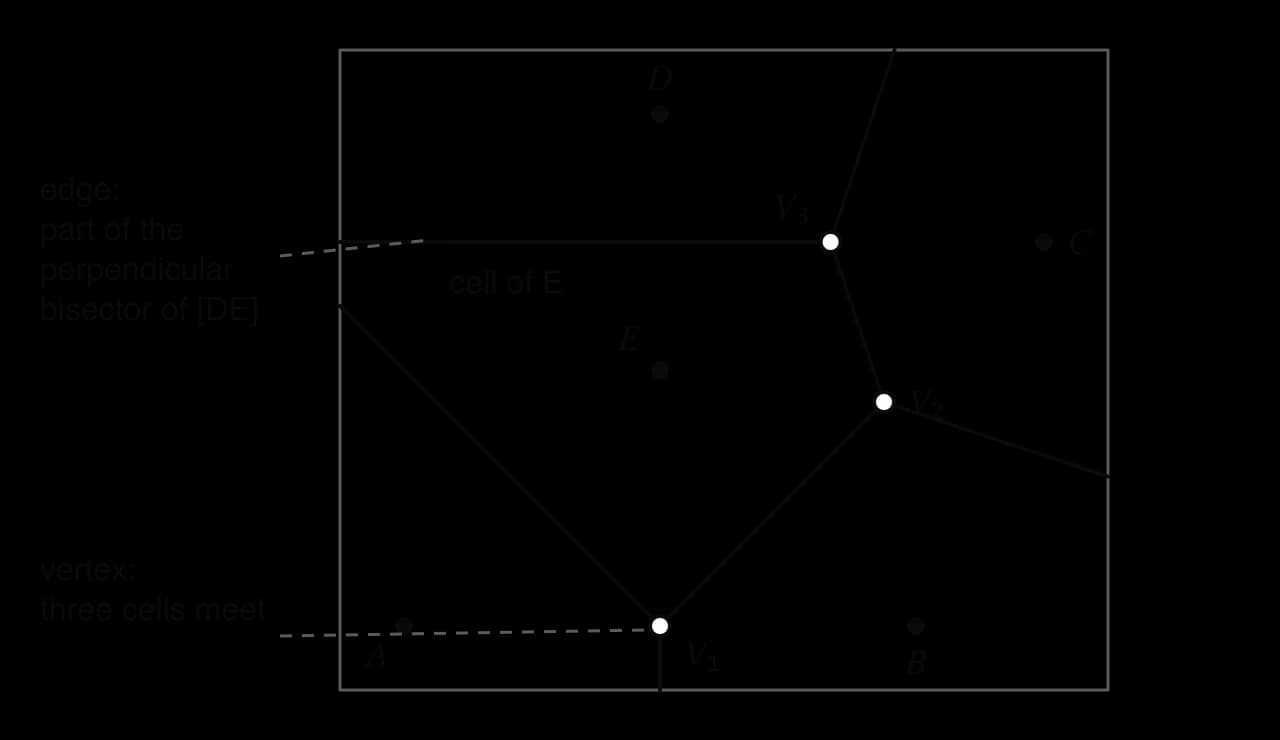
The words edge and vertex are used in graph theory too, where "vertex" and "edge" have different meanings (subtopic 3.14 for HL students). In a Voronoi diagram they always carry the meanings defined here.
The defining property of a cell gives the answer to most "explain" questions about Voronoi diagrams. If a phone mast's cell contains a walker, then every point of that cell, the walker's position included, is closer to that mast than to any other mast. With identical masts and signal strength falling with distance, the walker receives the strongest signal from that mast.
The points that are the same distance from two sites A and B form a straight line: the perpendicular bisector of the segment [AB]. Subtopic 3.5, Perpendicular bisectors, shows why. Any point P on the bisector forms two triangles with A and B that are congruent, so PA = PB; any point off the line is nearer to one site than the other. Every point that is equidistant from A and B lies on the bisector, and every point on it is equidistant from them.
An edge of a Voronoi diagram is a set of points equally close to two neighbouring sites, so it must lie on their perpendicular bisector. The edge is usually only part of the bisector: it stops where a third site becomes closer, which is where the edge reaches a vertex. Some edges are rays that run off to the edge of the region, and some are finite segments joining two vertices.
The bisector is found in four steps, recapped from subtopic 3.5:
Find the midpoint of the two sites, .
Find the gradient of the segment joining the two sites.
Take the negative reciprocal, , which is the gradient of any line perpendicular to the segment.
Write the line through the midpoint with that gradient, , and rearrange it into the form the question asks for.
Two special cases need no gradient at all. If the two sites have the same -coordinate, the segment is horizontal and the edge is the vertical line , where is the -coordinate of the midpoint. If the sites have the same -coordinate, the segment is vertical and the edge is horizontal, .
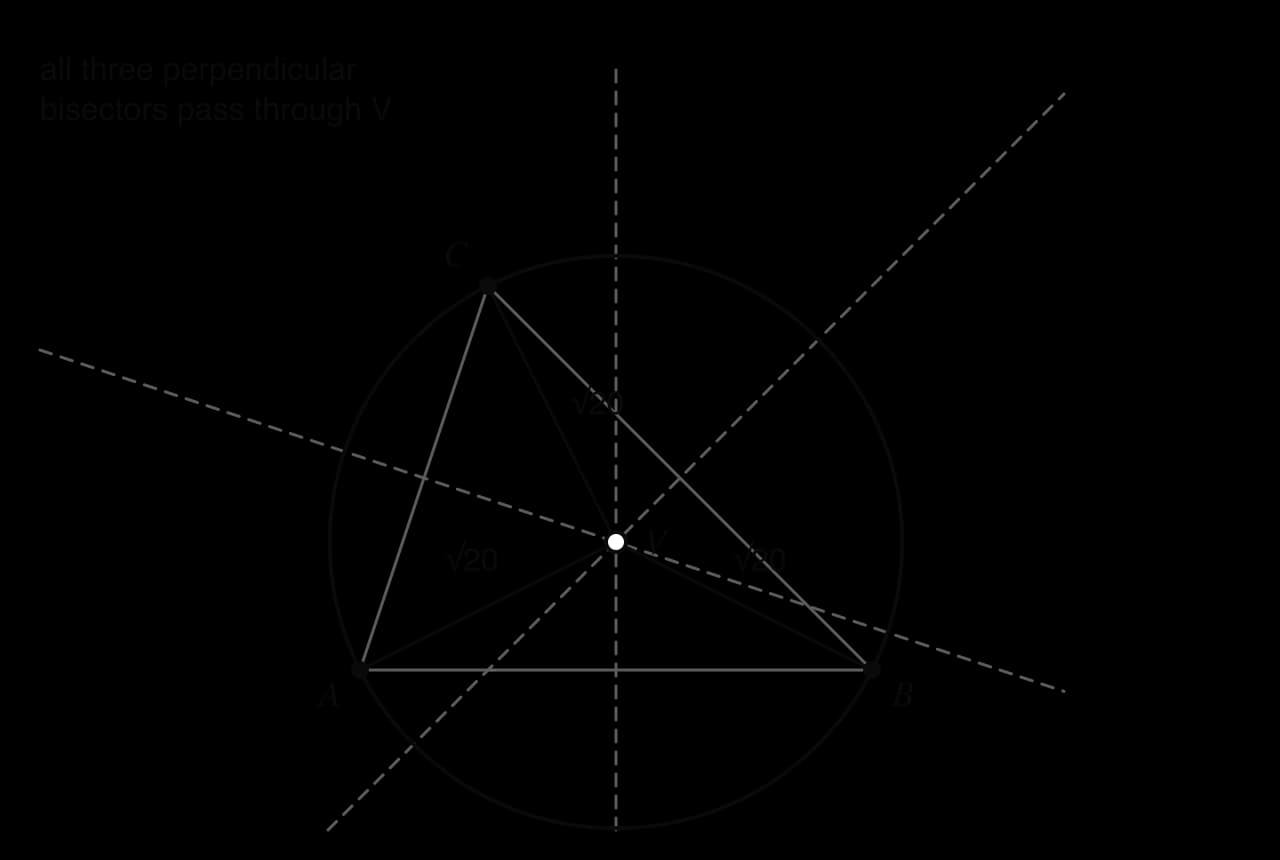
A vertex where the cells of A, B and C meet lies on the edge between A and B, so it is equidistant from A and B. It also lies on the edge between B and C, so it is equidistant from B and C. Then it is the same distance from all three sites, and it must lie on the third bisector, between A and C, as well. The three perpendicular bisectors of the triangle ABC always meet at one point, the circumcentre of the triangle, and that point is the Voronoi vertex.
The equal distances give a quick check on any vertex found by calculation, and they are the key to the toxic waste dump problem. A circle centred at the vertex with radius VA passes through all three sites. No other site can lie inside that circle, because a site inside it would be closer to V than A, B and C are, and V would then not be a vertex of their cells.
A site surrounded by other sites on every side has a closed cell, a polygon with straight sides. A site on the outside of the group has a cell that runs off to infinity, because points far away on that side are always nearest to it. In applications the diagram is usually drawn inside a region, such as a district, a park or a campus, and the region's boundary closes off the outer cells. Every cell is convex, which means the straight line between any two points of a cell stays inside the cell, so a cell never has a dent.
A sketch shows the general shape: each site in its own cell, edges in roughly the right places and at roughly the right angles, and vertices where three edges meet. It does not need a scale, but it must not contradict the coordinates (a site drawn on the wrong side of an edge, or an edge that is clearly not perpendicular to the segment between its two sites).
A reliable method for a small number of sites:
Plot the sites.
Decide which pairs of sites are neighbours. Sites that are close together with nothing between them share an edge; sites far apart with another site between them usually do not.
For each neighbouring pair, draw a light line through the midpoint at right angles to the segment joining them.
Where three of these lines meet, mark a vertex. Keep only the part of each line that lies between its vertices, or between a vertex and the boundary, and erase the rest.
Check that each cell contains exactly one site and that each edge is the same distance from the two sites on either side of it.
Symmetry saves a great deal of work. Four sites at the corners of a rectangle give two edges crossing at the centre; three sites at the corners of an equilateral triangle give three rays meeting at the centre at 120° to one another; two sites alone give a single straight line. The edge between two sites that are mirror images of each other in a line is that line.
The method for an edge is the method for a perpendicular bisector, applied to the two sites the edge separates. The answer is often wanted in a stated form: gradient-intercept form , or the general form with integer coefficients, which is reached by clearing fractions.
A vertex lies on two (in fact three) edges at once, so its coordinates satisfy both edge equations. Solving the two equations simultaneously gives the vertex. By hand this is substitution or elimination; with technology there are two standard ways.
Simultaneous equation solver. Write both edges in the form and enter the coefficients into the GDC's solver for a system of linear equations (on a TI-84 Plus CE, the PlySmlt2 app's simultaneous equation solver; on a Casio fx-CG50, MENU → Equation → SIMUL).
Graphical intersection. Rearrange each edge to , graph both, and use the intersection function.
What to write down: the two equations being solved, and the solution, for example "solving and on the GDC gives ".
The graphs of the two edges, drawn as functions, cross at the vertex. A graphical solution is exactly what the GDC's intersection function finds.
Sometimes one site and an edge are known, and the other site is wanted. Since the edge is the perpendicular bisector of the two sites, the missing site is the reflection of the known site in the edge. The method:
Find the line through the known site perpendicular to the edge.
Intersect that line with the edge; the intersection is the midpoint M of the two sites.
Use the midpoint formula backwards: the missing site is , coordinate by coordinate.
A cell inside a rectangular region is a polygon whose corners are vertices of the diagram and points where edges meet the boundary. Its area is found by splitting it into shapes with known area formulas: rectangles, right-angled triangles and trapezoids (a trapezoid with parallel sides and a distance apart has area ). Choosing the split well matters: vertical or horizontal cuts through the corners make every piece have horizontal or vertical sides, whose lengths are differences of coordinates.
A closed cell with three vertices is a triangle. Its area can come from a base and a perpendicular height when one side is horizontal or vertical. When none is, the sides are found with the distance formula, an angle with the cosine rule, and the area with the formula from subtopic 3.2, Trigonometry in triangles. When a side length is wanted as an exact value (a surd or a fraction), that exact value is kept for every later step rather than a rounded decimal.
In a shop or school catchment, a larger cell is often read as "more customers" or "more pupils". That reading rests on an assumption: that people are spread evenly over the region (uniform population density). A cell covering empty farmland can be huge and serve almost no one, while a small cell in a dense city centre can serve thousands. Other factors break the link as well: people choose shops for prices, opening hours and parking, travel along roads rather than straight lines, and cross boundaries on the way to work.
A new hospital, school or phone mast changes the diagram only near its own position. Rather than redrawing everything, the diagram can be updated by finding the new site's cell and removing whatever lies inside it. Building a whole diagram by adding sites one at a time in this way is an example of an algorithm.
The method for adding a site is an algorithm because each step is fixed in advance and needs no judgement, and the same sites always give the same diagram. Applied to one site after another, it builds a complete diagram from a single site.
The steps for adding a new site N to an existing diagram:
Find the cell that contains N. The site of that cell, S, is N's nearest existing neighbour.
Draw the perpendicular bisector of [NS]. The part of it inside S's cell becomes an edge of N's new cell.
Follow that bisector until it reaches an existing edge. There it enters the neighbouring cell, with site T; draw the perpendicular bisector of [NT] from that point.
Continue cell by cell until the path returns to its start (or reaches the region's boundary on both sides). The edges drawn enclose N's cell.
Delete every part of the old edges that now lies inside N's cell. Those points are now closer to N than to either of the two sites the old edge separated.
Each point where the new boundary crosses an old edge becomes a new vertex: it is equidistant from N and from the two old sites on either side of the old edge.
Four fire stations at A(2, 2), B(8, 2), C(8, 6) and D(2, 6) serve a district , . By symmetry their Voronoi diagram is two straight edges, and , crossing at (5, 4), and each cell is a 5 km by 4 km rectangle of area 20 km². A fifth station, E, is built at (6, 2).
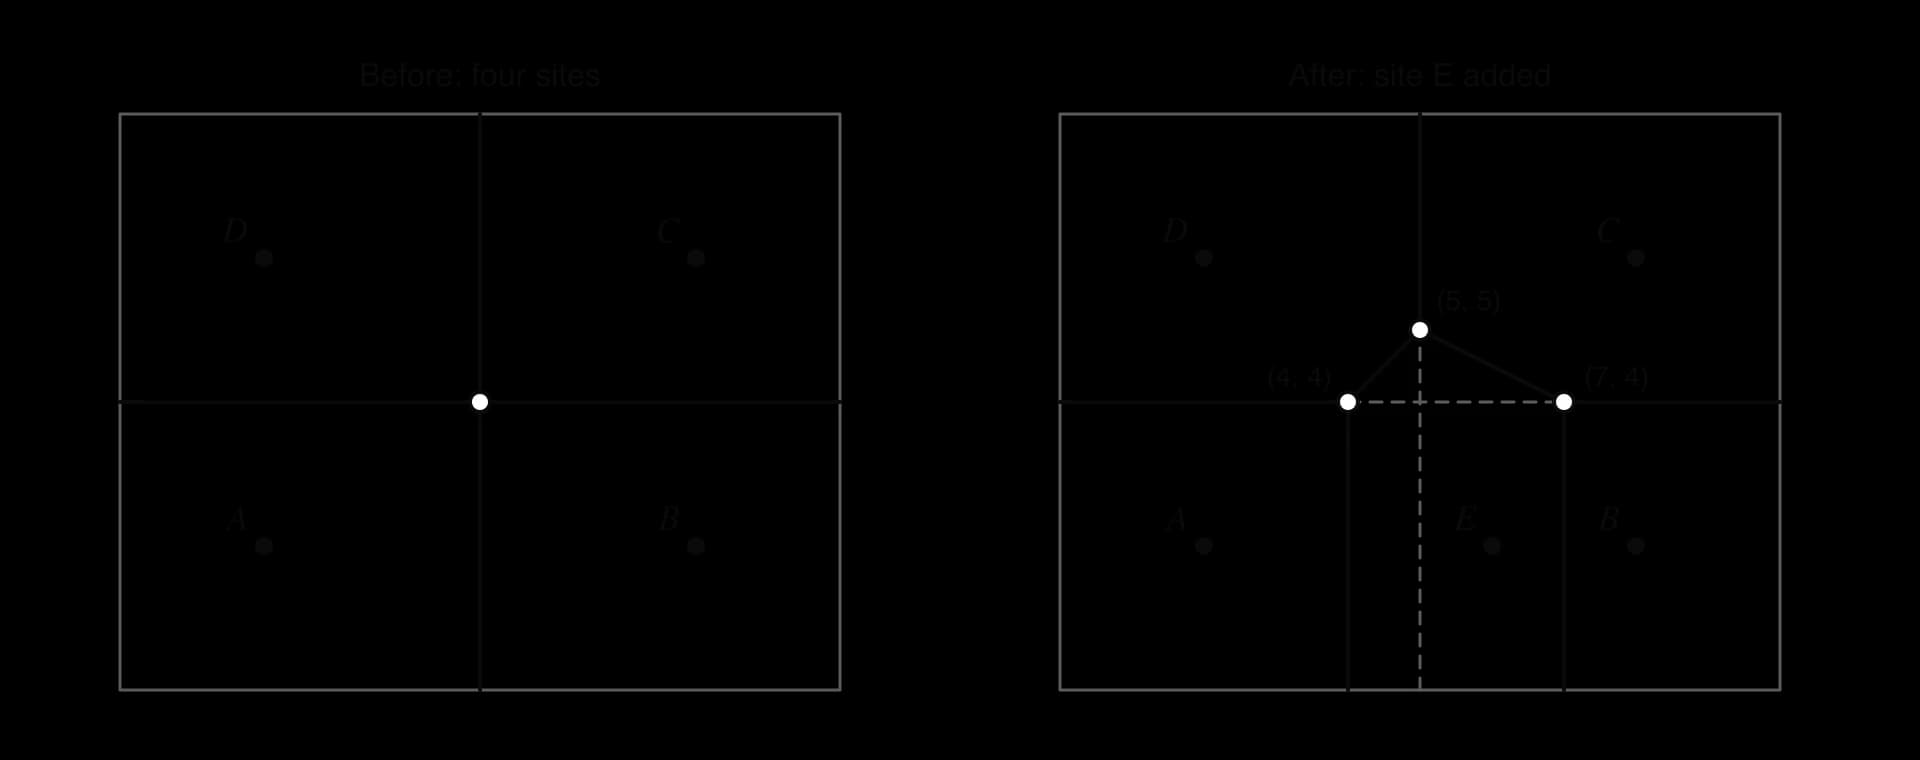
A new site takes land not only from the cell it lands in but from every cell whose site is close enough. Here E sits in B's cell but takes a small corner from D, a station 5.66 km away, because points near (5, 5) are now closer to E than to D.
Measurements are often made at a few points only (rain gauges, air-quality monitors, soil samples), yet a value is wanted everywhere in a region. The simplest estimate assigns each point the value measured at the nearest station. That is exactly the cell structure of a Voronoi diagram, with the stations as sites.
It is a special case of interpolation, estimating a value within the range of known data (subtopic 2.6). The American meteorologist A. H. Thiessen used it in 1911 to estimate rainfall over an area from scattered gauges, and Voronoi cells are still called Thiessen polygons in hydrology and meteorology.
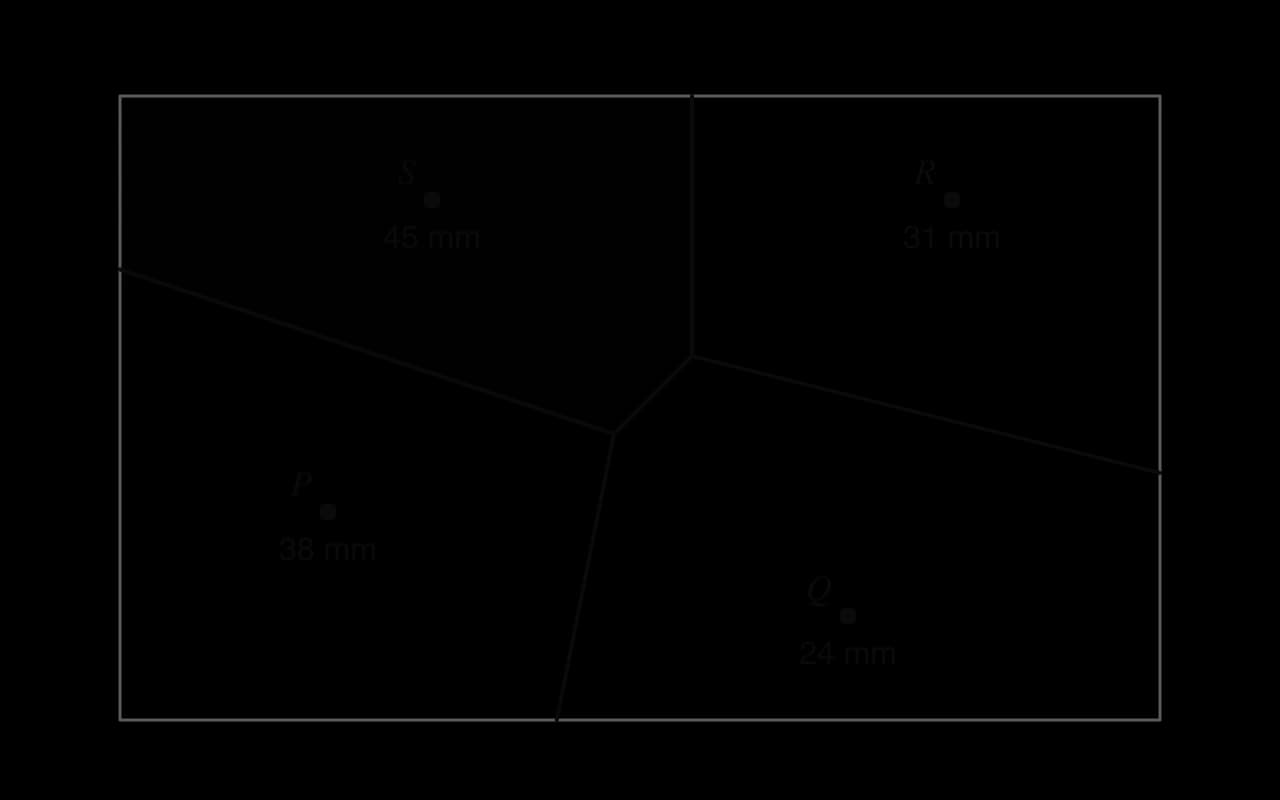
The cells also give a sensible average for the whole region. A plain mean of the gauge readings treats every gauge as equally important, even if one of them represents a much larger area than another. Weighting each reading by its cell's area gives each part of the region the same influence.
The catchment in the figure is modelled as the rectangle , , in kilometres. The four gauges recorded the rainfall for one storm (hypothetical data), and their Voronoi cells, measured from the diagram, have the areas in the table.
Gauge | Position | Rainfall (mm) | Cell area (km²) |
|---|---|---|---|
P | (4, 4) | 38 | 64.27 |
Q | (14, 2) | 24 | 65.28 |
R | (16, 10) | 31 | 55.13 |
S | (6, 10) | 45 | 55.33 |
The method is quick, needs only the diagram, and never produces a value outside the range of the readings. Its weaknesses come from the same simplicity. The estimate is constant across a whole cell and jumps suddenly at an edge, so two houses a few metres apart on either side of an edge get very different estimates, while a house beside a gauge and one at the far corner of the same cell get the same value. It ignores everything except the nearest reading, including hills, coasts and the second-nearest gauge. Methods that blend several nearby readings (natural neighbour interpolation, inverse distance weighting) give smoother estimates.
Some facilities are unwelcome: a waste dump, a noisy wind turbine or a quarry should be as far as possible from every town. "As far as possible from every town" means making the distance to the nearest town as large as possible. Moving away from one town is no help if it brings the dump closer to another.
The problem can be restated in terms of circles. A circle centred at a candidate point, with radius equal to the distance to the nearest site, has no site strictly inside it, so the best point is the centre of the biggest such circle.
Inside the cell of a site S, the nearest site is always S, so the distance to the nearest site is just the distance to S. That distance grows steadily as a point moves away from S, so within one cell the furthest point from S is at a corner of the cell: either a Voronoi vertex or a point where the cell meets the region's boundary. A point in the middle of an edge cannot be the best either, because moving along the edge away from the midpoint of the two sites increases the distance to both of them. The candidates are therefore the vertices of the diagram and the corners of the cells on the region's boundary.
When the solution lies inside the region, it is at a Voronoi vertex. The distance from a vertex to its nearest site equals its distance to any one of the three sites whose cells meet there, so one distance calculation per vertex is enough. The method:
List every vertex inside the region.
For each vertex, calculate its distance to one of the sites whose cells meet there.
Choose the vertex with the largest distance, and state both (or all) the distances compared.
The circle centred at each vertex through its three sites is empty, and the vertex with the largest such circle is the answer.
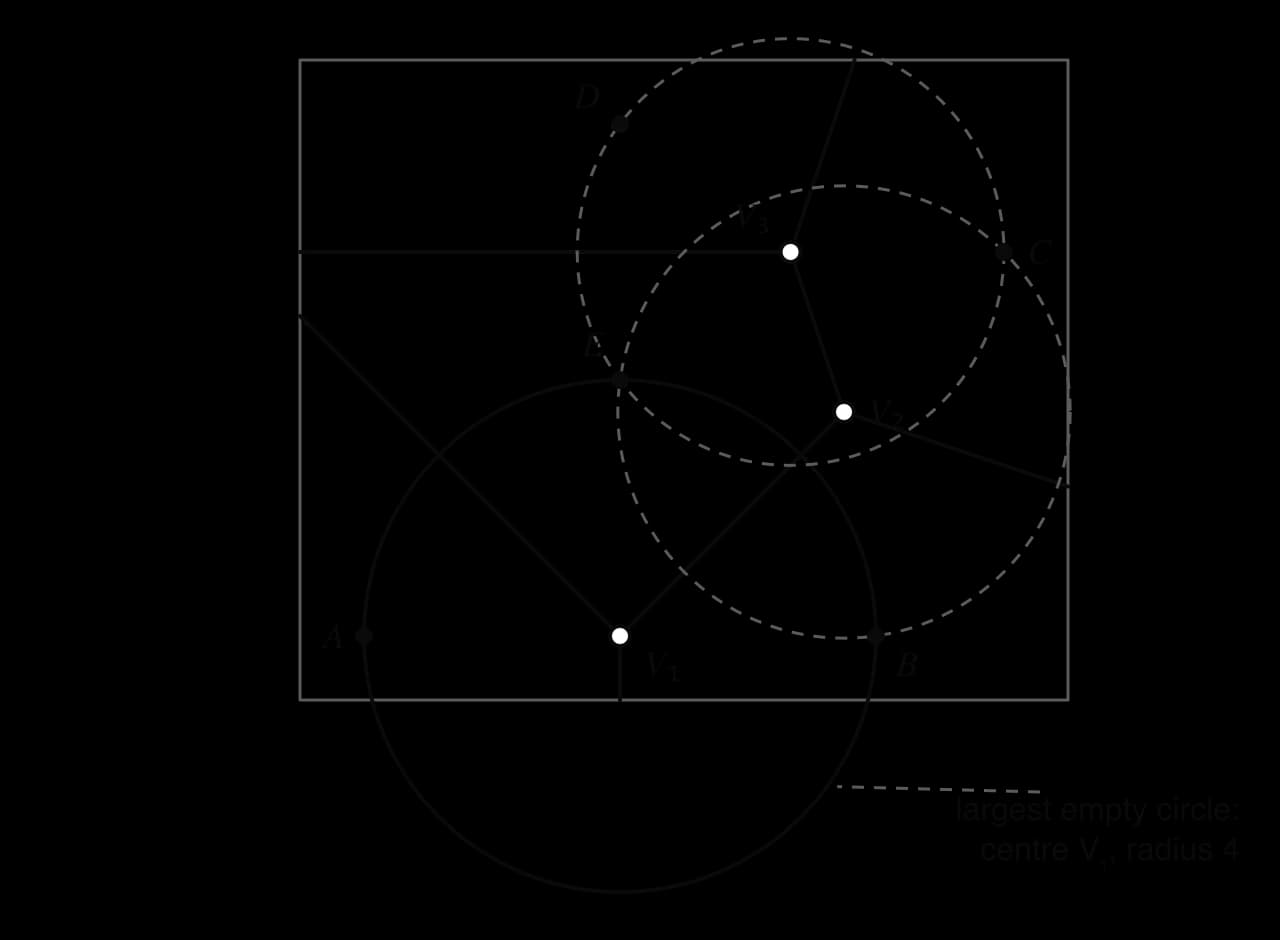
The restriction "not on the boundary" matters. The point (0, 7), where the edge between D and E meets the western boundary of the district, is km from both D and E, its nearest villages, which is further than any vertex. Without the restriction the best site would be at that boundary point. For this reason the problem is usually restricted to locations inside the region, where the answer is a vertex.
The toxic waste dump solution is a geometric answer to a simplified problem. It treats towns as points, ignores how many people live in each, measures straight-line distance rather than distance by road or downwind, and ignores rivers, groundwater and the cost of transporting waste to a remote site. A site far from towns may also be far from the roads needed to reach it. Planners therefore treat the vertex as a starting point and then adjust the location for the factors the model leaves out.
Joining every pair of sites whose cells share an edge produces a network of triangles that covers the region between the sites. This structure is used in computer graphics, terrain modelling and mesh generation for engineering simulations.
Each triangle of the Delaunay triangulation has a Voronoi vertex as its circumcentre, and its circumcircle contains no other site. This is the same empty-circle property that the toxic waste dump problem uses.
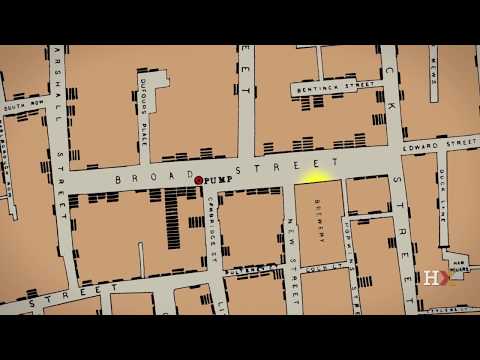
In late August 1854 a severe outbreak of cholera struck the Soho district of London: 127 people on or near Broad Street died in the first three days. At the time most doctors believed cholera spread through bad air. The physician John Snow suspected contaminated water, and he plotted each death on a street map together with the locations of the area's public water pumps. On 8 September the parish authorities removed the handle of the Broad Street pump.
Snow described the pattern in a letter to a medical journal written soon afterwards:
"There were only ten deaths in houses situated decidedly nearer to another street-pump." (John Snow, letter to the editor of the Medical Times and Gazette, 1854)
That is a nearest-site argument, and his map has been read as an early Voronoi diagram. The map was digitised in 1992 at the National Center for Geographic Information and Analysis (NCGIA, Santa Barbara): 13 pumps and 578 deaths, with coordinates in units of about 100 m. Building the Voronoi diagram of the 13 pumps over the mapped area (about 16.5 by 15.5 units, 256 hectares) and counting the deaths in each cell gives the table.
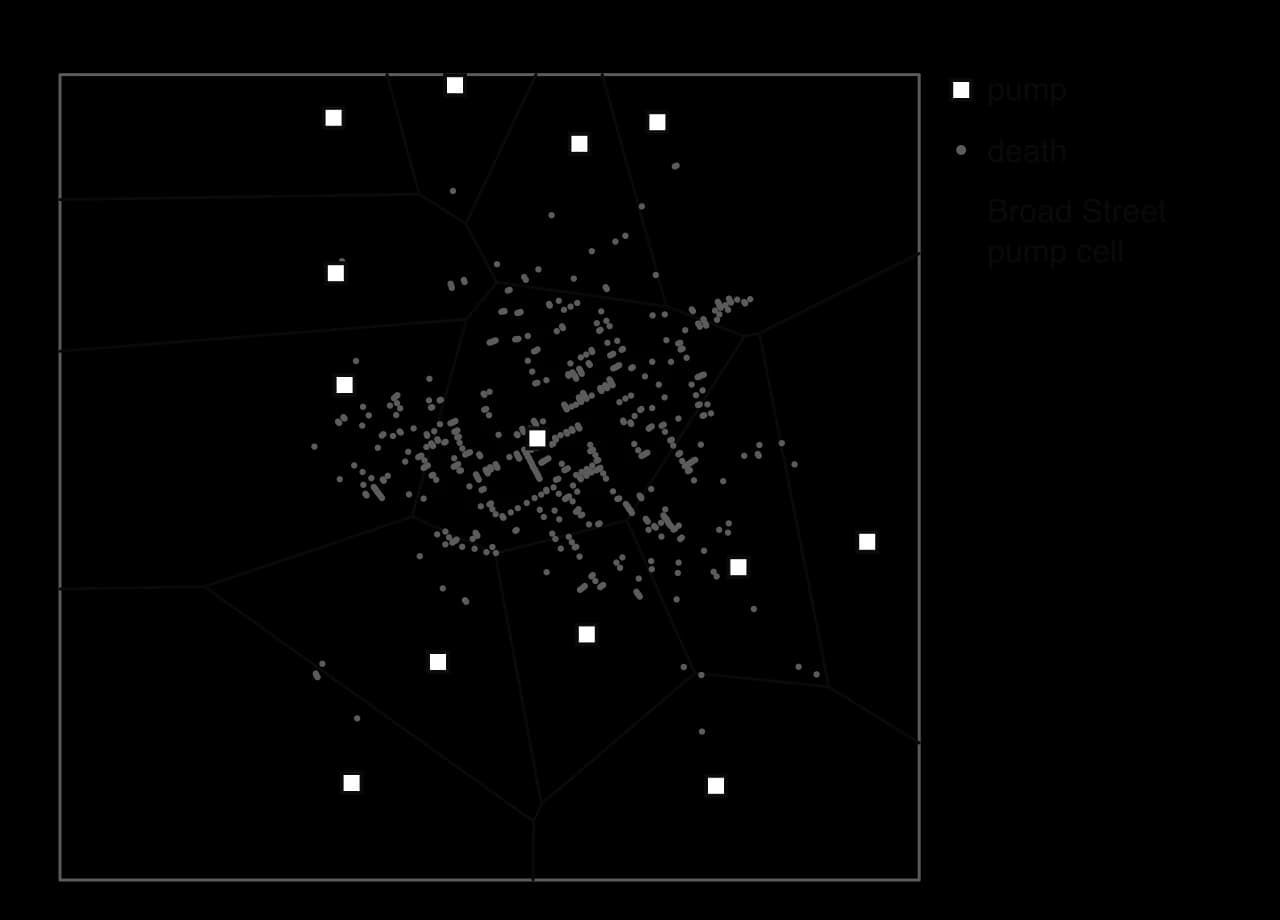
Pump (cell) | Cell area (ha) | Deaths in cell | Deaths per hectare |
|---|---|---|---|
Broad Street | 21.7 | 359 | 16.6 |
South Soho | 15.1 | 64 | 4.2 |
Crown Chapel | 31.8 | 61 | 1.9 |
Briddle Street | 12.4 | 27 | 2.2 |
Other nine pumps | 175.0 | 67 | 0.4 |
All 13 pumps | 255.9 | 578 | 2.3 |
Source: Snow's 1854 map digitised by R. Dodson, NCGIA (1992), from Tobler (1994); data in the HistData R package (Snow.pumps, Snow.deaths). Cells and areas calculated from straight-line distance within the mapped area.
The Broad Street cell covers only of the mapped area but holds of the deaths. Its death density of 16.6 per hectare is about four times that of the next worst cell and more than forty times that of the cells of the nine least affected pumps together. This is the pattern nearest-site reasoning would lead one to expect if the Broad Street water carried the disease.
The model has clear limitations, several of which Snow's own investigation addressed. Straight-line distance is not walking distance through streets, so a house can be "nearest" to a pump that is slower to reach. The map records deaths but not how many people lived in each cell, so death rates per head cannot be found. People did not always use the nearest pump: Snow found families who preferred the Broad Street water and children who drank it at school. The cell areas also depend on where the edge of the map is drawn. The central result depends on where the deaths cluster rather than on the precise boundaries, so these limitations change the numbers in the table more than the conclusion.
 YouTube
Voronoi diagrams appear on SL and HL Papers 1 and 2, and can form part of an HL Paper 3 question. Short Paper 1 questions (3 to 9 marks) ask for the gradient or equation of one edge, the coordinates of a missing site by symmetry, the meaning of a cell, or a two-vertex toxic waste dump comparison. Paper 2 questions (12 to 18 marks) chain the techniques: a midpoint, an edge equation, a vertex by intersection, an exact length, an angle by the cosine rule, a cell area, and a criticism of the model.
The command terms used most are write down (a coordinate from symmetry, the equation of a horizontal or vertical edge: little or no working), find (an edge or a vertex: working expected), sketch (a diagram with the right shape and vertices in roughly the right places; no scale needed), show that (work forwards to a given equation or a given choice of vertex), explain and state (the meaning of a cell, a criticism), and determine or justify (the toxic waste dump answer with reasons).
What to write down:
For an edge: the gradient of the segment between the sites, the negative reciprocal, the midpoint as a coordinate pair in brackets, and the line through the midpoint. Each is usually a separate mark.
For a vertex: the two edge equations solved together and the result; with a GDC, state "solving … and … gives …".
For the toxic waste dump: the statement that the answer is at a vertex, a distance from every candidate vertex, and the comparison.
For areas: how the cell is split, and each piece's area.
A frequent trap is the edge between two sites on a horizontal or vertical line. Sites with the same -coordinate have a vertical edge , and the equation of the line through them () earns nothing.
Two lifeguard towers are at (2, 5) and (2, 11). Write down the equation of the edge between their cells in a Voronoi diagram. [1]
Two sites are P(−1, 4) and Q(5, 2). Find the equation of the edge between their cells, giving your answer in the form . [4]
Three water wells are at A(0, 0), B(10, 0) and C(4, 8), in kilometres. (a) Find the coordinates of the vertex of their Voronoi diagram. [4] (b) Find the distance from the vertex to each well. [2]
K(9, 2) is a site of a Voronoi diagram and the edge between the cells of K and L is . Find the coordinates of L. [6]
Weather stations U(0, 0), V(8, 2) and W(3, 9) recorded noon temperatures of 14.2 °C, 12.6 °C and 11.1 °C. Coordinates are in kilometres. (a) Use nearest neighbour interpolation to estimate the temperature at (4, 4). [3] (b) State one limitation of this estimate. [1]
A park is the rectangle , , in hundreds of metres. Kiosks stand at S₁(2, 3), S₂(8, 1) and S₃(8, 5). The edges between S₁ and S₂ and between S₁ and S₃ are
A region is the rectangle , , with sites A(2, 4) and B(10, 4). A new site C(6, 7) is added. (a) Show that the edge between the cells of A and C is
Four villages are at A(3, 3), B(10, 2), C(15, 7) and D(3, 9) in a district , (in km). The vertices of their Voronoi diagram are (7, 6) and (9, 8). A landfill site is to be placed inside the district, not on its boundary, as far as possible from the nearest village. Determine where it should be placed, justifying your answer. [4]
Explain why, in the toxic waste dump problem, the best location inside a region is never a point partway along an edge, between its two ends. [2]
The sites share , so the edge is horizontal through the midpoint (2, 8): .
Midpoint (2, 3); gradient of [PQ] ; edge gradient 3; , so .
(a) Edge AB: . Edge AC: midpoint (2, 4), gradient of [AC] 2, so
Line through K perpendicular to the edge: . Intersection with
(a) Distances from (4, 4): to U , to V
(a) , so
(a) Midpoint (4, 5.5); gradient of [AC] ; edge gradient ;
The answer is at a vertex. Distance from (7, 6) to A: km. Distance from (9, 8) to B:
On an edge, the nearest sites are the two sites the edge separates, and the distance to them is smallest where the edge crosses the segment joining them (their midpoint) and grows steadily in both directions away from it. So along any edge the distance to the nearest site is largest at one of the edge's ends, which is a vertex (or a point on the region's boundary), never at a point partway along.
A Voronoi diagram divides a region into cells, one per site; every point in a cell is closer to its site than to any other site.
Every edge lies on the perpendicular bisector of the two sites whose cells it separates: through their midpoint, with gradient the negative reciprocal of the gradient between them. Sites level with each other give a vertical edge ; sites one above the other give a horizontal edge .
A vertex is the intersection of edges, found by solving two edge equations simultaneously (by hand or with a GDC); it is equidistant from three or more sites, as the circumcentre of their triangle.
Cell areas come from splitting cells into rectangles, triangles and trapezoids, or from with the cosine rule; interpreting area as customers or patients assumes uniform population density.
Adding a site: draw the bisectors between the new site and each neighbour, find the new vertices, and delete the old edges inside the new cell.
Nearest neighbour interpolation gives every point the value of its cell's site; an area-weighted mean uses the cells to average over a region.
The toxic waste dump answer inside a region is the Voronoi vertex furthest from its sites; compare the distance from every candidate vertex.
Voronoi models assume point sites, straight-line distance and nearest-site choice; criticisms should name one of these in context.
I can name the site, cell, edge and vertex in a Voronoi diagram and say what each means in context.
I can find the closest site to a point by comparing distances.
I can explain why every point in a cell is closer to its own site than to any other.
I can explain why an edge lies on a perpendicular bisector and why a vertex is equidistant from three sites.
I can write down the edge between two sites with the same - or -coordinate without calculation.
I can find the equation of an edge in the form or with integer coefficients.
I can find a vertex by solving two edge equations, and check it with equal distances.
I can find a missing site by reflecting a known site in an edge.
I can sketch a Voronoi diagram for three or four sites, using symmetry.
I can calculate the area of a cell by splitting it into simple shapes, or with the cosine rule and .
I can add a site to a diagram, finding its new edges and vertices and deleting the old edges inside its cell.
I can estimate a value by nearest neighbour interpolation and calculate an area-weighted mean.
I can solve the toxic waste dump problem, showing the distance from every candidate vertex.
I can give a specific criticism of a Voronoi model in context.
Write down the equation of the perpendicular bisector of [AB].
2 marks
A1A1
Note: Award one mark for and one mark for a correct equation with . Award one mark only for "6" alone.
[2 marks]
Write down the equation of the perpendicular bisector of [BC].
2 marks
A1A1
Note: Award one mark for and one mark for a correct equation with .
[2 marks]
A maintenance depot is to be built at the point that is the same distance from all three masts. Find the distance from the depot to each mast.
2 marks
depot at (A1)
(km) A1
Note: Follow through from parts (a) and (b).
[2 marks]
A phone network has towers T1(3, 4) and T2(9, ) on a coordinate grid where one unit represents one kilometre. Every point on the boundary line L between the coverage areas of T1 and T2 is equidistant from the two towers. L has equation .
Write down the gradient of L.
1 mark
Hence write down the gradient of [T1T2].
1 mark
Find the value of .
2 marks
Verify that the midpoint of [T1T2] lies on L.
2 marks
A third tower is built at T3(7, 12). Find the equation of the perpendicular bisector of [T2T3].
4 marks
Find the coordinates of the point V that is equidistant from all three towers.
2 marks
Find the distance from V to each tower.
2 marks
The engineers say that V is where the signal from the network is likely to be weakest. Give a reason why they might say this.
1 mark
The town of Aldmoor has three fire stations, at A, B and C, where distances are measured in kilometres. The following diagram shows the positions of the three stations and the perpendicular bisector of [BC], which has equation .
In the event of a fire, the fire station closest to the fire responds.
Write down
(i) the coordinates of the midpoint of [AB];
(ii) the gradient of [AB].
2 marks
Show that the perpendicular bisector of [AB] has equation .
2 marks
Find the coordinates of V, the point where the perpendicular bisectors of [AB] and [BC] meet.
2 marks
Find the equation of the perpendicular bisector of [AC], and hence verify that V lies on it.
3 marks
Find the distance from V to each of the three fire stations.
(b) Solve and together. Substituting,
and . On a GDC, the simultaneous equation solver with and gives the same result. The vertex is .
(c) The squared distances are
All three distances equal km, as a vertex requires.
(c) X lies on and on the edge of (b).
so X = (−1, 5.5). Y is where the cells of A, B and D meet, so it lies on the edge between A and B, which is .
so Y = . The diagram is symmetric in , so Z = (9, 5.5).
(d)
(e) By symmetry , and . The cosine rule gives
so (73.7397…°).
(f) Using the unrounded angle,
The exact area is km², which matches the base-and-height check .
and : (7, 4), where the cells of B, C and E meet.
C (right of , above ): triangle (5, 4), (7, 4), (5, 5): 1 km².
D (left of , above ): triangle (4, 4), (5, 4), (5, 5): 0.5 km².
The greatest is 4 km, so the plant should be built at , 4 km from villages A, B and E.
gradient of edge (negative reciprocal) (M1)
midpoint of [AD] (A1)
, so (or any integer multiple) A1
[4 marks]
(c) substituting into their equation from (b): (M1)
P = (7, 2) A1
[2 marks]
(d) attempt to find the distances to at least two huts (M1)
for example to B, and to D
B is nearest A1
[2 marks]
(e) the point must be a vertex of the Voronoi diagram (R1)
attempt to find the distance from a vertex to one of its huts (M1)
and A1
build at P(7, 2) A1
[4 marks]
(f) for example: hikers are not spread evenly over the park (popular trails pass through some cells), rescue teams travel along paths rather than in straight lines, or terrain makes some areas more dangerous R1
[1 mark]
Total [14 marks]
A fire breaks out at a warehouse at H. Determine which fire station responds.
2 marks
The town council requires every point in Aldmoor to be within km of its nearest fire station. A planner says that V is the point in the triangle ABC furthest from its nearest station. Hence determine whether every point inside the triangle ABC is within km of a fire station.
2 marks