5.5 Introduction to integration · IB Maths AI | Augment Education
5.5 Introduction to integration
Integrate sums of integer powers of x, find the constant of integration from a boundary condition, evaluate definite integrals with a GDC, and find areas under curves and between a line and a curve.
IB Mathematics: Applications and Interpretation
Part of 5 Calculus
SL and HL
Key terms introduced here
Each is in the Maths AI glossary, with every other term in the subject.
The area of the region enclosed by two graphs between two values of x, found by subtracting the area under the lower graph from the area under the upper graph over the same interval.
A known pair of corresponding values of the variables, used to find the constant of integration and so select one function from the family of anti-derivatives.
The arbitrary constant C added to an anti-derivative in an indefinite integral, because a constant term disappears on differentiation and so cannot be recovered from the derivative alone.
The number ∫abf(x)dx, the limit of the sum of f(x) times the strip width over the interval from x=a to x=b as the strips become infinitely thin; when f(x)>0 it equals the area under the curve between x=a and x=b.
The two values of the variable between which a definite integral is taken: the lower limit a, written at the bottom of the integral sign, and the upper limit b, written at the top.
, where each power
n
is an integer other than
−1
, rewriting fractions and products as powers first.
Find the constant of integration from a boundary condition, including a quantity found from its rate of change in context.
Write down a definite integral with its limits, integrand and dx, and calculate its value using technology.
Explain the link between anti-derivatives, definite integrals and the area under a curve.
Find the area of a region enclosed by a curve y=f(x) and the x-axis, where f(x)>0.
Determine the area between a line and a curve as the difference of two areas.
Interpret a definite integral of a rate as an accumulated total, with units, in context.
Introduction
Differentiation starts with a quantity and finds how fast it changes. Integration works the other way: it starts with a rate of change and rebuilds the quantity, or adds up a rate over an interval to find a total. A water company that records the flow rate into a reservoir uses integration to find the volume added; an electricity network that records power every half hour uses it to find the energy supplied in a day. The same calculation, read as geometry, gives the area under a curve, so one tool answers questions about totals, accumulations and areas.
Integration has two linked forms. The indefinite integral is a formula, the reverse of a derivative, and comes with an unknown constant that a known point can fix. The definite integral is a number, the accumulated total between two values of x, and for a curve above the x-axis it equals the area under the curve. The result that connects the two, the fundamental theorem of calculus, is one of the central results of the subject.
Anti-differentiation
In subtopic 5.3, Differentiating polynomials, the power rule turns x3 into 3x2. Anti-differentiation reverses the process: given a derivative, it finds a function that has that derivative. If a function has derivative 2x, then the function could be x2, because differentiating x2 gives 2x.
The answer x2 is not the only one. The functions x2+5, x2−3 and x2+0.71 all have derivative 2x, because the derivative of a constant is zero. Adding any constant to an anti-derivative gives another anti-derivative, so a function has infinitely many anti-derivatives, all differing by a constant. The process of finding them has its own name.
The family of anti-derivatives
Graphs show why the anti-derivatives differ only by a constant. Every curve y=x2+C has the same gradient 2x at each value of x, so the curves have exactly the same shape and are vertical translations of one another. The derivative therefore determines the shape of each curve, and the constant determines its vertical position.
y = x² − 3
y = x²
y = x² + 2
y = x² + 5
Four anti-derivatives of 2x: each is the curve y = x² moved up or down, and at x = 1 every one of them has gradient 2.
The whole family is written with a single letter C standing for "any constant". This is the indefinite integral, and the notation uses the integral sign ∫, an elongated S, together with dx to show which variable the function is integrated with respect to.
∫2xdx=x2+Cbecausedxd(x2+C)=2x
Each part of the notation has a meaning. The function inside, here 2x, is the function being integrated. The dx closes the expression and names the variable; with a variable t the integral is written ∫f(t)dt. The +C records that the answer is a whole family of functions.
The unknown constant has its own name, and it must appear in every indefinite integral.
Checking by differentiating
Because integration reverses differentiation, every indefinite integral can be checked by differentiating the answer. If the derivative of the answer is the integrand, the integration is correct. This check takes seconds and catches most slips with powers and coefficients.
Integrating powers of x
The rule for xⁿ
Differentiating a power lowers the index by 1 and multiplies by the old index. Integrating must undo both steps in reverse order: raise the index by 1, then divide by the new index. The reasoning comes straight from the power rule:
dxd(xn+1)=(n+1)xn⟹dxd(n+1xn+1)=xn
So n+1xn+1 is an anti-derivative of xn, and adding the constant gives the indefinite integral.
∫xndx=n+1xn+1+C,n=−1
The condition n=−1 cannot be dropped. For n=−1 the rule would divide by n+1=0, which is impossible. A second reason is that no power of x has derivative x−1. Differentiating x0=1 gives 0, not x−1, so the power rule never produces x1, and an anti-derivative of x1 has to be a different kind of function altogether.
Integrand
Raise the index by 1
Divide by the new index
Indefinite integral
x4
x5
5x5
51x5+C
x
x2
2x2
1=x0
x1
1x
x−2
x−1
−1x−1
x−3
x−2
−2x−2
The table shows two cases that are easy to overlook. A constant such as 1 is x0, so it integrates to x. A negative index rises towards zero: −2 becomes −1 and −3 becomes −2, and dividing by a negative number makes the coefficient negative.
Constant multiples and sums
Two properties of differentiation carry over to integration, because integration reverses it. A constant multiple stays in front, and a sum is integrated term by term.
A constant on its own integrates to that constant times x: ∫5dx=5x+C, because the derivative of 5x is 5. When a sum is integrated term by term, each term would produce its own constant, but a sum of unknown constants is just one unknown constant, so a single +C is written at the end.
Rewriting before integrating
The rule works only on terms of the form axn. Fractions with x in the denominator, products of brackets and quotients must first be rewritten as sums of powers, exactly as in subtopic 5.3 before differentiating.
A power of x in the denominator becomes a negative integer power: x38=8x−3 and x25=5x−2. The coefficient stays in the numerator.
A product of brackets is expanded first: (2x−1)(x+3)=2x2+5x−3.
A quotient with a single term underneath is split into separate fractions: x2x4−6=x2−6x−2
A different variable is handled in the same way, with dt, dh or dθ in place of dx, and the answer written in that variable.
A product cannot be integrated factor by factor. ∫(2x−1)(x+3)dx is not (x2−x)(2x2+3x)+C; differentiating that product does not give back the integrand. Expanding first and then integrating term by term is the correct route.
Boundary conditions and the constant of integration
An indefinite integral gives a family of curves. To pick out the one curve that fits a situation, one more fact is needed: a point that the curve passes through, or a value the quantity takes at a known time. This extra fact is called a boundary condition.
The method has four steps.
Integrate, writing +C.
Substitute the known values of x and y into the result.
Solve the equation for C.
Write the final function with the value of C in place.
For example, if dxdy=3x2+x and y=10 when x=1, integrating gives y=x3+21x2+C. Substituting the point gives 10=1+0.5+C, so C=8.5 and
y=x3+21x2+8.5
The graph shows the family y=x3+21x2+C for several values of C. Only one member passes through the point (1,10), and the boundary condition selects it.
C = −2
C = 3
C = 8.5
C = 14
The curves y = x³ + ½x² + C all have gradient 3x² + x; only C = 8.5 passes through the boundary point (1, 10).
The same method works when the gradient function contains negative powers. The rewriting step comes first, and the substitution then works as before, provided the point does not have x=0 (where a negative power is undefined).
From a rate of change to a quantity
In context, a derivative is a rate of change: litres per minute, dollars per item, metres per second. When the rate is known and the quantity itself is wanted, the quantity is found by integrating the rate and then using a known value to find C. This is the most common use of integration in applied problems, and the hardest part is often recognising that integration is needed at all.
Units guide the interpretation. If dtdV is in litres per minute, then V is in litres. If dxdP is a marginal profit in thousands of dollars per item, then P is in thousands of dollars, and the boundary condition must be substituted in thousands too.
Area under a curve
Adding up thin rectangles
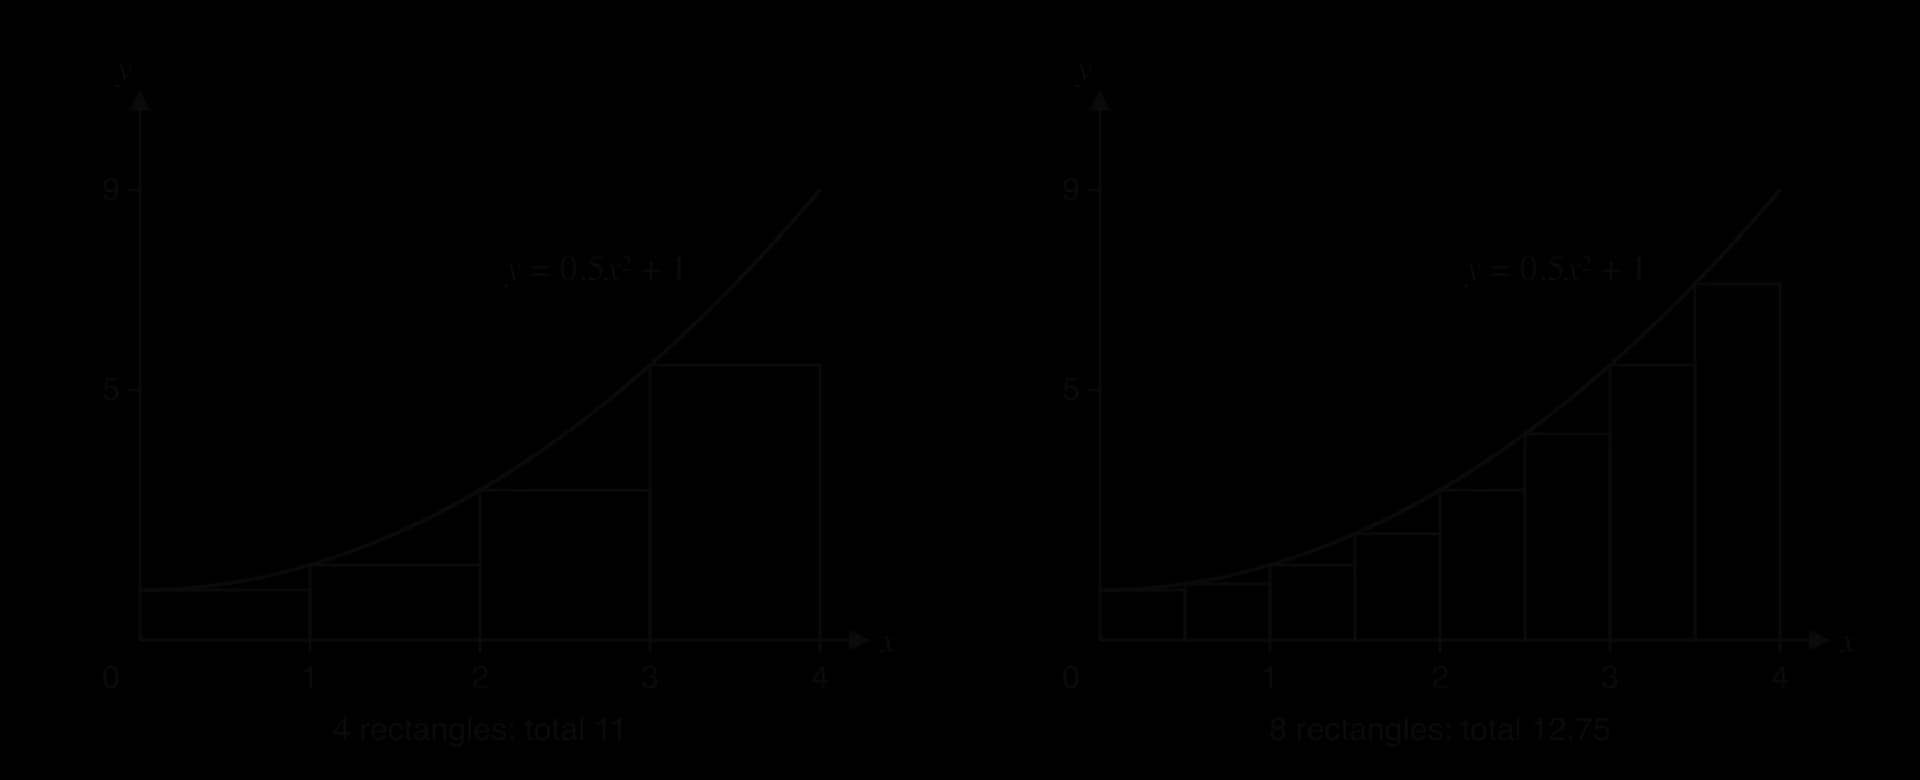
The second meaning of integration starts with a geometric question. A rectangle's area is width times height, but a region with a curved top has no such formula. The region under y=0.5x2+1 from x=0 to x=4 is a good test case. Cutting it into vertical strips and replacing each strip by a rectangle gives an estimate of the area.
With 4 strips of width 1, using the height of the curve at the left edge of each strip, the rectangles have heights f(0)=1, f(1)=1.5, f(2)=3 and f(3)=5.5.
area≈1×(1+1.5+3+5.5)=11
Halving the width of the rectangles shrinks the gaps between their tops and the curve, so the total area moves closer to the true area.
The rectangles sit under the curve, so 11 is too small. Using the height at the right edge of each strip puts the rectangles above the curve and gives 19, which is too large. With more, thinner rectangles, both estimates close in on one value.
Number of rectangles
Width of each
Left-edge total (too small)
Right-edge total (too large)
4
1
11
19
8
0.5
12.75
16.75
16
0.25
13.6875
15.6875
100
0.04
14.5072
14.8272
1000
0.004
14.6507
14.6827
The two columns trap the true area between them and squeeze together as the width shrinks. They approach 14.666…=344. This limit of the sum of rectangle areas, as the width of each rectangle tends to zero, is the exact area under the curve.
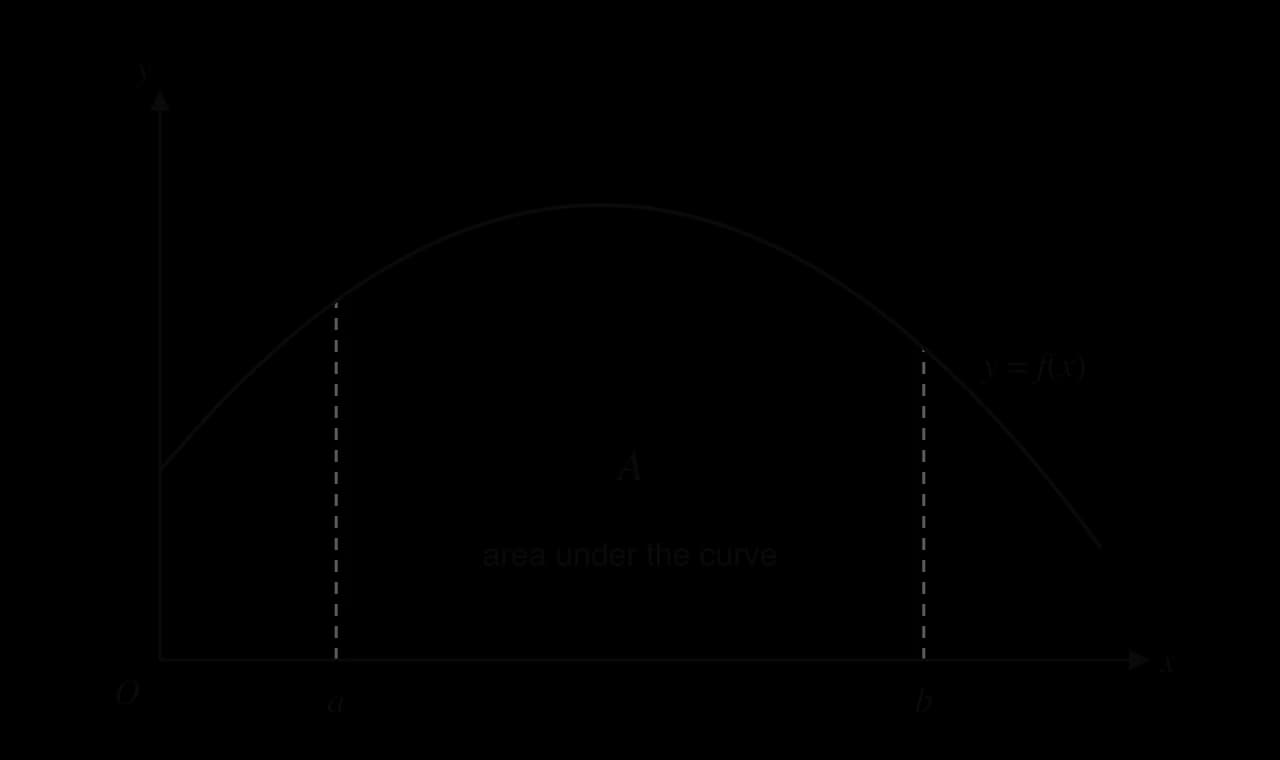
The area under a curve has four boundaries: the curve on top, the x-axis underneath, and the vertical lines x = a and x = b at the sides.
The definite integral
The limit of the rectangle sums is written with the integral sign, now with numbers at the bottom and top to show where the region starts and ends. The result is called a definite integral.
∫abf(x)dx
The notation records the rectangle sum that it came from. The integral sign is a stretched S for "sum"; f(x) is the height of a strip; dx stands for its very small width. The numbers a and b are the limits of integration.
An indefinite integral and a definite integral differ in kind. The indefinite integral ∫f(x)dx is a family of functions and carries +C. The definite integral ∫abf(x)dx is a single number and has no constant. For a curve above the x-axis, the area formula is
A=∫abydx,y=f(x)>0 for a≤x≤b
The limits are always values of x, the variable after d. They are the left and right edges of the region, never heights.
Anti-derivatives, definite integrals and area
The two meanings of integration, reversing a derivative and finding an area, are the same process. The link explains why the operation for both is called integration and why ∫ appears in both notations.
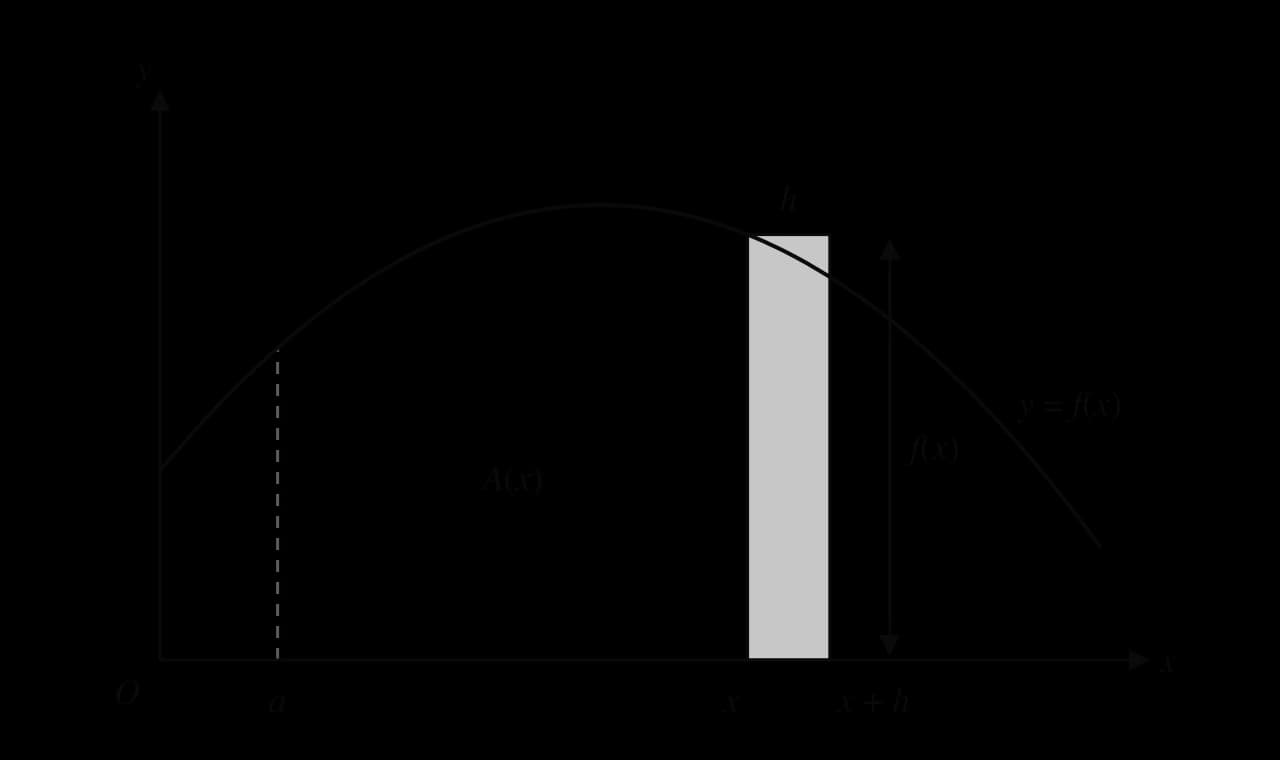
Let A(x) be the area under y=f(x) from a fixed line x=a up to a moving right-hand edge at x. When the edge moves a small distance h to the right, the area grows by a thin strip. The strip is almost a rectangle of width h and height f(x).
Moving the right-hand edge from x to x + h adds a strip of area about h × f(x), so the area function grows at rate f(x).
A(x+h)−A(x)hA(x+h)−A(x)≈f(x)×h≈f(x)
The left-hand side is the gradient of a chord of the graph of A. As h tends to zero the approximation becomes exact and the chord's gradient becomes the derivative, so A′(x)=f(x). So the area function A is an anti-derivative of f, because area builds up under the curve at a rate equal to the curve's height.
Any anti-derivative F(x) differs from A(x) by a constant, so A(x)=F(x)+C. The area from a to a is zero, so 0=F(a)+C and C=−F(a). Setting x=b gives the area up to b:
∫abf(x)dx=F(b)−F(a),where F′(x)=f(x)
This result is called the fundamental theorem of calculus. Its difference F(b)−F(a) is often written [F(x)]ab. The constant of integration cancels in the subtraction, which is why a definite integral has no +C.
The rectangle example confirms it. An anti-derivative of 0.5x2+1 is F(x)=6x3+x, so
which is exactly the value that the rectangle sums approached.
YouTube
3Blue1Brown, “Integration and the fundamental theorem of calculus”: watch how adding up thin rectangles under a velocity graph gives distance, and why the area function's derivative is the original function.
Definite integrals with technology
Most functions that model real situations are awkward or impossible to integrate by hand, and many are not polynomials at all. A GDC finds a definite integral numerically, by a refined version of the rectangle idea, for any function it can graph. For this reason the GDC is the standard way to evaluate a definite integral, and the hand method F(b)−F(a) serves as a check when the integrand is a sum of powers.
Using the GDC
Every GDC has a numerical integration function that needs three things: the integrand, the lower limit and the upper limit.
On a TI-84 Plus CE: MATH → 9: fnInt(, then enter the integrand, the variable, and the two limits in the template. From a graph, 2ndTRACE (CALC) → 7: ∫f(x)dx asks for the lower and upper limits and shades the region.
On a Casio fx-CG50: in Run-Matrix, OPTN → CALC → ∫dx opens the integral template. From a graph, SHIFTF5 (G-SOLVE) → ∫dx asks for the limits and shades the region.
On a TI-Nspire: the integral template, or Menu → Calculus → Numerical Integral; on a graph, the integral tool under Analyze Graph.
Graphing the function first is good practice. The graph shows whether the curve stays above the x-axis between the limits (needed for the integral to be an area), and the shaded region shows whether the limits were entered the right way round.
What to write down
A GDC answer on its own shows no method. The working to write down is the integral itself, written in full with its limits, its integrand and dx, followed by its value.
A=∫16(−0.1x3+0.9x2)dx=32.1 m2
When the function has already been named with a letter, ∫16f(x)dx states the integral completely; when two functions are involved, the integrand must be the correct expression, not just "y", so that it is clear which curve is integrated. Values are given to 3 significant figures unless an exact answer or a different accuracy is asked for.
The comparison in part (c) is a habit worth keeping. A rectangle, triangle or trapezoid that encloses a region, or sits inside it, gives a quick upper or lower bound for its area, and an integral outside those bounds signals a wrong limit or a mistyped function.
Finding the limits first
Sometimes the limits are not given. When the region is "enclosed by the curve and the x-axis", the limits are the zeros of the function, the x-intercepts, which the GDC finds from the graph or with its polynomial root finder. Storing the zeros in memory and using the stored values as limits avoids rounding error.
YouTube
Khan Academy, “Area between a curve and the x-axis”: watch how the region is described by its boundaries and turned into a definite integral with the correct limits.
A limit that has to be found
A harder problem gives the area and asks for one of the limits. Writing the area as an integral with an unknown limit k gives an equation in k, which the GDC solves (by graphing both sides and finding the intersection, or with the equation solver).
Definite integrals in context
A rate integrated over an interval gives a total
The fundamental theorem says that integrating a function from a to b gives the change in its anti-derivative. In context, when the integrand is a rate of change of some quantity Q, the definite integral is the total change in Q over the interval.
∫abdtdQdt=Q(b)−Q(a)=total change in Q from t=a to t=b
The units of a definite integral are the units of the integrand multiplied by the units of the variable. Litres per minute times minutes gives litres; downloads per day times days gives downloads; kilowatts times hours gives kilowatt-hours. Writing the units of both axes before interpreting an integral prevents most errors of meaning.
Area under a speed–time graph
For a moving object, speed is the rate at which distance is covered. Integrating speed over a time interval therefore gives the distance travelled, which is the area under the speed–time graph. For a constant speed the region is a rectangle: 12 m s⁻¹ for 5 s covers 12×5=60 m. For a changing speed the region has a curved top, and the area becomes a definite integral.
distance travelled=∫t1t2v(t)dtfor a speed v(t)≥0
v = 6 + 1.2t − 0.06t²
The cyclist speeds up for 10 s and slows down for the next 10 s; the area under the curve from t = 0 to t = 20 is the distance travelled.
Area between a line and a curve
When a region is bounded above by one graph and below by another, rather than by the x-axis, its area is the difference between the area under the upper graph and the area under the lower graph over the same interval. The limits are the x-coordinates of the points where the graphs meet.
area between=∫ab(upper)dx−∫ab(lower)dx=∫ab(upper−lower)dx
Both forms give the same value, because integration can be done term by term. With both graphs above the x-axis, each integral is an area under a curve, and the subtraction removes the part of the region that lies under the lower graph. The method is the same when the upper graph is a straight line, and the area under the line can be found as a trapezoid instead of an integral.
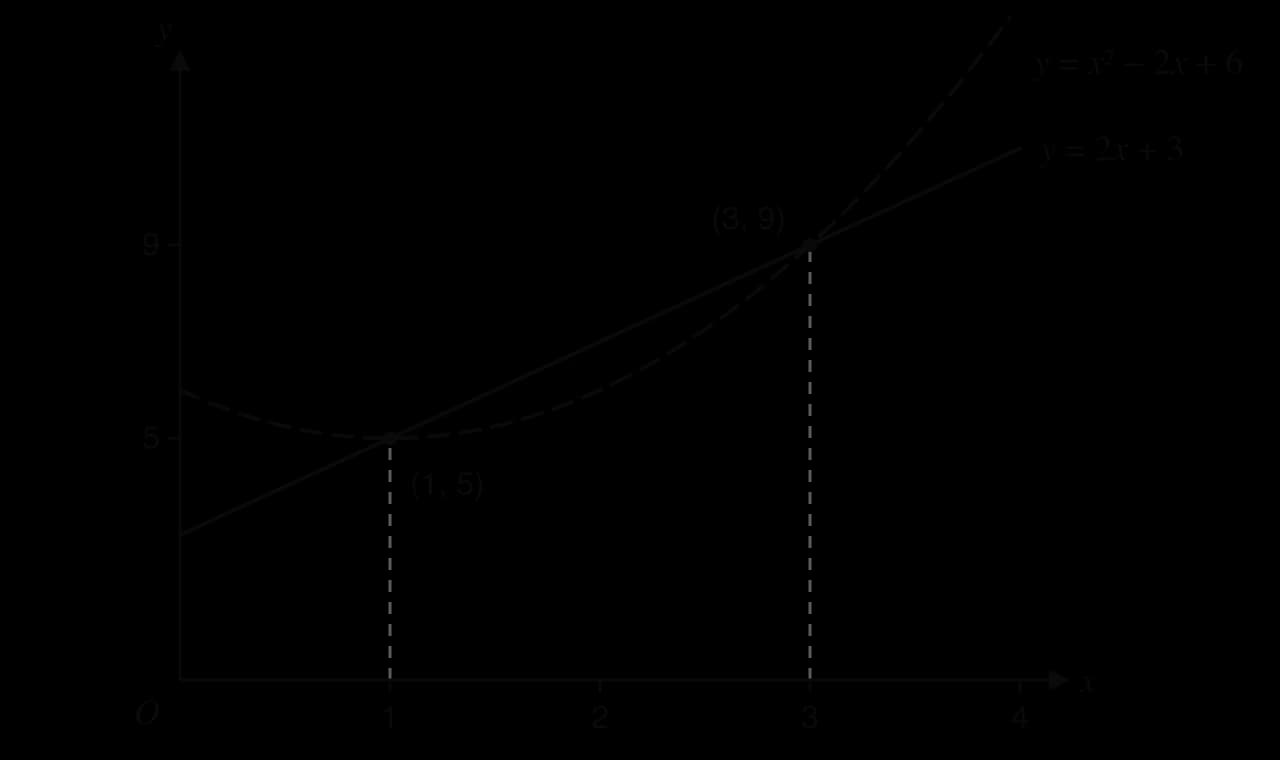
Between x = 1 and x = 3 the line lies above the curve; the shaded area is the trapezoid under the line minus the area under the curve.
The method has four steps.
Find where the graphs intersect (by solving, or with the GDC's intersection tool). Their x-coordinates are the limits.
Decide which graph is on top between the limits, by sketching or by testing one value of x.
Find the area under each graph between the limits (an integral, or a trapezoid for a line).
Subtract: upper minus lower.
Shapes with a curved part removed
A related problem asks for the area of a shape minus the area under a curve: a rectangular panel with a curved section cut out, or a frame around a curved painting. The area of the shape comes from a geometry formula, the area of the curved part from an integral, and the answer from a subtraction. The same checks apply: limits from the x-axis, full values until the last step, and a final answer smaller than the whole shape.
Case study: Great Britain's electricity demand on 17 January 2024
Electrical power is the rate at which energy is used, measured in watts; a kilowatt is 1,000 W, a megawatt (MW) is 1,000 kW and a gigawatt (GW) is 1,000 MW. Energy is power multiplied by time, so 1 MW used steadily for 1 hour delivers 1 megawatt-hour (MWh). When the power changes through the day, the energy used is the area under the power–time graph:
E=∫024P(t)dt(MWh, with P in MW and t in hours)
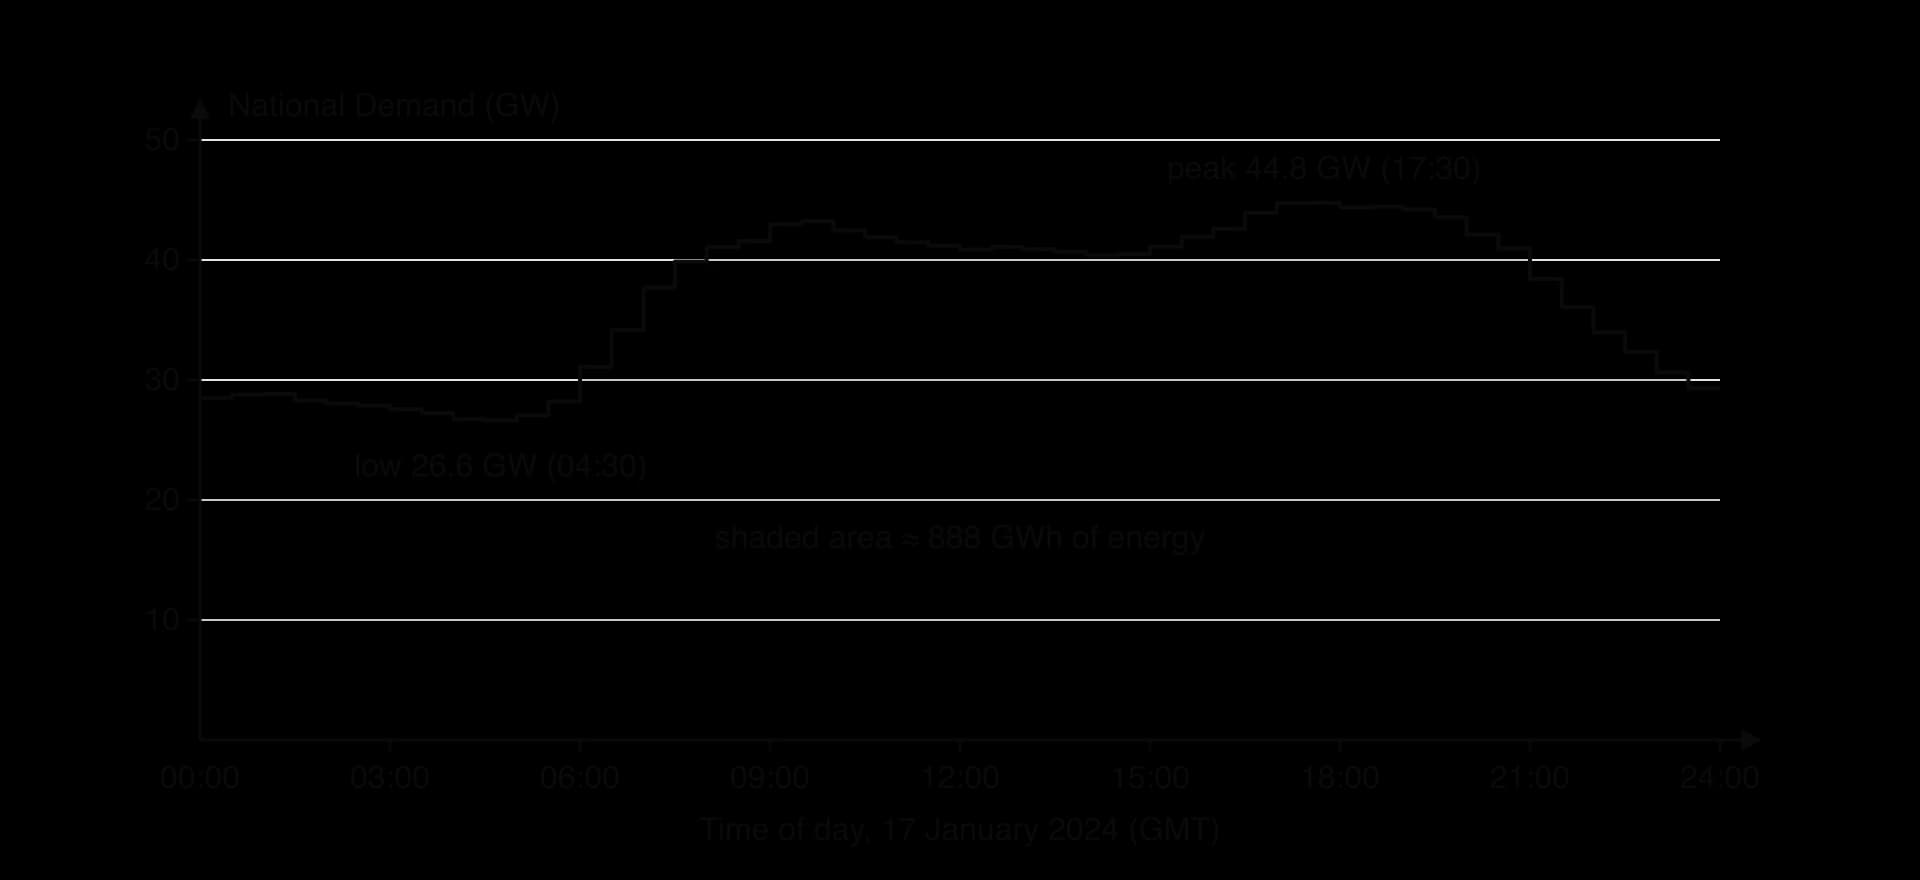
Great Britain's electricity system operator publishes national demand for every half-hour period of every day. Wednesday 17 January 2024 was an ordinary winter weekday. The figure shows that day's half-hourly values as a step graph: demand fell overnight to its lowest value, rose steeply between 06:00 and 09:00 as people got up and businesses opened, stayed high through the working day and peaked in the early evening, when lighting, cooking and heating are all in use.
Each step is one half-hour; the shaded area under the steps is the energy supplied through the day. Source: NESO, Historic Demand Data 2024 (National Demand, ND), accessed 2026.
Energy from the half-hourly values
The data are already a set of rectangles. Each of the 48 values is a power in MW for a half-hour period, so each rectangle has area P×0.5 MWh, and the day's energy is the sum of the 48 areas.
That is about 888 GWh, or 888 million kilowatt-hours, in one day. Dividing by 24 hours gives the average power, 24888279≈37000 MW, or 37.0 GW: the constant power that would deliver the same energy. On the graph, that average is the height of the rectangle with the same area as the region under the steps.
Fewer, wider rectangles
A student with only a reading every 3 hours would use 8 rectangles of width 3 hours, each with the height of the reading at its left edge.
Time
00:00
03:00
06:00
09:00
12:00
15:00
18:00
21:00
National Demand (MW)
28,521
27,574
31,089
42,975
40,860
41,099
44,387
38,411
Source: NESO, Historic Demand Data 2024; value for the half-hour starting at each time.
The estimate is only 0.40% below the half-hourly total, even though it uses one-sixth of the data. Rectangles that are too high in some places (such as 09:00, just after the morning rise) partly balance those that are too low in others (such as 06:00, at the start of the rise), so a coarse estimate can still be close. Hourly readings, with 24 rectangles of width 1 hour, give 887,915 MWh, within 0.04%.
Interpretation and limitations
The same calculation for Wednesday 19 June 2024 gives 553,048 MWh, about 553 GWh, which is 62% of the January day. Winter demand is higher because of heating and longer hours of darkness. The comparison only makes sense because both totals are areas under power–time graphs over the same 24 hours.
The national demand figure has a precise definition that limits what it measures. It counts electricity supplied through the transmission network and excludes the output of small solar panels and wind turbines connected directly to local networks, which reduce the demand seen by the network on sunny or windy days. Each value is a single figure for a half-hour period, so the step graph does not show changes within a half-hour. Neither limitation affects the calculation itself, which finds the total energy as the area under the power–time graph.
Exam focus
Integration at this level appears in Paper 1 as short questions of 4–7 marks and in Paper 2 as parts of longer contextual questions, often after a modelling or differentiation part. The command terms are find (an expression for a quantity from its rate, or an area), write down (an integral for an area, usually 2 marks: one for the integrand, one for the limits), hence (use the integral just written, or areas just found), determine and interpret (what an integral means in context, with units).
Four question shapes recur:
a rate in context (dxdP, dtdh, dθdl) with one known value, asking for the function: integrate, +C, substitute, state the function;
a design or architecture context (window, tunnel, scenery, garden) where a curved edge is modelled by a polynomial found from given points, followed by the area under it;
an area under a curve compared with a trapezoidal-rule estimate (subtopic 5.8), or with a simple shape that encloses it;
the area between a line and a curve, built as a trapezoid or integral for the line minus an integral for the curve.
What earns marks: the integral written with limits in the correct places, the integrand and dx; the constant of integration seen; the boundary condition substituted in the question's units; the final function written in the question's variable; answers to 3 significant figures, or the full exact value when "exact" is asked.
The examiners' reports for this topic repeat a small number of comments. Many candidates do not recognise that a rate must be integrated to find the quantity; candidates who do often substitute a boundary value in the wrong units (4,000 instead of 4 when the quantity is in thousands); limits are sometimes taken from the height of a shape instead of its width; and an "exact" request is answered with a value rounded to 3 significant figures.
Practice questions
Find∫(5x4−3x2+2x−4)dx. [3]
Find∫(x36−x)dx. [3]
Find∫(3x+2)(x−4)dx. [3]
A curve has gradient function f′(x)=4x3−6x+2 and passes through (1,5)
A streaming service has N thousand subscribers t months after its launch, where dtdN=0.9t2−6t+15
A region is enclosed by the curve y=4+3x−x2 and the x-axis. (a) Find the x-intercepts of the curve. [2] (b) Write down an integral for the area of the region. [2] (c) Find the area. [1]
The curve y=0.5x2−x+4 and the line y=x+4 meet at (0,4)
A train's speed t seconds after leaving a station is v(t)=0.8t−0.004t2 metres per second, 0≤t≤100
Find the value of k, where k>1, such that ∫1k(2x+x23)dx=30
During a storm, rain falls at a rate of r(t)=1.2t−0.15t2 millimetres per hour, 0≤t≤8, where t
Answers
x5−x3+x2−4x+C
6x−3→6⋅−2x−2, so −x23−2x2+C.
Expand: 3x2−10x−8; integral x3−5x2−8x+C
f(x)=x4−3x2+2x+c; 5=1−3+2+c
(a) N=0.3t3−3t2+15t+c; at t=0
(a) x=−1 and x=4 (GDC polynomial root finder, or (4−x)(1+x)=0
Line on top (at x=2: line 6, curve 4). Area under line =21(4+8)×4=24
∫0100(0.8t−0.004t2)dt=2666.66…, about 2,670 m.
[x2−x3]1k=k2−k3−(1−3)=30
(a) 12.8. (b) A total of 12.8 mm of rain falls during the 8 hours of the storm.
Summary
Integration reverses differentiation: F(x) is an anti-derivative of f(x) when F′(x)=f(x).
∫xndx=n+1xn+1+C for integers n=−1: raise the index by 1, divide by the new index; integrate sums term by term and keep constant multiples in front.
Rewrite before integrating: xka=ax−k, expand products, split quotients; a product is never integrated factor by factor.
Every indefinite integral has +C; a boundary condition (a known point or value) fixes C. In context, substitute in the question's units.
A definite integral ∫abf(x)dx is a number: the limit of rectangle sums, equal to F(b)−F(a), with no constant.
For f(x)>0, the area under the curve from x=a to x=b is A=∫abydx
Evaluate definite integrals with the GDC, after writing the integral in full with limits, integrand and dx.
The integral of a rate over an interval is the total change in the quantity; its units are the integrand's units times the variable's units.
Area between a line and a curve = area under the upper graph − area under the lower graph, with limits at the intersections.
Self-check
To do:
I can explain why a function has infinitely many anti-derivatives that differ by a constant.
To do:
I can integrate xn for positive and negative integers n=−1, and explain why n=−1 is excluded.
To do:
I can integrate a constant, a constant multiple and a sum of terms, writing one +C.
To do:
I can rewrite xka, products of brackets and simple quotients as sums of powers before integrating.
To do:
I can check an indefinite integral by differentiating it.
To do:
I can use a boundary condition to find the constant of integration and state the final function.
To do:
I can find a quantity from its rate of change in context, substituting the known value in the correct units.
To do:
I can explain how rectangle sums approach the area under a curve.
To do:
I can explain why the area function is an anti-derivative, and why ∫abf(x)dx=F(b)−F(a).
To do:
I can write down a definite integral for an area, with limits, integrand and dx, and evaluate it with my GDC.
To do:
I can find the limits of an area from the x-intercepts or intersection points using my GDC.
To do:
I can find an unknown limit when the area is given.
To do:
I can interpret a definite integral of a rate as a total, with the correct units.
To do:
I can find the area between a line and a curve by subtracting two areas.
To do:
I can check an area against a simple enclosing shape.
where p and q are constants. Both v and its gradient dtdv are continuous at t=20.
(a)
Find the value of p and the value of q.
[4]4 marks
Markscheme (a)
dtd(0.03t2)=0.06t(M1)
p=0.06×20=1.2A1
0.03×202=20p+q, 12=24+q(M1)
q=−12A1
[4 marks]
(b)
Show that the velocity of the train is continuous at t=50.
[1]1 mark
Markscheme (b)
1.2×50−12=48A1
which equals the constant velocity 48
(c)
Write down the acceleration of the train when t=35.
[2]2 marks
Markscheme (c)
1.2 (m s−2) A2
Note: Follow through from their p.
[2 marks]
(d)
Find the distance travelled by the train in the first 50 seconds.
[4]4 marks
Markscheme (d)
∫0200.03t2dt+∫2050(1.2t−12)dt
(e)
The next station is 5 km from the first. Assuming the train does not slow down, find the time it takes the train to travel the 5 km.
[3]3 marks
Markscheme (e)
5000−980=4020 (m) travelled at 48 m s−1(M1)
484020=83.75
(f)
Comment on whether the model is realistic at t=50.
[1]1 mark
Markscheme (f)
the acceleration changes instantly from 1.2 m s−2 to 0 (the gradient is not continuous), which would be uncomfortable / is not realistic for a real train R1
[1 mark]
Question 2 · AI-00424HL only · 18 marks
A robotic floor cleaner is programmed to follow a spiral path. Its position vector, in metres, relative to its charging dock, t seconds after it starts is
r=(0.1tcost0.1tsint),0≤t≤4π.
(a)
Find the velocity vector of the cleaner at time t.
(c) Write t24=4t−2 and integrate with respect to t.
∫(0.6t2−4t−2)dt=0.6⋅3t3−4⋅−1t−1+C=0.2t3+t4+C
Check (c): dtd(0.2t3+4t−1)=0.6t2−4t−2, the integrand.
,
f(2)=9
:
99C=2(2)3−2(2)2+2+C=16−8+2+C=−1
So f(x)=2x3−2x2+x−1.
Check: f(2)=16−8+2−1=9, and f′(x)=6x2−4x+1.
Substitute x=2, y=7:
7=4+4+C⟹C=−1
The curve is y=x2+x8−1, x>0.
The units matter: 1,000 units is x=10 (hundreds), and $150,000 is P=150 (thousands).
150150C=−0.6(10)2+30(10)+C=−60+300+C=−90
So P=−0.6x2+30x−90.
(b) A profit means P>0. Use the GDC to solve −0.6x2+30x−90=0 (polynomial root finder, or the zeros of the graph):
x=3.2055…orx=46.794…
The profit is positive between these values. The smaller root, x=3.2055… hundred, is 320.55… units. The company must make a whole number of units with P>0, so the least number is 321 units. Rounding down to 320 would leave the profit slightly negative.
On the GDC, the numerical integral of x3−2x+5/x2 from 1 to 4 also gives 52.5.
Subtracting a negative value of F(1) is where errors usually happen: brackets around F(1) keep the signs right.
(b) By GDC, A=21.333…≈21.3 m2.
(c) The arch's highest point is at x=4, where y=−4+8=4, so the enclosing rectangle has area 8×4=32 m2. The arch fills part of this rectangle, and 3221.3≈0.67, about two-thirds of it. A value below 32 and well above half of it fits the shape, which is full in the middle and narrows to the ground at the ends, so the answer is reasonable.
, so the equation becomes
6k3+k=20
Solving with the GDC (graph y=6x3+x and y=20, find the intersection) gives k=4.5279….
Method 2 (GDC only). Graph y=∫0x(0.5t2+1)dt (the GDC's numerical integral with upper limit x) and y=20, and find the intersection: the same value.
So k≈4.53. Check: the area up to x=4 was 14.67, less than 20, so k must be a little more than 4.
The model predicts about 5,680 downloads in the first 30 days.
(c) It is the number of downloads between the end of day 10 and the end of day 20 (in the second period of 10 days after release). Its units are downloads per day multiplied by days, which gives downloads.
(b) By GDC, d=200. The cyclist travels 200 m.
By hand as a check: an anti-derivative is 6t+0.6t2−0.02t3, and at t=20 it equals 120+240−160=200; at t=0 it is 0.
Average speed =20200=10 m s−1. This is less than the top speed of 12 m s⁻¹ and more than the starting and finishing speed of 6 m s⁻¹, as it should be.
), so
∫13(x2−2x+6)dx=12.666…≈12.7
(c) At x=2 the line gives 7 and the curve gives 6, so the line is on top. The area between them is
14−12.666…=1.333…≈1.33 square units
The exact value is 34: the GDC integral of (2x+3)−(x2−2x+6)=−x2+4x−3 from 1 to 3 gives the same result in one step.
A1
for two correct terms,
A1
for the third; a constant of integration must be seen (can be implied by a correct final answer).
2=−0.1(0)3+0.6(0)2+0.9(0)+c(M1)
f(x)=−0.1x3+0.6x2+0.9x+2A1
(b) ∫07(−0.1x3+0.6x2+0.9x+2)dxA1A1
Note: award A1 for the correct integrand with dx, A1 for the limits 0 and 7 in the correct places. Award at most A1A0 if dx is omitted. FT from their (a).
(c) 44.625 m2A1
Note: the question asks for the exact value; do not accept 44.6.
(d) gradient =7−03.4−2=0.2(M1)
y=0.2x+2A1
(e) area under the path =21(2+3.4)×7 or ∫07(0.2x+2)dx(M1)
=18.9(A1)
44.625−18.9M1
=25.725≈25.7 m2A1
Note: FT from (c) and (d). Accept the single integral ∫07(f(x)−(0.2x+2))dx for (M1)(A1)M1.
(f) 25.725×12.5(M1)
=$321.56A1
Note: accept $321.25 from using 25.7. FT from (e).
Total [16]
.
Find
f(x)
. [4]
. At launch it had 12,000 subscribers. (a)
Find
an expression for
N
in terms of
t
. [4] (b)
Find
the number of subscribers after 10 months. [2] (c)
Justify
that the number of subscribers is always increasing. [2]
and
(4,8)
.
Find
the area of the region enclosed between them. [5]
.
Find
the distance it travels in the first 100 seconds. [3]
. [4]
is in hours. (a)
Find
∫08r(t)dt
. [2] (b)
Interpret
your answer to part (a) in context. [1]
.
,
c=5
;
f(x)=x4−3x2+2x+5
.
,
N=12
(thousands), so
N=0.3t3−3t2+15t+12
. (b)
N(10)=300−300+150+12=162
, so 162,000 subscribers. (c)
0.9t2−6t+15=0
has no real roots (discriminant
36−54<0
; or the GDC graph never meets the
t
-axis) and the rate is 15 at
t=0
, so
dtdN>0
for all
t
.
). (b)
∫−14(4+3x−x2)dx
. (c)
20.833…≈20.8
(exactly
6125
).
;
∫04(0.5x2−x+4)dx=18.666…
; area
=5.33
(exactly
316
).
, so
k2−k3=28
; GDC:
k=5.34
(5.3442…). Or graph
y=∫1x(2t+3t−2)dt
and
y=30
.
; the limits are
x
-values.
AG
[1 mark]
(M1)(A1)
=80+900(A1)
=980 (m) A1
[4 marks]
(s)
(A1)
133.75 ⇒ 134 (s) A1
[3 marks]
.
[3]3 marks
(c)
Find the speed of the cleaner when t=2π.
[2]2 marks
(d)
Find the first time t>0 at which the cleaner is moving parallel to the x-axis, and its distance from the charging dock at that time.
[4]4 marks
(e)
Find the magnitude of the acceleration of the cleaner when t=π.
[4]4 marks
(f)
Find the distance travelled by the cleaner in the first 2π seconds.
[2]2 marks
.
[2]2 marks
(d)
Find an expression for the position vector of the drone relative to O at time t.
[4]4 marks
(e)
Find the distance of the drone from its starting point when t=10.
[2]2 marks
(f)
Find the total distance flown by the drone during the 10 seconds.
[2]2 marks
(g)
Explain why your answer to part (f) is greater than your answer to part (e).
 YouTube
 YouTube