 YouTube
Use the sign of the derivative to decide where a function is increasing or decreasing, justify it at a point, write intervals of increase and decrease with a sign diagram or GDC, and interpret them in context.
Each is in the Maths AI glossary, with every other term in the subject.
A function is decreasing on an interval if, for any two values in the interval,
26 exam-style questions on this subtopic, written in the style of the IB papers. The first has its markscheme open. Counted on
The graph of , the derivative of a function , is shown for
With a free account, Augment remembers where you stopped and what you have practiced.
A function is increasing on an interval if, for any two values in the interval, , so that its graph rises from left to right.
A curve has a negative gradient at a point if its derivative there is less than zero, , so that the tangent slopes downwards from left to right and the function is decreasing.
A curve has a positive gradient at a point if its derivative there is greater than zero, , so that the tangent slopes upwards from left to right and the function is increasing.
A number line for marked with the values where a function (usually ) is zero, showing whether the function is positive or negative on each interval between them.
Determine whether a function is increasing or decreasing at a given point, and justify the answer with the sign of the derivative.
Find the intervals on which a function is increasing or decreasing, by solving and drawing a sign diagram, or with a GDC.
Interpret increasing and decreasing in context, including a quantity that increases while its rate of change decreases.
Find where a rate of change is greatest by graphing the rate with a GDC.
Much of what is said about real quantities describes direction: a company's profit is rising, a river is falling, the number of new cases of an illness is going down. In mathematics these descriptions become increasing and decreasing functions. The derivative from subtopic 5.1 gives a precise test. Where the gradient of a graph is positive the function is increasing, and where it is negative the function is decreasing.
Direction and rate are different things, and keeping them apart avoids many misreadings. The world's population has increased every single year since 1960, yet its percentage growth rate has fallen from 2.12% a year in 1963 to 0.91% in 2025. A quantity can keep increasing while the rate at which it increases goes down.
YouTubeA graph is always read from left to right, in the direction of increasing . If the graph goes up as increases, the function is increasing; if it goes down, the function is decreasing. The description applies to an interval of -values, not to the whole function, because most functions rise on some intervals and fall on others.
The definition compares any two points in the interval: a later -value always gives a larger output. This matches the everyday meaning, in which "the temperature increased between 6 a.m. and noon" means each later reading in that period was higher than each earlier one.
A function that neither increases nor decreases on an interval, such as , is constant there: its graph is horizontal. Smooth models are rarely constant over an interval, but they often have single points where the graph is momentarily flat, at the top of a hump or the bottom of a dip.
The cubic rises to a local maximum at , falls to a local minimum at , and then rises again. The -coordinates of these turning points divide the -axis into intervals on which the function is increasing or decreasing.
Reading the graph from left to right gives:
The intervals are written as inequalities in , the input, because increasing and decreasing describe what happens as moves along the axis. The same intervals can be written in interval notation, for example for . The function's values (−22 to 10) do not appear in the answer at all.
The endpoints and are where the graph is momentarily flat. Strict inequalities are the standard way to write the intervals, because at the turning point itself the function is neither rising nor falling. Both "increasing for and " and "increasing on two separate intervals" are correct descriptions; writing "increasing for or " means the same.
Whether a function is increasing depends on the direction of its graph, while whether it is positive depends on which side of the -axis the graph is. The cubic is positive near and negative near , but it is decreasing at both. A business that makes a profit every month is not necessarily growing its profit; and a temperature of −5 °C that is rising is increasing even though it is negative.
Description | Meaning on the graph | Test |
|---|---|---|
is positive | graph above the -axis | |
is negative | graph below the -axis | |
is increasing | graph rises from left to right | |
is decreasing | graph falls from left to right |
The derivative is the gradient of the tangent to the graph at . A tangent with a positive gradient slopes upwards from left to right, and close to the point of contact the curve follows its tangent, so the curve rises too.
A tangent with a negative gradient slopes downwards, and the curve falls with it. Between the two cases is the tangent with gradient 0, which is horizontal.
The three cases summarise the whole relationship between the sign of the derivative and the shape of the graph.
Sign of | Tangent | Graph of | Function |
|---|---|---|---|
slopes upwards | rises from left to right | increasing | |
horizontal | momentarily flat | neither (at that point) | |
slopes downwards | falls from left to right | decreasing |
A point where is a stationary point. It is often a local maximum or a local minimum, where the function changes from increasing to decreasing or the other way, and those points are the subject of subtopic 5.6.
Over a short step to the right of , the change in the function is approximately the gradient multiplied by the step, because the difference quotient is close to when is small.
With , the change has the same sign as . A positive derivative means the next value is larger, so the function is increasing; a negative derivative means the next value is smaller, so it is decreasing. If at every point of an interval, this happens all the way along it, and the function is increasing on the whole interval.
Drawing and one above the other, with the same -axis, makes the relationship visible. For the cubic , the derivative found with the power rule of subtopic 5.3 is .
The parabola crosses the -axis exactly at and , the -coordinates of the turning points of . Where the parabola is above the axis, the cubic is increasing; where it is below, the cubic is decreasing. Reading the sign of from its graph is often the quickest way to find intervals of increase and decrease on a GDC.
A frequent task is to decide whether a function is increasing or decreasing at one value of . The answer comes from the sign of the derivative at that value.
Find (or use the derivative given).
Substitute the value: calculate .
State the sign: or .
Conclude: increasing if , decreasing if .
The value of is irrelevant. A function can be large and decreasing, or negative and increasing; only the derivative shows the direction.
The reason for "increasing" or "decreasing" is the sign of the derivative, stated as an inequality. A sentence such as ", which is less than 0, so is decreasing at " contains the evidence (the value), the reason (its sign) and the conclusion. Writing only "decreasing" gives no evidence, and writing only "the gradient is −4" leaves out the reasoning that connects the number to the conclusion.
When the derivative is a function that is awkward to evaluate, or only its graph is known, the sign can be read from the graph of . A point on the graph of that lies below the -axis (in the fourth quadrant for positive ) shows . A quick sketch of on the GDC, with the point marked, shows the sign just as clearly as a calculation.
The same reading gives whole intervals. The graph of the gradient function of a function crosses the -axis at , and ; between those values it lies alternately below and above the axis.
To find every interval on which a function increases or decreases, the -axis is split at the points where the derivative can change sign. For polynomials these are the solutions of , because a polynomial's derivative is a smooth curve and cannot change from positive to negative without passing through 0.
Find .
Solve , by factorising or with the GDC. These -values are the critical values.
Mark the critical values on a number line, which splits it into intervals.
Find the sign of in each interval, from the factors or by substituting one test value from inside the interval.
Write the intervals where (increasing) and where (decreasing), using strict inequalities in
The number line with the signs of recorded on it is called a sign diagram. It organises the working and shows the reasoning clearly.
For , the derivative is , which is zero at and . The sign diagram records the sign of each factor and of their product on each interval.
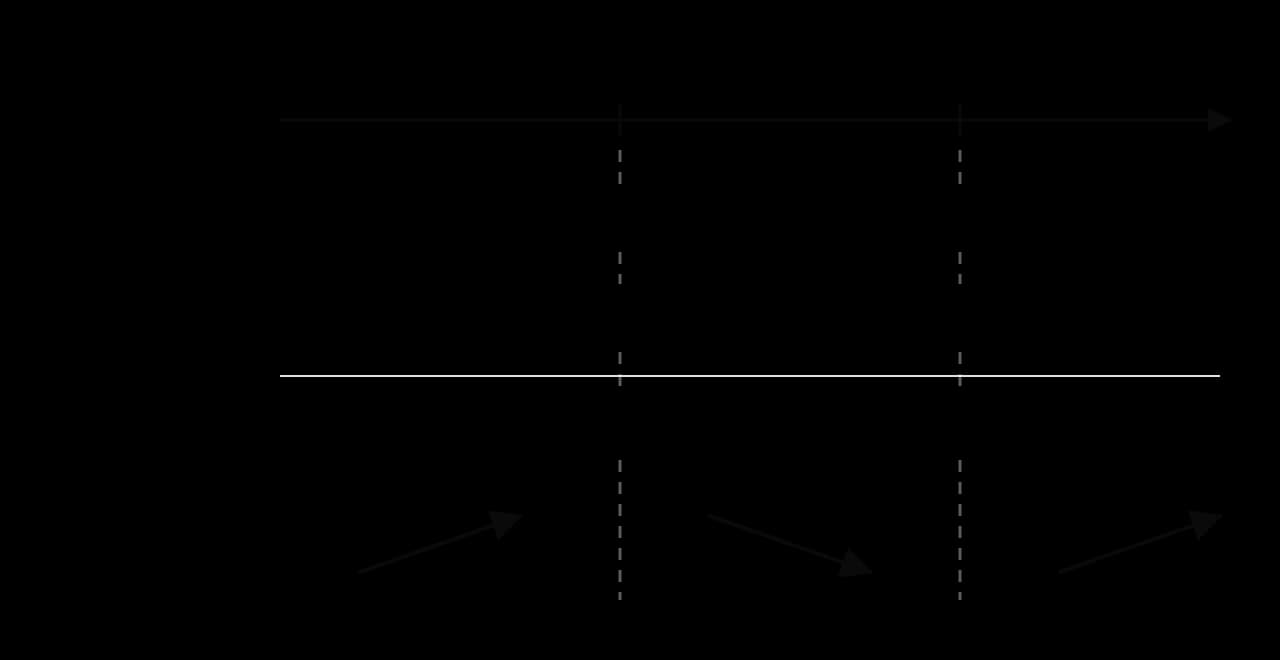
Reading the arrows of the sign diagram gives the answer: is increasing for and for , and decreasing for . As a check, a test value from each interval gives , and , matching the signs in the diagram.
When does not factorise, the GDC finds the critical values. Two approaches give the same answer.
Graph the derivative. Enter (found by hand) or the GDC's numerical derivative of as a function, graph it, and find its zeros with the zero (root) tool. The derivative is positive where its graph is above the -axis.
Graph the function. Graph and find its turning points with the maximum and minimum tools. The -coordinates of the turning points are the critical values, and the graph shows directly where it rises and falls.
Either way, the endpoints of the intervals are given to 3 significant figures unless they are exact. The working written down states what was graphed and what was found, for example "zeros of from the GDC: and ".
Models usually have a domain that stops at one or both ends, such as . The intervals of increase and decrease then end at the edges of the domain, and the endpoint of the domain is included if the domain includes it. If for a golf ball's range metres and launch angle degrees with , the derivative is zero at . It is positive for smaller angles and negative for larger ones, so the range increases for and decreases for .
In context, increasing the launch angle increases the range up to 42°, and beyond that a steeper launch sends the ball higher but less far.
Some functions have no critical values at all, or have a derivative that is never negative. For , the derivative is always at least 2, because . So for every and the function is increasing for all real . Exponential growth models are another family of functions that increase everywhere.
A function can even be increasing everywhere while its derivative is zero at a single point. For , , which is 0 at and positive everywhere else. The graph flattens momentarily at the origin but keeps rising, so is increasing for all . A zero of the derivative is a place where the direction might change, and the sign diagram shows whether it does.
 YouTube
In a model, "increasing" and "decreasing" become statements about a real quantity, and the interval becomes a period of time, a range of prices or a range of sizes. An interpretation names the quantity, the direction and the interval, with units.
A ball is thrown upwards, and its height in metres after seconds is modelled by . The ball is rising while its height is increasing, which is while .
The ball rises for and falls from until it lands at seconds, when . The domain of the model is , so the decreasing interval is . After it lands, the formula gives negative heights, which have no meaning.
The difference between a quantity and its rate of change is especially clear in business contexts. A bakery's daily profit from selling cakes is modelled by dollars, so . For , , so selling more than 36 cakes a day reduces profit, perhaps because extra sales need discounts or overtime.
A related task is to find when a quantity is increasing fastest. That is where its rate of change, the derivative, takes its greatest value. If the rate is given as a function, its greatest value is found by graphing the rate itself on the GDC and using the maximum tool: there is no need to differentiate the rate by hand.
The world's population is a quantity that has increased every year on record, while the rate at which it grows has changed a great deal. World Bank estimates of the world population at the middle of each year show both features.
Year | 1963 | 1970 | 1980 | 1990 | 2000 | 2010 | 2020 | 2025 |
|---|---|---|---|---|---|---|---|---|
Population (billions) | 3.184 | 3.680 | 4.437 | 5.299 | 6.162 | 7.001 | 7.854 | 8.215 |
Increase in that year (millions) | 66.7 | 75.8 | 77.5 | 91.6 | 83.5 | 84.7 | 76.7 | 74.5 |
Growth rate (% a year) | 2.12 | 2.08 | 1.76 | 1.74 | 1.36 | 1.22 | 0.98 | 0.91 |
Source: World Bank, World Development Indicators, Population, total (SP.POP.TOTL) and Population growth, annual % (SP.POP.GROW), world series, updated 2026.
Let be the world population years after 1960. The yearly increase, the change in over one year, is a difference quotient with and estimates in people per year. In the World Bank series every yearly increase from 1961 to 2025 is positive, so throughout and the population is an increasing function of time over the whole period.
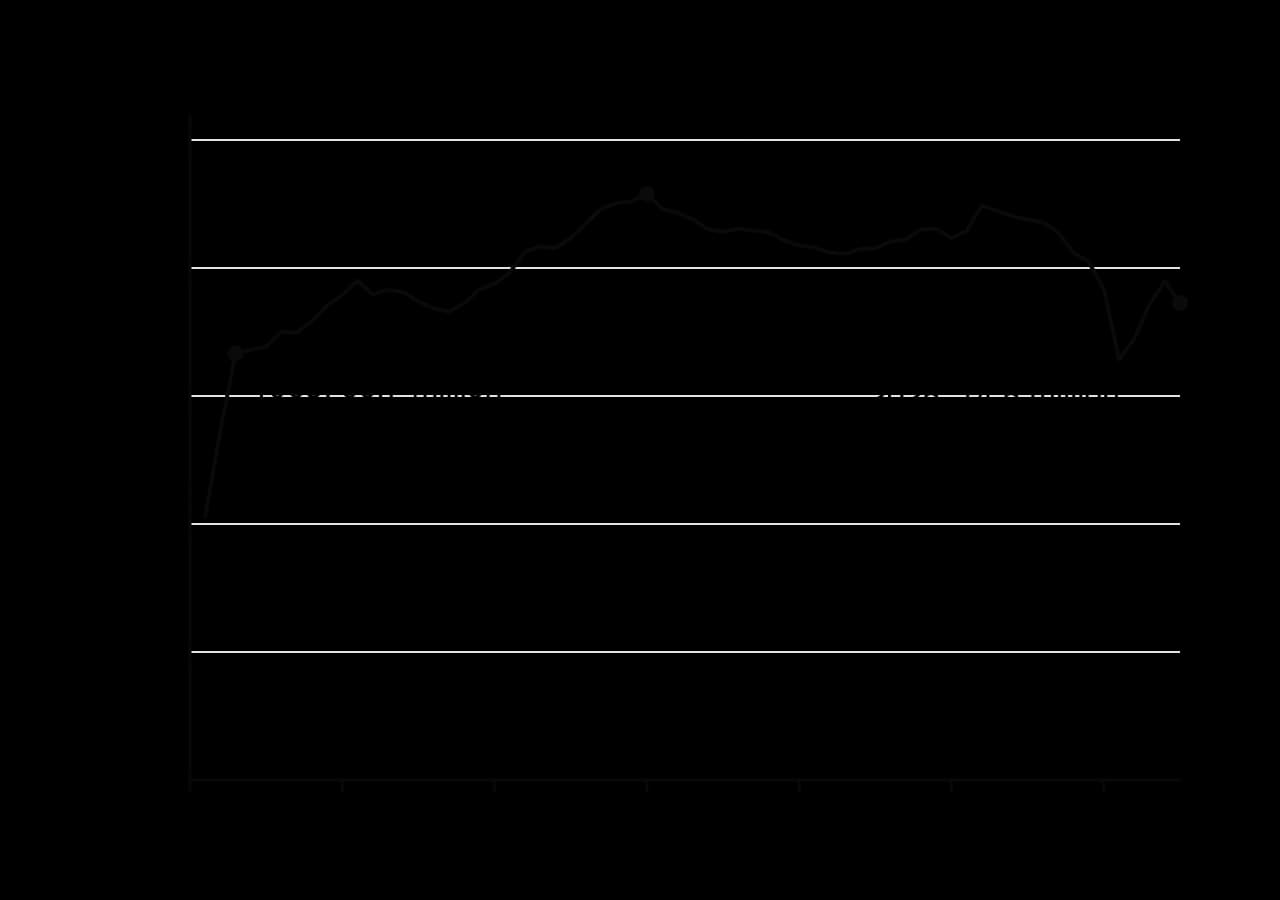
The graph of the yearly increase shows the rate of change of the population. The yearly increase rose to a peak of 91.6 million people a year in 1990 and has since fallen, with a sharp dip around 2021. So since 1990 the population has been increasing while its rate of increase decreases: the population graph is still rising, but less steeply than at its steepest. The percentage growth rate, which compares each year's increase with the size of the population, has fallen even further, from 2.12% in 1963 to 0.91% in 2025, because the same number of extra people is a smaller fraction of a larger population.
"The population is decreasing" would be false: is still positive, so the population is still increasing.
"Population growth is slowing" is true, and it is a statement about the rate (or the percentage rate), not about .
The population will only start to decrease when the yearly increase falls below zero, that is, when changes sign. On the graph of the yearly increase, that would be the moment the line crosses the horizontal axis.
The figures are estimates built from censuses and surveys, so small year-to-year changes in the increase may reflect revisions of the data as well as real changes.
Increasing and decreasing functions appear on Paper 1 and Paper 2, usually as one or two parts worth 1 to 3 marks inside a longer question on differentiation, stationary points or integration. The command terms are determine, justify, state (often "with a reason"), write down and find.
The recurring question shapes are:
determine whether a quantity is increasing or decreasing at a given value, from a given rate or after differentiating;
justify that a function is increasing or decreasing at a point, using the sign of ;
write down or find the interval(s) on which a function is increasing or decreasing, from a graph, from or from turning points found with the GDC;
describe how a quantity in context changes over a range of values (for example profit between two production levels) and justify it;
find when a rate is greatest by graphing the rate with the GDC.
The markscheme for "determine whether … increasing or decreasing" gives a method mark for the value or sign of the derivative and an accuracy mark for the conclusion. "Decreasing" alone, with no working, scores nothing, because it could be a guess. A sketch of the graph of the derivative with the relevant point marked below the axis is also accepted as the evidence.
When a question uses a context, the conclusion should use it too: "the profit is decreasing", "the river level is falling", not just " is decreasing". If an earlier part's derivative was wrong, a correct method in this part still earns follow-through marks, so the sign test should always be written out.
The graph of is a cubic with a local maximum at and a local minimum at , and as . Write down the intervals on which is (a) increasing, (b) decreasing. [3]
For a function , . Determine whether is increasing or decreasing at
A function has and . State, with a reason, whether
Let . (a) Show that
Let . (a) Write down
The depth of water in a harbour, metres, hours after midnight, changes at a rate
A firm's profit from selling units is dollars. (a) Find
Spectators enter a stadium at a rate of people per minute, minutes after the gates open. Find the time at which the number of spectators inside is increasing fastest, and the rate at that time. [3]
Show that is increasing for all . [3]
A news report says, "The rate of inflation fell from 6% to 4% this year, so prices are going down." Explain why the conclusion is wrong, using the language of increasing functions and rates of change. [2]
(a) and . (b) .
, so is decreasing at .
Increasing, because (the negative value of is irrelevant).
(a)
(a) . (b) Zeros from the GDC:
gives and
(a) . (b) For ,
GDC maximum of : minutes, rate 524 people per minute.
; since
The inflation rate is the rate of change of prices. A rate of 4% is still positive, so prices are still increasing, only more slowly than before; prices fall only if the rate becomes negative.
A function is increasing on an interval if its graph rises from left to right there, and decreasing if it falls.
on an interval means is increasing there; means is decreasing; means the tangent is horizontal at that point.
To decide the direction at : calculate , state its sign, conclude. The reason is the sign, not the value, and is irrelevant.
To find intervals: solve (by factorising or GDC), draw a sign diagram with a test value in each interval, and write the intervals where or
Intervals are written in , with strict inequalities at turning points and domain endpoints included when the domain includes them; interval notation is also correct.
Increasing is not the same as positive: a positive quantity can be decreasing and a negative one increasing.
A quantity can increase while its rate of change decreases (world population since 1990).
A quantity increases fastest where its rate is greatest: graph the rate on the GDC and find its maximum.
I can read the intervals of increase and decrease from a graph and write them in .
I can explain the difference between a function being positive and being increasing.
I can explain why means the graph rises.
I can determine whether a function is increasing or decreasing at a point and justify it with the sign of .
I can solve by factorising and with my GDC.
I can draw a sign diagram for and use test values to check it.
I can write intervals of increase and decrease with correct inequalities, including on a restricted domain.
I can show that a function is increasing for all by showing everywhere.
I can describe how a quantity in context changes over an interval and justify my answer.
I can find when a quantity is increasing fastest by graphing its rate on the GDC.
I can explain how a quantity can increase while its rate of change decreases.
Write down the -coordinate of the local maximum point of the graph of . Give a reason for your answer.
2 marks
A1
changes from positive to negative at R1
Note: Do not award A1R0 for an answer with no reason, or with the reason "" alone. The reason must refer to the change of sign of (or increasing then decreasing).
[2 marks]
Write down the -coordinates of the local minimum points of the graph of .
2 marks
and A1A1
Note: Award
Write down the intervals in which is decreasing.
2 marks
A1
The volume of water in a reservoir, million m³, months after 1 January, is modelled by
The graph of is shown below.
Calculate the average rate of change of the volume of water in the reservoir during the first 12 months.
2 marks
Find .
2 marks
Find the value of
The concentration of a drug in a patient's blood, milligrams per litre (mg L⁻¹), hours after it is taken, is modelled by
Find the concentration of the drug 2 hours after it is taken.
2 marks
Find the maximum concentration of the drug and the time at which it occurs.
2 marks
Use your graphic display calculator to find and
Because at , the profit is decreasing three years after the company was founded, at $6,000 per year.
(b)
Because at , the profit is increasing after six years, at $15,000 per year.
(b) , so is increasing at , even though is negative. The graph is below the -axis but rising.
(b) , because changes from positive (for ) to negative (for ) there. This point is a local maximum of (subtopic 5.6).
(c) For , , so is decreasing between and . Therefore .
The heights of the graph of do not give the values of ; only the signs are needed to compare and .
(b) Solve : or . These split the number line into three intervals.
Interval | |||
|---|---|---|---|
test value | |||
sign of | + | − | + |
increasing | decreasing | increasing |
is decreasing for , the only interval on which .
(c) The graph of is a parabola opening upwards, so it is above the -axis outside its two zeros. is increasing for and for .
As a check, the GDC's graph of has a local maximum at about and a local minimum at about , so it rises, falls and rises again, as the intervals say.
(b)
The profit falls from $448 to $160 a day. It is still positive, so the bakery still makes a profit at 60 cakes a day: the profit is positive but decreasing. Whether the bakery makes a loss depends on the sign of , while the direction of change depends on the sign of .
(b) The volume increases fastest when is greatest. Graph on the GDC for and use the maximum tool:
The lake is filling fastest about 1.96 hours (1 hour 57 minutes) after the rain stops, at about 28,800 m³ per hour. After that the volume keeps increasing, but more and more slowly.
the number of bees is decreasing A1
Note: award A0 for "decreasing" with no working.
(b) (M1)
, A1
(c) A1, A1
Note: accept and ; accept interval notation. Award at most A1A0 if the intervals are written in or in .
(d) minimum of from the GDC graph, at (M1)
decreasing at 2.4 thousand bees per week (2400 bees per week) when A1
(e) A1
is increasing for and decreasing for ( changes from positive to negative at ) R1
Total [10]
[2 marks]
Note: Accept inclusive or strict inequalities at , and . Award A1A0 for only.
[2 marks]
2 marks
Interpret your answer to part (c)(i) in the context of the question.
1 mark
Explain why the answer to part (a) gives little information about how the volume of water changed during the first 12 months.
2 marks
Find the values of for which the volume of water in the reservoir is decreasing.
4 marks
The water company issues a drought warning if the volume of water falls below 70 million m³. Determine whether the model predicts a drought warning during these 15 months.
2 marks
3 marks
Find the average rate of change of the concentration between and .
2 marks
Find and . Hence write down the limit of as .
2 marks
A doctor is concerned when the concentration is falling at a rate of more than 1 mg L⁻¹ per hour.
Find the length of time during which the concentration is falling at a rate of more than 1 mg L⁻¹ per hour.
4 marks