Notes on 5.10 The second derivative
Learning objectives
Find the second derivative of a function, writing it as or .
Interpret the second derivative as the rate of change of the gradient, with units, in context.
Determine the intervals on which a graph is concave up or concave down from the sign of .
Find the points of inflexion of a graph, checking that the concavity changes, and distinguish stationary from non-stationary points of inflexion.
Explain why does not by itself show that there is a point of inflexion at .
Use the second derivative test to justify whether a stationary point is a local maximum or a local minimum, and use the first derivative test when the second is inconclusive.
Find a point of inflexion with technology as a maximum or minimum of the graph of .
Interpret a point of inflexion in context as the point where a quantity is changing fastest or slowest.
Introduction
The first derivative of a function gives its rate of change: how fast a population grows, how quickly a price rises, how steep a road is. The second derivative goes one step further and measures how that rate is itself changing. A car whose speed is increasing is accelerating; a price index that is still rising, but more slowly each month, has a positive first derivative and a negative second derivative. Many statements in science and the news ("growth is slowing", "the curve is flattening", "the decline is accelerating") are statements about second derivatives.
Graphically, the second derivative describes the way a curve bends. It decides whether a stationary point is a peak or a trough without testing points on either side, and it locates the points of inflexion where a curve changes its bend, which in a real situation often mark the time when an epidemic spreads fastest or when a population grows most quickly.
The second derivative
Differentiating twice
The derivative is itself a function of , so it can be differentiated again. The result is the second derivative.
Both notations are in common use. Lagrange's notation (read "f double dash of x" or "f two prime of x") is shorter. Leibniz's notation records how it is built.
The 2 is written on the d at the top, because the operation "differentiate with respect to " has been applied twice, and on the at the bottom, because appears twice in the denominator of the repeated quotient. It is not a square:
With the functions of subtopic 5.9, the second derivative often needs the chain rule or the product rule twice. Simplifying and factorising the first derivative before differentiating again makes the second step much shorter.
What the second derivative measures
The first derivative is the gradient of the curve, or the rate of change of . The second derivative is the rate of change of that gradient. Its units are the units of divided by the units of twice.
Quantity | Symbol | Meaning | Units if is in metres and in seconds |
|---|---|---|---|
Function | displacement | m | |
First derivative |
Acceleration is the most familiar second derivative: it is the rate at which velocity changes, and so the second derivative of displacement. Subtopic 5.13, Kinematics, develops it in full. In an economic context, if dollars is the cost of making items, is the cost of one more item in dollars per item and
 YouTube
The signs of the two derivatives together describe how a quantity behaves.
Behaviour of | Everyday description | ||
|---|---|---|---|
A negative second derivative does not mean that the quantity is falling. "Rising, but more slowly" is a positive first derivative with a negative second derivative.
Concavity in the news: falling inflation
A price index measures the price of a typical basket of goods at time . The rate of inflation is the percentage increase of the index over the previous 12 months, so it is a measure of how fast prices are rising, a first derivative in relative form. When inflation falls but stays positive, prices are still rising, , but more slowly, so the gradient is decreasing and
The United States consumer price index in the first half of 2023 is an example.
Month (2023) | Jan | Feb | Mar | Apr | May | Jun |
|---|---|---|---|---|---|---|
CPI-U index (1982–84 = 100) | 299.170 | 300.840 | 301.836 | 303.363 | 304.127 | 305.109 |
12-month inflation rate | 6.4% | 6.0% | 5.0% | 4.9% | 4.0% | 3.0% |
Source: US Bureau of Labor Statistics, Consumer Price Index for All Urban Consumers (CPI-U), all items, not seasonally adjusted (series CUUR0000SA0), 2024. Inflation rates calculated from the index 12 months earlier.
Every month the index was higher than the month before, so prices never stopped rising. Over the same six months the 12-month inflation rate fell from 6.4% to 3.0%, so the rise over a year roughly halved. The flattening shows clearly over a longer span: the index rose by about 24.6 points from June 2021 (271.696) to June 2022 (296.311), but by only about 8.8 points from June 2022 to June 2023. On a graph of the index over those two years the curve keeps rising but its gradient falls, so it is concave down. Month-to-month steps in unadjusted data are uneven, so the concavity shows in the trend rather than in every single step. In a news report, "inflation is falling" therefore describes a negative second derivative of prices while the first derivative stays positive.
Concavity
Concave up and concave down from the sign of f″
Subtopic 5.8, The trapezoidal rule, describes a curve as concave up when it bends upwards, with every chord above it, and as concave down when it bends downwards, with every chord below it. The second derivative turns this description into a test.
If on an interval, the gradient is increasing there: moving from left to right, the tangent turns anticlockwise, steepening if it slopes up and flattening if it slopes down. A curve whose tangents turn anticlockwise bends upwards, so it is concave up. If
Two pictures help to remember the difference. A concave-up curve is shaped like a cup and would hold water; a concave-down curve is shaped like a cap. A concave-up curve also lies above each of its tangents, and a concave-down curve lies below each of its tangents, which shows that a tangent-line estimate of is too small on a concave-up curve and too large on a concave-down one.
The graph of with two tangents shows both shapes. Here
Finding intervals of concavity
To find where a graph is concave up or concave down:
Find .
Solve (and note any where
A sign diagram of records the result in the same way as the sign diagram of in subtopic 5.2.
Points of inflexion
Where the concavity changes
A point of inflexion is a point where the curve changes from bending one way to bending the other. On the graph of it is the point : the curve is concave down to its left and concave up to its right. At such a point the tangent crosses the curve, passing from one side of it to the other.
Because is positive on one side of a point of inflexion and negative on the other, a continuous must pass through zero there. Every point of inflexion of a function with a continuous second derivative therefore has
When f″ = 0 is not enough
For ,
The method for finding points of inflexion therefore has a checking step.
Find and solve .
For each solution
Stationary and non-stationary points of inflexion
A point of inflexion may or may not also be a stationary point. At the origin on , the gradient is , so the tangent is horizontal: the curve flattens momentarily and then continues to rise. At
At a stationary point of inflexion, has the same sign on both sides ( or ), so it is a stationary point that is neither a maximum nor a minimum.
The point of fastest change
A point of inflexion has a second meaning that matters in applications. Because , a zero of
The three graphs of a drug concentration , its derivative and its second derivative, drawn with the same horizontal axis, show how the features line up.
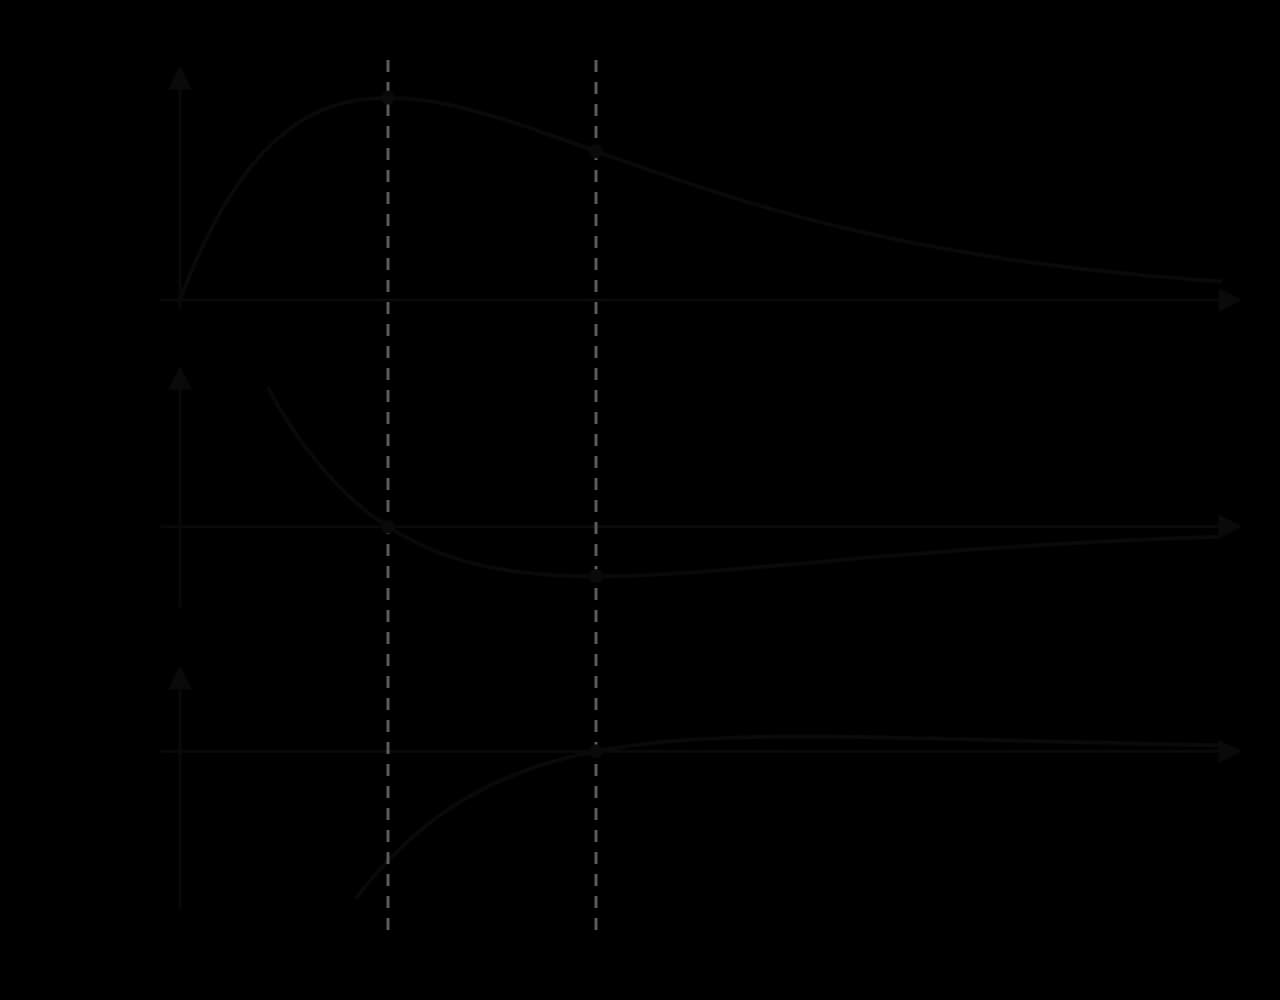
On the graph of | On the graph of | On the graph of |
|---|---|---|
Local maximum or minimum | zero (crosses the axis) | |
Point of inflexion | local maximum or minimum |
This connection gives the technology method. To find a point of inflexion with a GDC, graph , either typed in after differentiating by hand or with the GDC's numerical derivative (on a TI-84 Plus CE, nDeriv( from the MATH menu), and find its local maximum or minimum. The -coordinate is the -coordinate of the point of inflexion. Alternatively, graph
 YouTube
The second derivative test
Classifying stationary points with f″
Subtopic 5.6, Stationary points, decides whether a stationary point is a local maximum or a local minimum with the first derivative test: the sign of on either side. The second derivative gives a quicker test that uses only the stationary point itself.
At a stationary point , . If
The test works in the same way for the functions of subtopic 5.9, where solving may need logarithms or trigonometry. Radians are used throughout.
When the test is inconclusive
If at a stationary point, the second derivative test gives no information. The three functions ,
Function | Sign of |
|---|
Choosing between the tests
Both tests are valid ways to justify the nature of a stationary point; the choice depends on the function.
First derivative test | Second derivative test | |
|---|---|---|
What is checked | sign of just left and right of | sign of |
In optimisation problems (subtopic 5.7), the second derivative test is often the neatest justification that an answer is a maximum or a minimum, especially when has the same sign for every value in the domain.
Interpreting the second derivative in context
Logistic growth and the inflexion at half the carrying capacity
A population with limited resources often follows a logistic model, growing slowly at first, then quickly, then slowly again as it approaches the carrying capacity .
The S-shaped curve has a single point of inflexion, and the second derivative shows where it is. Differentiating with the chain rule and rearranging gives a neat form of the first derivative.
Show why the two forms are equal
From the model,
Differentiating with respect to , with the chain rule on
The factor is always positive, so
The logistic curve and the line at half its carrying capacity show the inflexion where the bend changes.
Epidemic curves
The same S-shape appears in the cumulative number of cases in an epidemic wave. While each day brings more new cases than the day before, the cumulative curve is concave up; once daily new cases start to fall, it becomes concave down. The point of inflexion of the cumulative curve is the day on which daily new cases peak, because daily new cases are the gradient of the cumulative curve. "Flattening the curve" means lowering the peak of the daily curve, which makes the cumulative curve less steep at its inflexion. Subtopic 5.6, Stationary points, studies the peak of the daily curve as a stationary point; the cumulative curve shows the same moment as a change of concavity.
Describing change in words
Interpreting in context means saying what happens to the rate, with the variables and units of the problem. A few model sentences:
" for
Exam focus
The second derivative appears on HL papers in short parts of 2–4 marks, usually inside a longer question on a model: find , find the point of inflexion, justify that a point is a maximum, or find where the graph is concave down. Paper 2 and Paper 3 questions use it to interpret a model, for example the time at which a quantity changes fastest. The functions usually need the product or chain rule from subtopic 5.9.
Markschemes award (M1) for an attempt to set or an equivalent graphical method (a sketch of with its -intercept marked, or the local maximum of
The most common error is solving the wrong equation for a point of inflexion. Examiners report many candidates setting the function or its first derivative equal to zero instead of the second derivative, and many errors in applying the product rule a second time.
In context questions, the inflexion is a statement about the rate. A growth curve's inflexion marks the time of fastest growth, which comes before the largest value, and an answer must name the quantity and the rate ("sales are increasing most rapidly").
Practice questions
Let . Find
Answers
Summary
The second derivative
Self-check
- To do:
I can find the second derivative of polynomials and of functions needing the product or chain rule.
- To do:
I can use and read both notations and