4.5 Concepts of probability · IB Maths AA | Augment Education
4.5 Concepts of probability
Describe trials, outcomes, sample spaces and events, find probabilities from equally likely outcomes and from relative frequency, use complementary events, and calculate the expected number of occurrences np.
IB Mathematics: Analysis and Approaches
Part of 4 Statistics and probability
SL and HL
Key terms introduced here
Each is in the Maths AA glossary, with every other term in the subject.
An event A and the event A′ ("not A"), which contains every outcome in U that is not in A. Exactly one of them occurs, so P(A)+P(A′)=1
Notes on 4.5 Concepts of probability
26 min readLast reviewed
Questions on 4.5
46 exam-style questions on this subtopic, written in the style of the IB papers. The first has its markscheme open. Counted on
Question 1 · AA-003846 marks
A bakery produces 1500 loaves of bread each day. The loaves leave the oven one at a time on a conveyor belt and are numbered 1 to 1500 in the order in which they leave. A quality inspector wants to check a sample of 60 loaves each day using systematic sampling.
(a)
Describe how the inspector should select the sample.
[2]2 marks
Markscheme (a)
sampling interval k=601500=25
Try a quick-fire question
One of 38 short multiple-choice questions on 4.5. Pick an answer to see why it's right or wrong.
In probability, what is the sample space of a trial?
From the formula booklet
The entries of the mathematics: analysis and approaches formula booklet that 4.5 uses. Each opens in the explained booklet.
A set of outcomes from the sample space, such as "an even number" when a die is rolled. An event occurs when the outcome of the trial is one of its outcomes.
Imitating a random process with random numbers (from a calculator, a computer, dice or a table) so that a probability can be estimated by relative frequency.
A single performance of an experiment whose result is uncertain, such as one roll of a die or one toss of a coin.
.
Use P(A)+P(A′)=1 to find the probability of a complementary event, including "at least one" problems.
Estimate probabilities from relative frequencies, and explain the difference between theoretical and experimental probability.
Describe the law of large numbers and use a simulation to estimate a probability.
Calculate the expected number of occurrences np and interpret it in context.
Probability is the branch of mathematics that measures uncertainty. It assigns to every possible event a number between 0 and 1 that describes how likely the event is, so that chance can be reasoned about with the same precision as length or mass. Probability models are used to set insurance premiums, to judge whether a new medicine works better than an old one, to forecast the weather and to control the quality of manufactured goods.
The ideas introduced here form the vocabulary for all later work on probability: combining events with diagrams, conditional probability, and random variables such as the binomial and normal distributions.
Trials, outcomes and sample spaces
The language of probability
Probability describes situations whose result cannot be predicted with certainty: tossing a coin, rolling a die, choosing a person at random from a crowd, testing whether a light bulb is faulty. Each of these is a trial, and each possible result of the trial is an outcome. Exactly one outcome occurs every time the trial is carried out.
The sample space is written as a list of outcomes inside curly brackets. For one roll of an ordinary six-sided die,
U={1,2,3,4,5,6},n(U)=6.
The event "the score is even" is the set A={2,4,6}, so n(A)=3. An event occurs when the outcome of the trial is one of the outcomes in it: a roll of 4 means that A has occurred, and a roll of 5 means that it has not.
Listing a sample space systematically
When a trial has several stages, such as tossing a coin more than once, the outcomes must be listed in an order that guarantees none is missed or repeated. A common method is to fix the first stage and run through every possibility for the later stages, then move to the next value of the first stage.
For two tosses of a coin, writing H for heads and T for tails, the outcomes are
U={HH,HT,TH,TT}.
The outcomes HT and TH are different: in HT the first toss shows heads, and in TH the first toss shows tails. Treating them as one outcome ("one head and one tail") would make the sample space wrong and every probability calculated from it incorrect.
Larger sample spaces, such as the 36 outcomes when two dice are rolled, are easier to organise in a grid or a tree than in a list. These diagrams are developed in 4.6.
The probability of an event
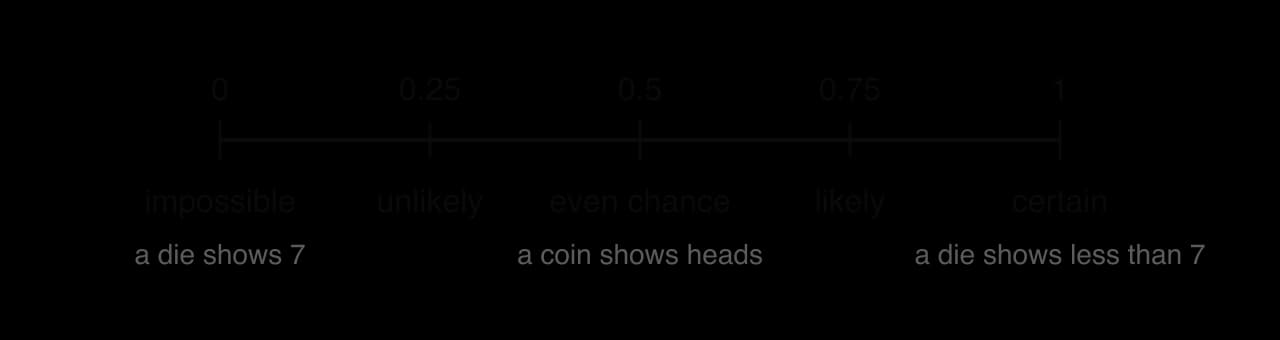
The probability scale
The probability of an event A is written P(A). It is always a number from 0 to 1 inclusive:
0≤P(A)≤1.
An event that cannot happen, such as rolling a 7 on an ordinary die, has probability 0. An event that is certain to happen, such as rolling a score less than 7, has probability 1. Probabilities may be written as fractions, decimals or percentages, so 41, 0.25 and 25% all describe the same chance.
Every probability lies on this scale. A value outside 0 to 1 signals an error in the working.
Equally likely outcomes
Many simple trials have outcomes that all have the same chance of occurring. A fair die is equally likely to land on any of its six faces, and a card shuffled into a well-mixed pack is equally likely to be any of the cards. In this situation the probability of an event is the fraction of the outcomes that belong to it.
This formula gives a theoretical probability: it comes from reasoning about the trial, not from carrying it out. The phrase "at random" in a question means that every item has the same chance of being chosen, so it signals that the outcomes are equally likely. Words such as "fair" (a fair coin, a fair die) and "unbiased" mean the same.
Simplifying a fraction does not change the probability, and either form is correct. A simplified fraction makes it easier to compare probabilities and to spot errors.
Problems with an unknown number of outcomes
Some questions give a probability and ask for the number of items that produces it. Setting n(U)n(A) equal to the given probability produces an equation that can be solved for the unknown.
Counting outcomes in a range of numbers
When a whole number is chosen at random from a range, the sample space is the list of whole numbers in that range. Counting the outcomes in the event carefully is the main step, and writing them out is the safest way to do it.
Complementary events
For any event A, the event "A does not occur" is written A′ and read "A prime" or "not A". It contains every outcome in the sample space that is not in A.
The Venn diagram shows why. The sample space U is the rectangle, the event A is the circle, and A′ is everything else. Every outcome lies in exactly one of the two regions, so n(A)+n(A′)=n(U). Dividing by n(U) gives P(A)+P(A′)=1 when the outcomes are equally likely, and the result holds for all probabilities.
A and its complement A′ fill the whole sample space without overlapping, so their probabilities add up to 1.
Rearranging gives the form used most often:
P(A′)=1−P(A).
This is useful whenever the complement is easier to count than the event itself, as in the next example.
The complement of a complement
The complement of A′ is A itself, written (A′)′=A. The complement of the whole sample space is the empty event, which has probability 0. These facts follow from the definition and are used when simplifying expressions with Venn diagrams in 4.6.
Experimental probability and relative frequency
Relative frequency
Theoretical probability relies on knowing that the outcomes are equally likely. For many real trials this is not true or cannot be checked: a drawing pin may land point up or on its side, a basketball player may score or miss a free throw, a manufactured part may or may not be faulty. In these cases the probability is estimated by carrying out the trial many times and recording how often the event occurs.
A relative frequency is always between 0 and 1, like a probability. It depends on the particular trials carried out, so two experiments usually give slightly different relative frequencies for the same event, while the true probability stays fixed.
A drawing pin dropped onto a table lands either point up or on its side, and there is no reason to expect these two outcomes to be equally likely. A student drops a pin repeatedly and records the running total of the times it lands point up.
Number of drops
20
50
100
200
Number of times point up (cumulative)
12
28
57
111
Theoretical and experimental probability
The two kinds of probability answer the same question in different ways.
Theoretical probability
Experimental probability
How it is found
By reasoning about equally likely outcomes, n(U)n(A)
From data, as a relative frequency
Needs
A model in which the outcomes are known to be equally likely
A record of many repeated trials
Exact?
Exact, if the model is correct
An estimate that changes from one experiment to another
Examples
A fair die, a well-shuffled pack, a random choice from a list
A drawing pin, a free-throw success rate, the lifetime of a battery
Experimental results can also be used to test a theoretical model. If a die is rolled 600 times and a six appears 160 times, the relative frequency 600160≈0.267 is far from 61≈0.167. This is evidence that the die is biased, and the assumption of equally likely outcomes should be questioned. A small difference, on the other hand, is expected even for a fair die.
The law of large numbers
When a trial is repeated only a few times, the relative frequency can be far from the true probability. As the number of trials increases, the relative frequency tends to settle down and get closer to the probability. This result is called the law of large numbers.
The graph shows two simulated runs of 1000 rolls of a fair die, with the relative frequency of a six recalculated after every roll. For the first fifty or so rolls both runs swing widely, between 0 and more than 0.3. After several hundred rolls both stay close to 61.
Two simulated runs (solid and dotted) of 1000 rolls of a fair die. The early relative frequencies differ greatly; with more rolls both settle near 1/6.
A real experiment shows the same behaviour. The mathematician John Kerrich tossed a coin 10000 times while interned during the Second World War. After 100 tosses he had 44 heads, a relative frequency of 0.44; after all 10000 tosses he had 5067 heads, a relative frequency of 0.5067.
Number of tosses
Number of heads
Relative frequency of heads
100
44
0.44
10000
5067
0.5067
Source: J. E. Kerrich, An Experimental Introduction to the Theory of Probability (1946).
The law describes the long run only. The number of heads did not become exactly half of the tosses: after 10000 tosses Kerrich had 67 more heads than half. The proportion of heads gets closer to 0.5, even though the difference between the count and half the tosses need not shrink.
Simulations
Some probabilities are hard to calculate and slow or expensive to measure directly. A simulation imitates the real trial with random numbers, generated by a calculator, a computer, a table of random digits, dice or coins. Repeating the simulated trial many times gives a relative frequency that estimates the probability.
To design a simulation:
Assign random numbers to the outcomes so that their probabilities match the real situation.
Decide what counts as one trial and what counts as the event occurring.
Carry out many trials, and record whether the event occurs in each.
Calculate the relative frequency of the event.
Simulations are an example of mathematical modelling. The result can only be as good as the model: if births were not equally likely to be boys and girls, the simulation would need a different assignment of digits, such as 000 to 511 for boys out of 000 to 999.
Expected number of occurrences
If a fair die is rolled 600 times, about one-sixth of the rolls are expected to show a six, which is 100 sixes. In general, if an event has probability p on each trial, the long-run proportion of trials in which it occurs is p, so in n trials it is expected to occur about np times.
The expected number is a long-run average, not a prediction of the exact count. Rolling a die 600 times will rarely give exactly 100 sixes, but if the 600 rolls were repeated many times, the average number of sixes would be close to 100. For the same reason the expected number does not have to be a whole number.
Expected numbers from relative frequencies
When the probability is unknown, a relative frequency can be used in its place. This is how factories estimate the number of faulty items in a large batch from a small sample, and how insurers predict the number of claims they will receive.
Finding the number of trials or the probability
The formula np links three quantities, so knowing any two of them gives the third. Questions may give the expected number and ask for n or for p.
Exam-style questions on probability concepts
Questions on these ideas are often short and are usually set where a graphic display calculator (GDC) is not allowed, so fractions should be handled confidently by hand. They also appear as the first parts of longer questions on combined events or random variables.
A typical short question gives a table of probabilities with an unknown, such as this one for a spinner with four coloured sections.
Colour
Red
Blue
Green
Yellow
Probability
0.25
2k
k
0.15
Longer questions combine counting with a parameter and the expected number formula. The following example is the kind of question that opens a longer probability problem.
When a question uses "show that", the final line must match the given value, and every step leading to it must be written. Starting from the given answer and checking that it works (208=52) is a verification, not a proof, and does not earn full credit.
Self-check
To do:
I can describe a trial, its outcomes, its sample space and an event, and list a sample space systematically.
To do:
I can use P(A)=n(U)n(A) when the outcomes are equally likely, and recognise when they are not.
To do:
I can find an unknown number of items from a given probability.
To do:
I can use P(A′)=1−P(A), including for "at least one" problems.
To do:
I can calculate a relative frequency and explain why more trials give a better estimate of a probability.
To do:
I can explain the difference between theoretical and experimental probability, and describe the law of large numbers.
To do:
I can design and carry out a simple simulation to estimate a probability.
To do:
I can calculate the expected number of occurrences np and find n or p when the expected number is given.
A1
choose a starting loaf at random from loaves 1 to 25, then select every 25th loaf after it R1
Note: The R1 requires both the random start and the regular interval.
(b)
On one day the randomly chosen starting loaf is loaf number 7. Write down the number of the fourth loaf selected.
[1]1 mark
Markscheme (b)
82A1
(c)
Find the probability that a particular loaf is selected on that day.
[1]1 mark
Markscheme (c)
150060=251(=0.04)A1
(d)
The loaves are baked on trays that each hold exactly 25 loaves, and they leave the oven in the same order every day. Loaves baked in the corner position of a tray are more likely to be overcooked.
Explain why the systematic sample may give a misleading estimate of the proportion of overcooked loaves.
[2]2 marks
Markscheme (d)
the interval 25 equals the number of loaves on a tray, so every selected loaf comes from the same position on its tray R1
so the sample contains either only corner loaves or no corner loaves, and the proportion of overcooked loaves would be overestimated or underestimated R1
Note: Award R1R0 for a general comment about bias with no reference to the tray position.
Question 2 · AA-0039214 marks
A conservation team catches 200 fish from a lake using nets and measures the length of each fish, in cm. The lengths are summarised in the following table.
Minimum
Lower quartile
Median
Upper quartile
Maximum
9
18
23
27
52
An outlier is a value more than 1.5×IQR below the lower quartile or above the upper quartile.
(a)
State whether the length of a fish is a discrete or a continuous variable.
[1]1 mark
(b)
Show that the longest fish is an outlier, and that the shortest fish is not.
[3]3 marks
(c)
The longest fish was photographed when it was measured, and it is of a species that is known to grow to more than 60 cm. State, with a reason, whether its length should be kept in the data.
[1]1 mark
(d)
Estimate the number of these 200 fish that are shorter than 27 cm.
[2]2 marks
(e)
The holes in the nets let fish shorter than about 8 cm escape. Explain how this affects the use of these 200 fish to estimate the median length of all the fish in the lake.
[1]1 mark
(f)
The 200 fish are made up of 120 perch, 50 roach and 30 pike. A stratified sample of 40 of these fish, proportional to species, is chosen for further study. Find the number of fish of each species in this sample.
[2]2 marks
(g)
All 200 fish are tagged and returned to the lake. One month later, 150 fish are caught at random from the lake and 12 of them are found to be tagged. Assume that this second catch is a random sample of all the fish in the lake. Estimate the total number of fish in the lake.
[3]3 marks
(h)
State one further assumption needed for the estimate in part (g) to be reliable.
(b) Let g be the number of green counters. The bag now holds 15+g counters, still with 5 red.
15+g5=41⟹20=15+g⟹g=5
So 5 green counters were added.
).
, as in the model.
(b) Count the digits from 0 to 4 in each family. The families with at least two such digits are
043(3 girls),011(3),722(2),333(3),080(2),404(3).
That is 6 families out of 20.
P(at least two girls)≈206=0.3
(c) The estimate 0.3 is well below the theoretical value 0.5. With only 20 simulated families, a large difference like this can easily happen by chance. By the law of large numbers, simulating many more families (several hundred, for example) would give a relative frequency closer to the true probability.
(b) Solve 160p=36.
p=16036=0.225
The probability of not landing on red is 1−0.225=0.775, so in 500 spins the expected number is
500×0.775=387.5.
odd discs.
(M1)
n8=52⟹2n=40⟹n=20(A1)
Every step is shown, because "show that" means the given answer must be reached by working.
(b) P(odd)=52, so the expected number is (M1)
300×52=120(A1)
(c) The box now holds 24 discs, of which 20−8=12 are even. (M1 for the new totals)