4.6 Venn diagrams, tree diagrams and combined events · IB Maths AA | Augment Education
4.6 Venn diagrams, tree diagrams and combined events
Use Venn diagrams, tree diagrams, sample space diagrams and two-way tables to find probabilities of combined events, apply the addition rule, and work with mutually exclusive and independent events, with and without replacement.
IB Mathematics: Analysis and Approaches
Part of 4 Statistics and probability
SL and HL
Key terms introduced here
Each is in the Maths AA glossary, with every other term in the subject.
Choosing items one after another without returning each to the population, so the probabilities for later choices change. With replacement, each item is returned and the probabilities stay the same.
A diagram of branches showing the outcomes of successive trials and their probabilities. Probabilities are multiplied along a path and added between paths.
A table of frequencies classified by two categories at once, with row and column totals, used to find probabilities of combined and conditional events.
A diagram in which a rectangle represents the sample space U and circles inside it represent events; overlapping regions show outcomes that belong to more than one event.
Notes on 4.6 Venn diagrams, tree diagrams and combined events
26 min readLast reviewed
Most questions about chance involve more than one event: a student who studies both physics and chemistry, two cards dealt from a pack, a test that is passed at the first or second attempt. Probabilities of such combined events can be found by organising the outcomes in a diagram and then applying a small number of rules for "and", "or" and "not".
Four diagrams do this work: the Venn diagram, the sample space diagram, the two-way table and the tree diagram. Each suits a different kind of problem, and choosing the right one is often the most important step in a solution.
Combining events
Intersection, union and complement
Two events A and B from the same sample space can be combined in several ways. The words "and", "or" and "not" in a question correspond to three pieces of notation borrowed from set theory.
In probability, "or" always includes the possibility of both, unless a question says otherwise (for example "A or B but not both"). The union A∪B therefore contains the intersection A∩B. The complement was introduced in 4.5, where complementary events were shown to satisfy P(A)+P(A′)=1
Notation
Read as
Meaning
A∩B
A and B
both occur
A∪B
A
Venn diagrams
Regions of a Venn diagram
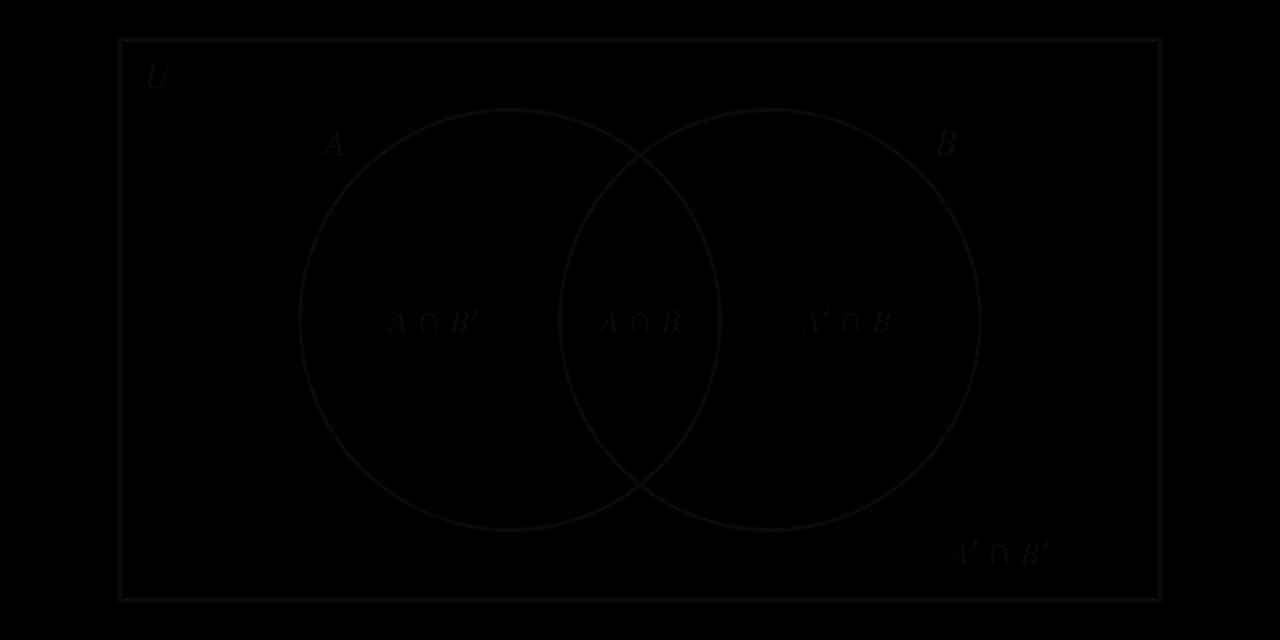
A Venn diagram for two events that can occur together divides the sample space into four regions. Every outcome lies in exactly one of them, so the four probabilities add up to 1.
Two overlapping events split the sample space into four regions, and every outcome belongs to exactly one of them.
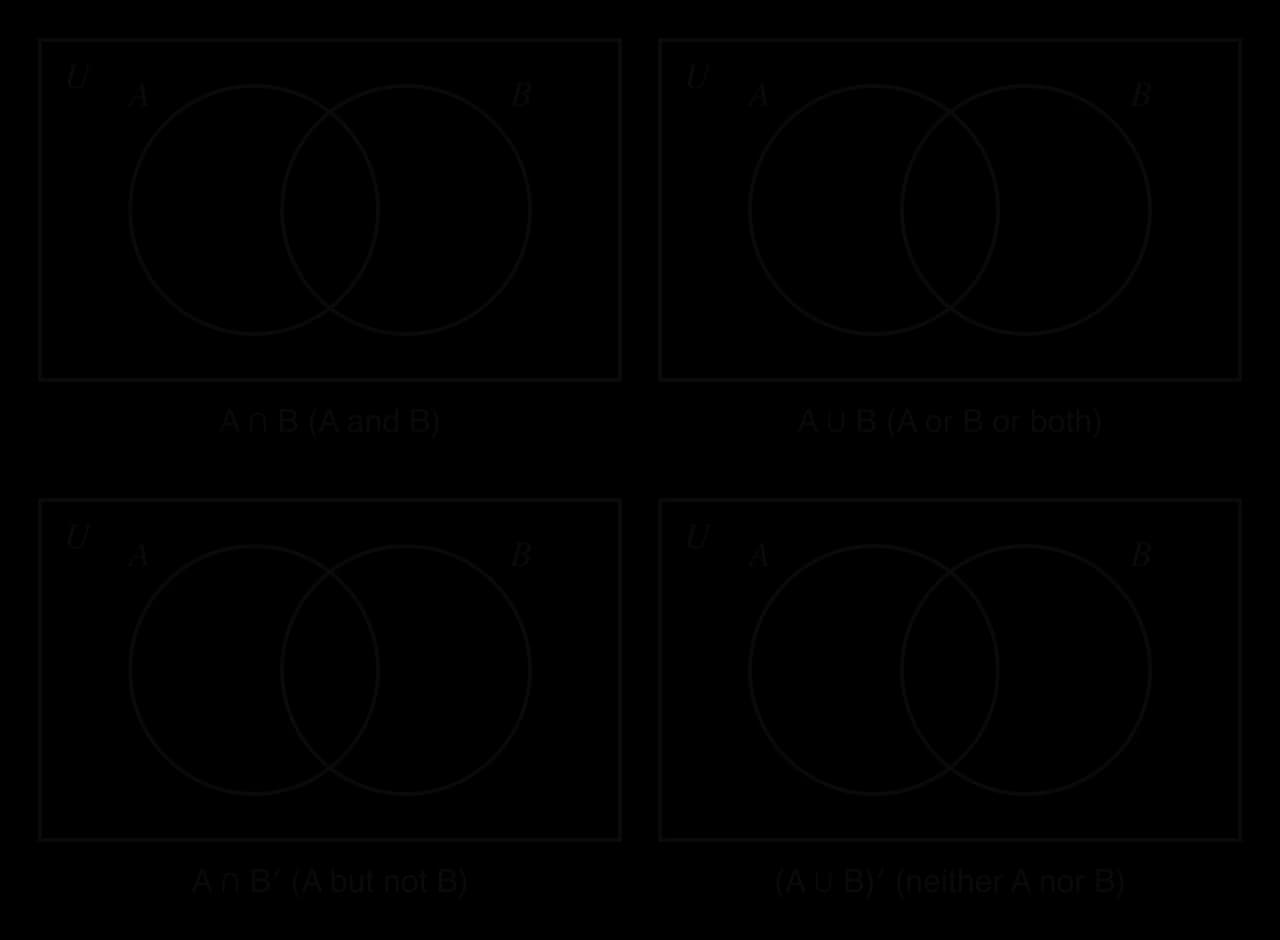
Any combination of A, B and their complements is a union of some of these four regions. Shading the region for an expression is a reliable way to understand it, and a common short question.
The union includes the overlap; "A but not B" excludes it. The complement of the union is the part of U outside both circles.
Venn diagrams with frequencies
When a question gives the numbers of people or items in each group, write the numbers in the regions. Always start with the overlap, then subtract to find the other regions, and finally use the total to find the number outside the circles.
Venn diagrams with probabilities
The same method works with probabilities in place of numbers. The total of all regions is then 1 instead of the number of people.
Venn diagrams for three events
Three events give three overlapping circles and eight regions. They are filled in the same order: the centre (all three) first, then the regions where exactly two circles overlap, then the parts of each circle that belong to it alone, and finally the outside.
The addition rule
Deriving the rule
Adding P(A) and P(B) does not give P(A∪B) in general, because the overlap A∩B
With equally likely outcomes, n(A∪B)=n(A)+n(B)−n(A∩B), and dividing by n(U)
The rule also shows that two events with large probabilities must overlap. If P(A)+P(B)>1, then P(A∩B)=P(A)+P(B)−P(A∪B)≥P(A)+P(B)−1>0
Mutually exclusive events
Events that cannot happen together
Some pairs of events can never occur on the same trial. A single roll of a die cannot be both a 2 and a 5; a randomly chosen card cannot be both a heart and a club.
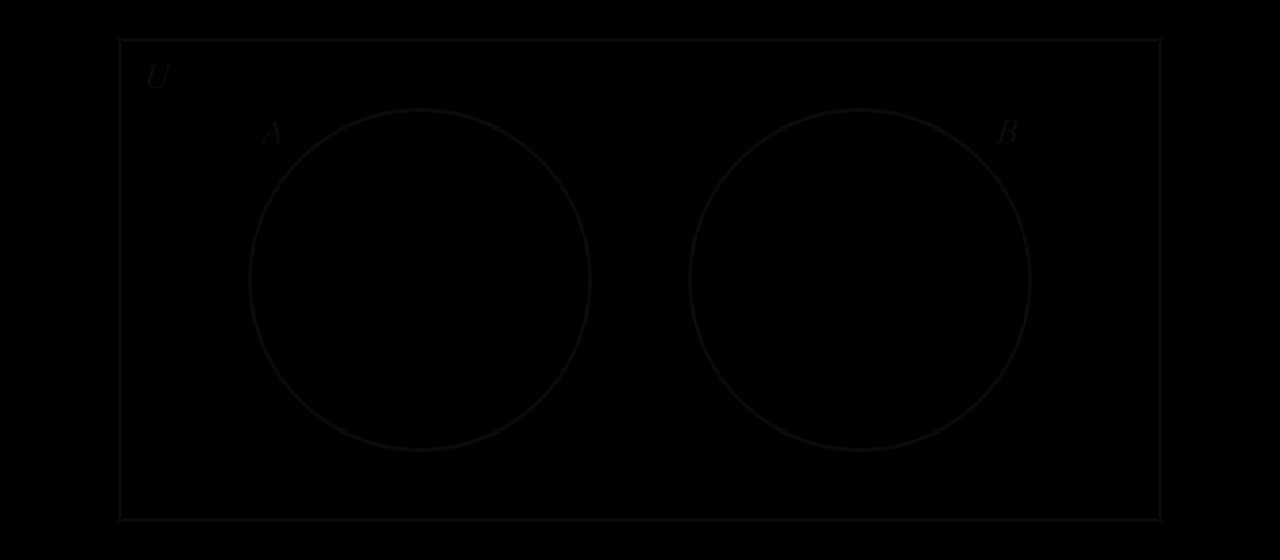
On a Venn diagram, mutually exclusive events are drawn as circles that do not overlap.
Mutually exclusive events have no overlap, so nothing is counted twice and the probabilities simply add.
Sample space diagrams and tables of outcomes
Two trials in a grid
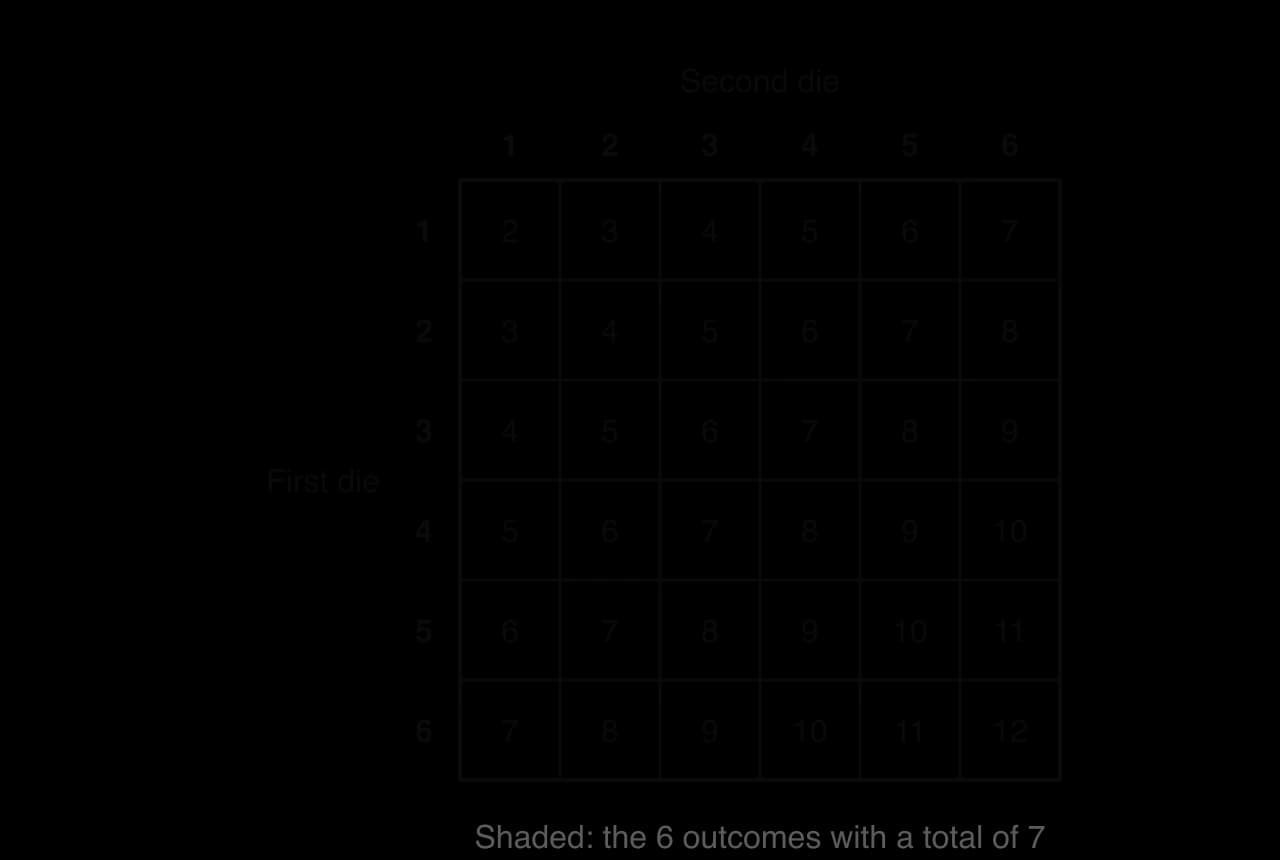
When two trials are combined, such as rolling two dice, every outcome is a pair. A sample space diagram lists all of the pairs in a grid, with the outcomes of one trial along the top and the other down the side. If each trial has equally likely outcomes, every cell of the grid is equally likely.
For two fair dice the grid has 6×6=36 equally likely cells. Each cell holds the total of the two scores.
A total of 7 occurs in 6 of the 36 equally likely cells, more than any other total. Totals of 2 and 12 occur only once each.
Grids are not limited to dice or to totals. Any two trials with a small number of outcomes can be combined, and each cell can hold a product, a difference, the larger score, or the pair itself.
Two-way tables
Data collected about two characteristics at once, such as the year group of each student and how they travel to school, is summarised in a two-way table. Row and column totals make it easy to read off the probabilities of single events, of combined events and of events restricted to one group.
A school records how 200 students in Years 12 and 13 travel to school.
Walk
Bus
Car
Total
Year 12
28
40
22
90
Year 13
32
45
Part (d) is a conditional probability: the denominator is no longer the whole group of 200 but only the group named after "given that". Probabilities of this kind can be read from any of the diagrams, and are defined formally in 4.11.
Tree diagrams
Building a tree diagram
A tree diagram shows a sequence of trials, one stage after another. Each stage has a set of branches, one for each outcome, labelled with its probability. A path from the start to the end of the tree represents one combined outcome.
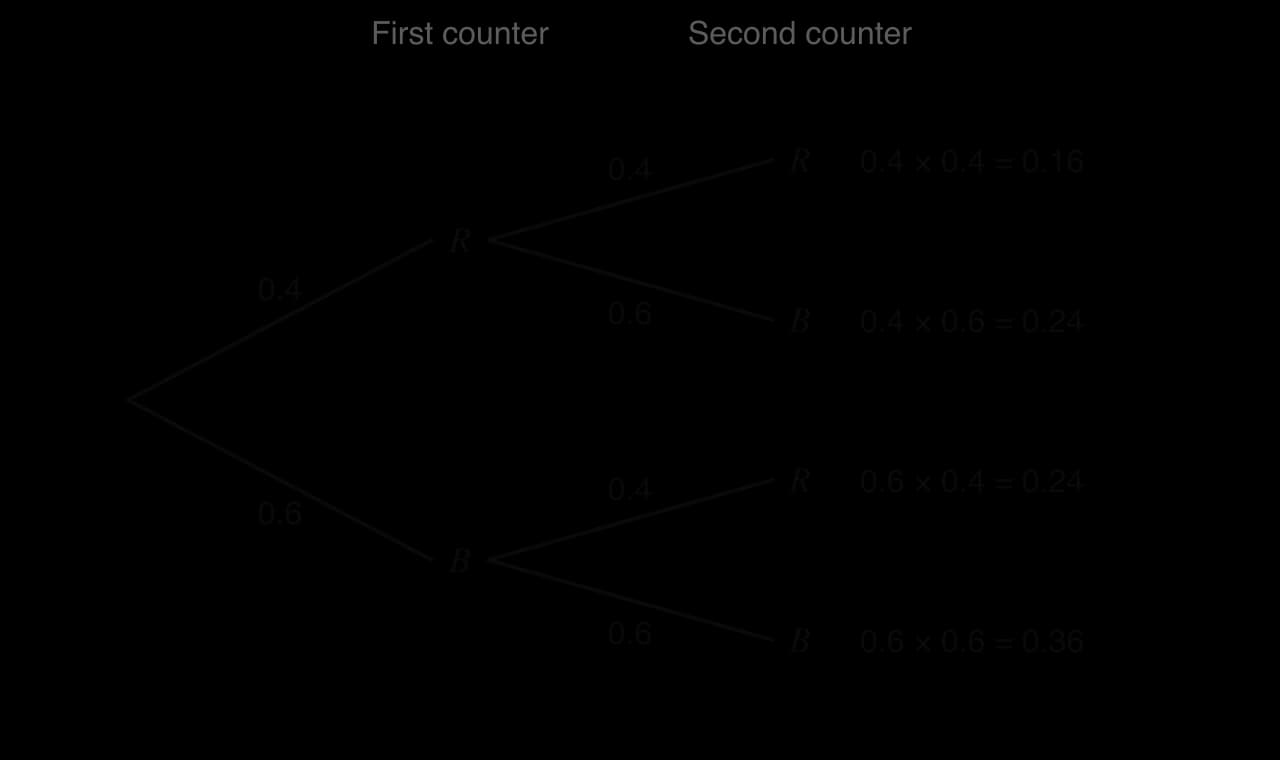
A bag contains 4 red and 6 blue counters. A counter is taken at random, its colour is noted and it is put back. A second counter is then taken. Because the first counter is replaced, the bag is the same for the second draw, and the probabilities on the second set of branches are the same as on the first.
Multiply along each path to get its probability. The four path probabilities add up to 1, which is a useful check.
From the tree:
P(both red)=0.4×0.4=0.16
P(one of each colour)=P(RB)+P(BR)=0.24+0.24=0.48
P(at least one red)=1−P(BB)=1−0.36=0.64
The rule "multiply along a path" works because each branch after the first gives the probability of that outcome in the situation reached so far. The rule "add between paths" works because different paths are mutually exclusive: a single run of the experiment follows exactly one path.
With and without replacement
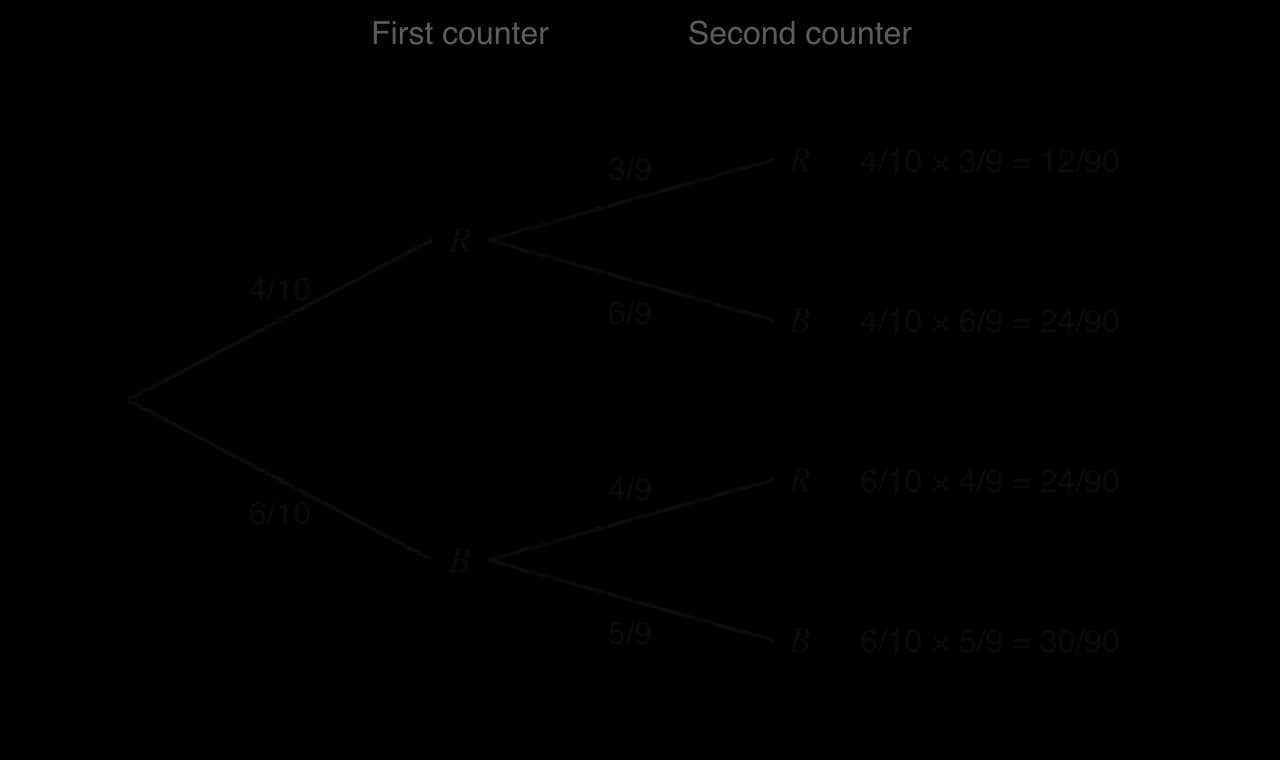
When the first counter is not put back, the second draw is from a bag with one fewer counter, and the probabilities on the second branches depend on what happened first. This is sampling without replacement. Dealing cards, choosing people for a committee and selecting items for quality testing are all done without replacement.
Comparing the two bags shows the effect of not replacing: the probability of two reds falls from 0.16 with replacement to 152≈0.133 without, because removing a red counter makes a second red less likely.
Trees with branches that stop
A tree does not have to be symmetrical. When an experiment stops as soon as a certain outcome occurs, only the other branches continue. Problems about repeated attempts, such as "keeps trying until successful, up to three times", produce trees of this shape.
Independent events
Events that do not affect each other
Two events are independent when the occurrence of one does not change the probability of the other. Tossing a coin and rolling a die are independent; so are the two draws in a bag problem with replacement. The two draws without replacement are not independent, because the result of the first draw changes the contents of the bag.
For independent events, the probability that both occur is found by multiplying. This is the rule already used on every tree diagram with replacement.
The rule can be checked with a sample space. A fair coin is tossed and a fair die is rolled. There are 2×6=12 equally likely outcomes, and only one of them is (heads, 6). So P(H∩6)=121
Conditional probability from diagrams
A probability "given that" an event has occurred is found by restricting attention to the outcomes in that event. In a diagram or table, this means using the size of the given group as the denominator instead of the whole sample space.
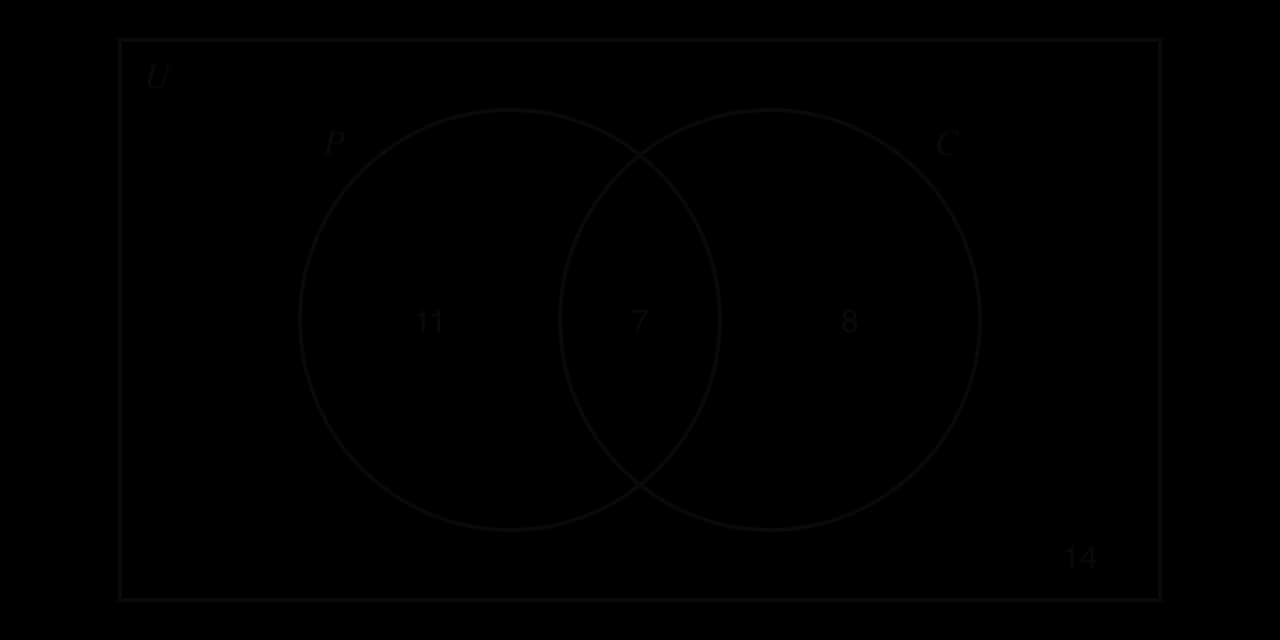
For the Physics and Chemistry Venn diagram, the probability that a student studies Physics, given that the student studies Chemistry, uses only the 15 Chemistry students, of whom 7 also study Physics:
P(P∣C)=157.
Written with probabilities, this is 15/407/40=P(C)P(P∩C)
P(A∣B)=P(B)P(A∩B).
The formal treatment of conditional probability, its use for testing independence, and reversing conditions on a tree diagram are in 4.11.
On a tree diagram without replacement, the second-stage branches are already conditional probabilities: the branch labelled 93 after a red counter is P(second red∣first red).
Exam-style questions on combined events
Questions on combined events often begin with a diagram to complete and then ask for several probabilities from it. Draw the diagram neatly and label it fully, because it is usually worth marks of its own and every later part depends on it.
Tree diagrams without replacement often appear with an unknown number of items. A "show that" part then asks for an equation, and the solving part follows from it.
Choosing the right diagram is often the key to a combined events question. A Venn diagram suits events that overlap within a single trial; a sample space diagram suits two trials with a small number of equally likely outcomes; a two-way table suits data classified in two ways; and a tree diagram suits trials that happen one after another, particularly when the probabilities change.
Self-check
To do:
I can use the notation A∩B, A∪B, A′ and shade the matching regions of a Venn diagram.
To do:
I can complete a Venn diagram for two or three events from frequencies or probabilities, starting from the overlap.
To do:
Questions on 4.6
78 exam-style questions on this subtopic, written in the style of the IB papers. The first has its markscheme open. Counted on
Question 1 · AA-004096 marks
Consider two events A and B such that P(A′)=53, P(B∣A)=41 and P(A∪B)=43.
(a)
Find P(A∩B).
[2]2 marks
Markscheme (a)
P(A)=1−53=52
Question 2 · AA-004105 marks
In a class of 40 students, 10 students belong to the chess club (C) and 16 students play in the school orchestra (O). Four students belong to the chess club and also play in the orchestra.
A student is selected at random from the class.
(a)
Determine whether the events C and O are independent. Justify your answer.
[3]3 marks
(b)
Find the probability that the student belongs to the chess club, given that the student does not play in the orchestra.
Question 3 · AA-004117 marks
On one day, 250 visitors to a museum were asked whether they hired an audio guide (G). Each visitor holds exactly one type of ticket: adult, student (S) or senior. The results are shown in the following table.
Audio guide (G)
No audio guide (G′)
Total
Try a quick-fire question
One of 39 short multiple-choice questions on 4.6. Pick an answer to see why it's right or wrong.
Events A and B are mutually exclusive. Which statement must be true?
From the formula booklet
The entries of the mathematics: analysis and approaches formula booklet that 4.6 uses. Each opens in the explained booklet.
Fill the overlap first, then subtract it from each circle's total. The four numbers add up to 40.
(b)(i) P(Physics only)=4011
(ii) The union contains 11+7+8=26 students.
P(P∪C)=4026=2013
(iii) P(neither)=4014=207
.
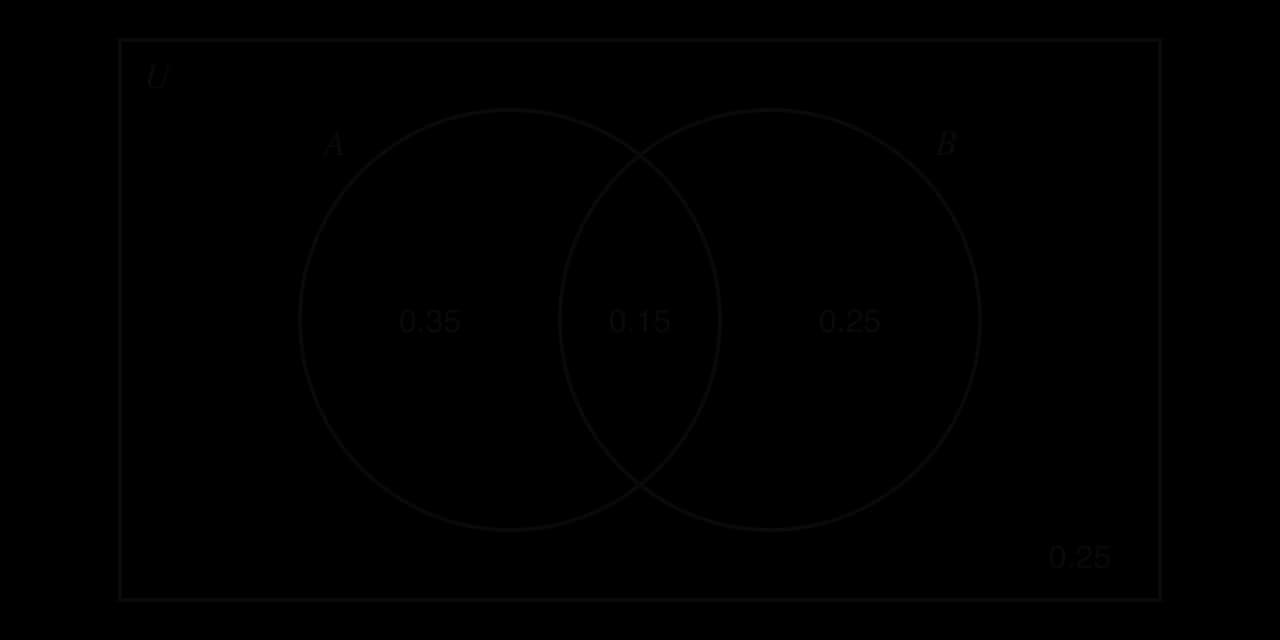
(a) Draw a Venn diagram showing the probability of each region.
(b) Find (i) P(A∩B′) (ii) P(A∪B) (iii) P(A′∩B′) (iv) P(A′∪B′).
Show the solution
(a) A only: 0.5−0.15=0.35. B only: 0.4−0.15=0.25. Outside: 1−(0.35+0.15+0.25)=0.25.
The four regions add up to 1. Each part of (b) is a sum of regions.
(b)(i) A∩B′ is "A only": P(A∩B′)=0.35
(ii) P(A∪B)=0.35+0.15+0.25=0.75.
(iii) A′∩B′ is the region outside both circles: P(A′∩B′)=0.25
(iv) A′∪B′ is everything except the overlap, which is (A∩B)′
P(A′∪B′)=1−0.15=0.85
). Of these,
8
study French and Spanish,
7
study French and German,
5
study Spanish and German, and
3
study all three.
(a) Draw a Venn diagram to show this information.
(b) Find the probability that a student chosen at random studies (i) none of the three languages (ii) exactly one language (iii) at least two languages.
Show the solution
(a) Start with 3 in the centre. The numbers "8 study French and Spanish" include the 3 who study all three, so French and Spanish only is 8−3=5. In the same way, French and German only is 7−3=4, and Spanish and German only is 5−3=2.
French only: 24−(5+4+3)=12. Spanish only: 20−(5+2+3)=10
The circles hold 12+10+6+5+4+2+3=42 students, so 50−42=8
Fill the centre first, then the three two-circle overlaps, then each circle alone. The eight numbers add up to 50.
(b)(i) P(none)=508=254
(ii) Exactly one language: 12+10+6=28 students.
P(exactly one)=5028=2514
(iii) At least two: 5+4+2+3=14 students.
P(at least two)=5014=257
Check: 8+28+14=50.
is part of both circles and is counted twice. Subtracting it once corrects the double count.
gives the probability form. The result holds for all events.
It links four quantities, so any three of them give the fourth.
and
P(A∪B)=0.8
. Find
P(A∩B)
and
P(A′∩B′)
.
Show the solution
(a) P(king)=524 and P(heart)=5213. The king of hearts is in both events, so P(king∩heart)=521.
P(king∪heart)=524+5213−521=5216=134
Check by counting: the 13 hearts and the 3 other kings make 16 cards.
(b) Substitute into the addition rule and solve.
0.8=0.6+0.5−P(A∩B)⟹P(A∩B)=0.3
A′∩B′ is the complement of A∪B.
P(A′∩B′)=1−0.8=0.2
, because
P(A∪B)
cannot exceed
1
.
and
P(A′∩B′)
.
(b) Events C and D have P(C)=0.6 and P(D)=0.7. Explain why C and D cannot be mutually exclusive, and write down the smallest possible value of P(C∩D).
Show the solution
(a) P(A∪B)=0.3+0.45=0.75, and P(A′∩B′)=1−0.75=0.25.
(b) If C and D were mutually exclusive, then P(C∪D)=0.6+0.7=1.3, which is impossible because no probability exceeds 1
P(C∩D)=0.6+0.7−P(C∪D)≥1.3−1=0.3.
The smallest possible value of P(C∩D) is 0.3.
, not
1
.
.
(b) Totals 10, 11 and 12 occur in 3, 2 and 1 cells.
P(total≥10)=363+2+1=366=61
(c) The prime totals are 2,3,5,7,11, which occur in 1,2,4,6,2 cells.
P(prime)=361+2+4+6+2=3615=125
(d) The doubles (1,1),(2,2),…,(6,6) lie on the leading diagonal: 6 cells.
P(double)=366=61
.
Show the solution
(a) Spinner X goes down the side and spinner Y along the top. There are 4×3=12 equally likely outcomes.
X\Y
1
2
3
1
1
2
3
2
2
4
6
3
3
6
9
4
4
8
12
(b)(i) The odd products are 1,3,3,9, so 8 of the 12 products are even.
P(even)=128=32
A product is odd only when both scores are odd, which is a quick check: 2×2=4 odd cells.
(ii) The products greater than 6 are 9, 8 and 12.
P(product>6)=123=41
33
110
Total
60
85
55
200
(b) Read the single cell: P(Year 13∩car)=20033.
(c) Year 12 has 90 students and walkers number 60, but the 28 Year 12 walkers are in both groups.
P(Year 12∪walk)=20090+60−28=200122=10061
(d) "Given that the student walks" restricts attention to the 60 walkers, of whom 28 are in Year 12.
P(Year 12∣walk)=6028=157
and
P(B)=106
. If a red counter is taken first,
9
counters remain,
3
red and
6
blue. If a blue counter is taken first,
9
remain,
4
red and
5
blue.
The second-stage branches change with the first counter, because it is not replaced. Each pair of branches still adds up to 1.
(b)(i) P(RR)=104×93=9012=152
(ii) Two paths, RB and BR.
P(different)=9024+9024=9048=158
(iii) The complement of "at least one red" is "both blue".
P(at least one red)=1−9030=9060=32
(b) Add the three "pass" paths.
0.6+0.4×0.75+0.4×0.25×0.8=0.6+0.3+0.08=0.98
Alternatively, the only way not to pass is to fail three times: 1−0.4×0.25×0.2=1−0.02=0.98.
, which equals
P(H)×P(6)=21×61
.
and
P(A∪B)
.
(b) A fair die is rolled three times. Find the probability that all three scores are even.
Show the solution
(a) Multiply, because the events are independent.
P(A∩B)=0.3×0.6=0.18
Then use the addition rule.
P(A∪B)=0.3+0.6−0.18=0.72
(b) The rolls are independent, and P(even)=21 on each.
P(all even)=21×21×21=81
. Two events with non-zero probabilities cannot be both: if
A
and
B
are mutually exclusive, knowing that
A
occurred makes
B
impossible, which is the strongest possible dependence.
, which leads to the formula
be the number of students who play tennis and swim.
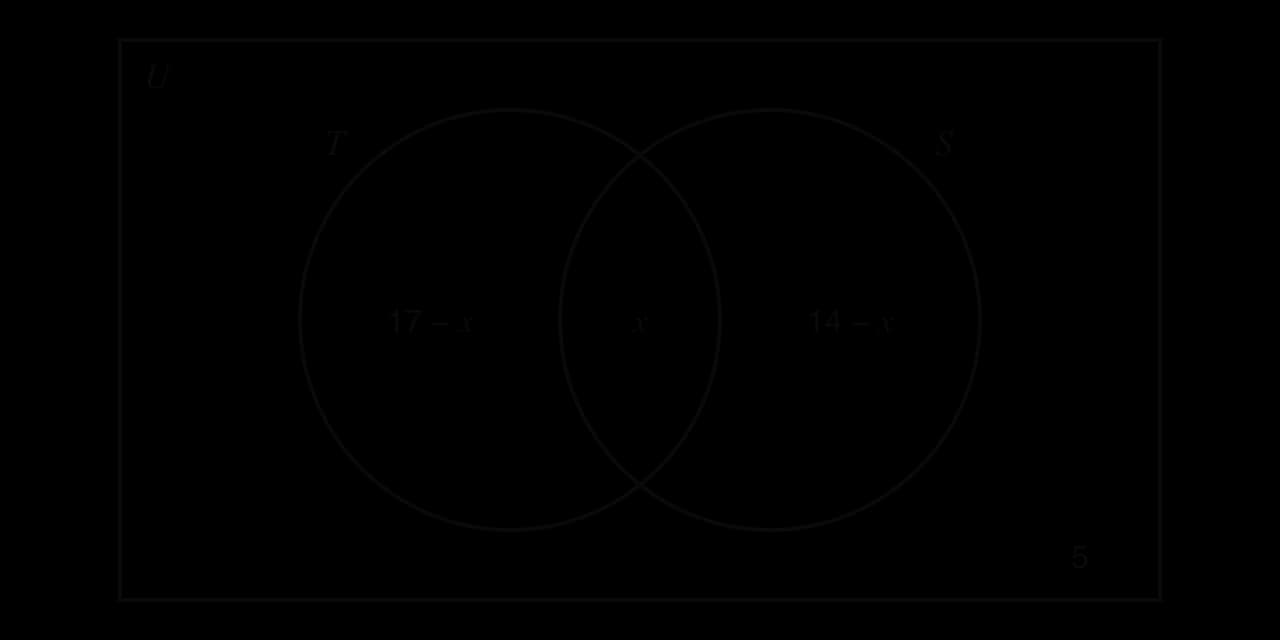
(a) Draw a Venn diagram to represent this information, in terms of x where necessary. [2]
(b) Find the value of x. [2]
(c) A student is chosen at random. Find the probability that the student does exactly one of the two activities. [2]
(d) Given that the student plays tennis, find the probability that the student also swims. [2]
Show the solution
(a) The overlap is x, so tennis only is 17−x and swimming only is 14−x; 5 go outside. (A1 for the overlap and outside, A1 for the other regions)
Express each region in terms of x, then use the total of 30 to form an equation.
(b) The four regions add up to 30. (M1)
(17−x)+x+(14−x)+5=30⟹36−x=30⟹x=6(A1)
(c) Exactly one activity: (17−6)+(14−6)=11+8=19. (M1)
P(exactly one)=3019(A1)
(d) Restrict to the 17 tennis players, of whom 6 swim. (M1 for the denominator 17)
P(S∣T)=176(A1)
, shows the examiner which probability you are finding.
. [3]
(b) Hence find the value of n. [2]
(c) Find the probability that the two balls are the same colour. [3]
Show the solution
(a) The first ball is red with probability n3. With one red ball removed, 2 of the remaining n−1 balls are red. (M1 for multiplying along the path)
n3×n−12=151(A1)
Multiply both sides by 15n(n−1).
90=n(n−1)=n2−n⟹n2−n−90=0(A1)
(b) Factorise. (M1)
(n−10)(n+9)=0⟹n=10 or n=−9
The number of balls is positive, so n=10. (A1)
(c) There are 3 red and 7 blue balls. Same colour means RR or BB. (M1 for adding two paths)
P(RR)=151=906,P(BB)=107×96=9042(A1)
P(same colour)=906+9042=9048=158(A1)
, after the question has said "without replacement".
I can apply P(A∪B)=P(A)+P(B)−P(A∩B) and find any one of its quantities from the other three.
To do:
I can recognise mutually exclusive events and use P(A∪B)=P(A)+P(B) for them.
To do:
I can use sample space diagrams and two-way tables to find probabilities.
To do:
I can draw a tree diagram for trials with and without replacement, multiply along paths and add between them.
To do:
I can use P(A∩B)=P(A)P(B) for independent events, and explain how independence differs from mutual exclusivity.
To do:
I can find a "given that" probability from a Venn diagram, table or tree.
(seen anywhere)
(A1)
P(A∩B)=P(A)P(B∣A)=52×41=101A1
(b)
Find P(B).
[2]2 marks
Markscheme (b)
correct substitution into P(A∪B)=P(A)+P(B)−P(A∩B)(M1)
43=52+P(B)−101
P(B)=209A1
(c)
Find P(B∣A′).
[2]2 marks
Markscheme (c)
P(A′∩B)=209−101=207(A1)
P(B∣A′)=53207=127
Note: Follow through from their answers to parts (a) and (b).