2.16 Modulus graphs and transformations · IB Maths AA | Augment Education
2.16 Modulus graphs and transformations
Sketch y = |f(x)|, y = f(|x|), y = 1/f(x), y = [f(x)]² and y = f(ax + b) from the graph of y = f(x), and solve modulus equations and inequalities graphically and algebraically.
IB Mathematics: Analysis and Approaches
Part of 2 Functions
HL only
Key terms introduced here
Each is in the Maths AA glossary, with every other term in the subject.
The absolute value of a number measures its size without regard to its sign. It appears wherever only the size of a quantity matters: the error in a measurement, the distance between two numbers, or the gap between a model and the data it describes. Applying the absolute value, a reciprocal or a square to a function changes its graph in ways that can be predicted from the original graph, which builds on the translations, reflections and stretches of 2.11.
The absolute value
Definition
The second line of the definition often causes confusion. When x is negative, −x is positive: for example, ∣−5∣=−(−5)=5. The absolute value never produces a negative number; it removes the sign of its input.
The absolute value as a distance
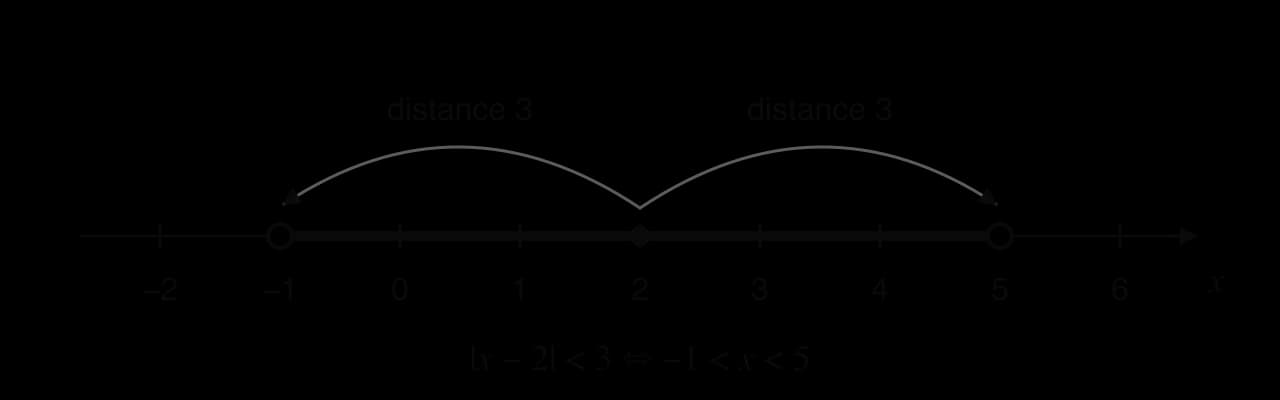
On the number line, ∣x∣ is the distance from x to 0. More generally, ∣x−a∣ is the distance between x and a
|x − 2| < 3 describes every number within 3 units of 2, an interval centred on 2. The end points are open because the inequality is strict.
The same idea works for ∣x+4∣, which is ∣x−(−4)∣, the distance from x to −4.
Properties of the absolute value
These properties follow from the definition and are used throughout the subtopic. In each, a and b are real numbers and k>0.
Property
Example
∣ab∣=∣a∣∣b∣ and ba=∣b∣∣a∣
The property a2=∣a∣ deserves attention. The square root symbol always gives the non-negative root, so (−3)2=9=3
The graph of y=∣x∣
For x≥0, the graph of y=∣x∣ is the line y=x; for x<0
The graph of y=∣f(x)∣
Reflecting the negative parts
Taking the modulus of the output leaves every non-negative y-value as it is and changes the sign of every negative one. On the graph, the parts of y=f(x) that lie on or over the x-axis stay the same, and the parts under the x-axis are reflected in the x-axis.
y=∣f(x)∣:(x,y)↦(x,y) if y≥0,(x,y)↦(x,−y) if y<0
To sketch y=∣f(x)∣:
Sketch y=f(x) and mark its zeros.
Keep every part of the curve where y≥0.
Reflect every part where y<0 in the x
The zeros of f are invariant points. Where the curve crossed the x-axis at an angle, y=∣f(x)∣ now has a sharp corner, and the graph lies entirely on or over the x-axis, so its range contains no negative values. A local minimum under the x
Asymptotes and y=∣f(x)∣
A vertical asymptote of f remains a vertical asymptote of ∣f∣, but if f(x)→−∞ next to it, then ∣f(x)∣→+∞
The graph of y=f(∣x∣)
Reflecting the right-hand half
In y=f(∣x∣) the modulus acts on the input. For x≥0, ∣x∣=x, so the graph is exactly the graph of y=f(x)
To sketch y=f(∣x∣):
Sketch y=f(x) for x≥0 only.
Delete the part of the graph with x<0.
Reflect the part with x≥0
The result is always symmetrical in the y-axis, so f(∣x∣) is an even function (2.14). The y-intercept and every point with x>0 are kept, and the original left-hand half plays no part at all.
Combining both moduli
The graph of y=∣f(∣x∣)∣ applies both rules, in the order the operations happen: first form y=f(∣x∣) by reflecting the right-hand half in the y-axis, then reflect any part under the x
A function such as y=ln∣x∣ is f(∣x∣) for f(x)=lnx. Its domain is x=0
The graph of y=f(x)1
How the features correspond
The reciprocal graph y=f(x)1 is found point by point: each y-coordinate is replaced by its reciprocal. Large values become small, small values become large, and the sign never changes. These facts give a set of rules that link the features of the two graphs.
Feature of y=f(x)
Feature of y=f(x)1
The rules come from simple facts about reciprocals. As f(x) approaches 0, its reciprocal grows without limit, which produces a vertical asymptote; as f(x) grows without limit, its reciprocal approaches 0. The invariant points are the solutions of y1=y
Sketching a reciprocal graph
To sketch y=f(x)1 from the graph of y=f(x):
Draw the vertical asymptotes at the zeros of f.
Mark the invariant points where f(x)=±1.
Find the images of the turning points and the y-intercept.
Find the horizontal asymptote from the behaviour of f for large ∣x∣
A quadratic with two zeros gives a reciprocal graph with two vertical asymptotes, and its turning point gives the opposite kind of turning point between them.
When f has no zeros or has asymptotes
If f is never zero, the reciprocal graph has no vertical asymptotes. For f(x)=x2−2x+2=(x−1)2+1
If f already has asymptotes, they swap roles with the zeros.
The graph of y=[f(x)]2
Squaring every y-coordinate gives the graph of y=[f(x)]2. The result depends on the size of each y-value.
Every y-value becomes non-negative, so the graph lies on or over the x-axis.
Zeros of f stay zeros, but the graph now touches the x-axis there instead of crossing it, because [f(x)]2
Stationary points of f remain stationary points of [f(x)]2, at the same x. By the chain rule (5.6), the derivative of [f(x)]2
The square also affects a horizontal asymptote. For f(x)=ex−2, with asymptote y=−2, zero x=ln2
The graph of y=f(ax+b)
The graph of y=f(ax+b) combines a horizontal translation and a horizontal stretch, and possibly a reflection if a<0. Both act on the input, so they are applied in the reverse order of the operations on x, as explained in 2.11. There are two equivalent descriptions:
From f(ax+b): a translation by (−b0), then a horizontal stretch with scale factor a1
The quickest way to find the image of a point (x0,y0) is to solve ax+b=x0
(x0,y0)↦(ax0−b,y0)
Vertical asymptotes and zeros move in the same way, and the y-values of every point stay the same.
Solving modulus equations
A modulus equation contains the absolute value of an expression involving the unknown. Three methods work in general: using the definition (splitting into cases), squaring both sides, and drawing graphs. Each can introduce or hide solutions if used carelessly, so every algebraic answer must be checked in the original equation.
Using the definition
If k≥0, the equation ∣A∣=k means A=k or A=−k
Squaring both sides
When both sides are moduli, ∣A∣=∣B∣, both sides are non-negative, so squaring is reversible: ∣A∣=∣B∣⟺A2=B2
Squaring is safe when both sides are known to be non-negative. Squaring an equation such as ∣x−2∣=3x, where the right-hand side may be negative, also produces the solutions of ∣x−2∣=−3x, which is why the answer x=−1
Equations with a quadratic inside the modulus
Sums of moduli: splitting into intervals
An equation with more than one modulus, such as ∣x−3∣+∣x+1∣=6, is solved by splitting the number line at the critical values where each expression inside a modulus is zero. On each interval, every modulus can be replaced by the expression or by its negative, and an answer is valid only if it lies in the interval used.
Solving graphically
Any modulus equation f(x)=g(x) can be solved by drawing y=f(x) and y=g(x)
Solving modulus inequalities
Using distance and the standard results
The results ∣A∣<k⟺−k<A<k and ∣A∣>k⟺A<−k
Inequalities with a modulus on each side
For ∣A∣<∣B∣, both sides are non-negative, so squaring keeps the direction of the inequality: ∣A∣<∣B∣⟺A2<B2
Inequalities with the unknown outside the modulus
When one side is not a modulus, as in ∣x2−3∣<x+1, squaring is not safe because x+1 may be negative. The reliable method is to solve the corresponding equation, using cases and rejecting extraneous solutions, and then decide which intervals satisfy the inequality from a graph or from a test value in each interval.
Exam-style questions on modulus graphs and equations
The first question needs no calculator and draws together three of the graphs from one quadratic; the second uses a GDC for an inequality with no algebraic solution.
Self-check
To do:
I can use the definition of ∣x∣, interpret ∣x−a∣ as a distance, and use x2=∣x∣
Questions on 2.16
24 exam-style questions on this subtopic, written in the style of the IB papers. The first has its markscheme open. Counted on
Question 1 · AA-0038230 marks
This question asks you to investigate what happens when a trigonometric function is followed by its inverse function.
Consider the functions f(x)=arcsin(sinx) and g(x)=arccos(cosx), for x∈R.
, and the solution of modulus equations and inequalities. The single transformations used here are in 2.11, and general polynomial and rational inequalities are in 2.15.
So ∣x∣≥0 for every x, and ∣x∣=0 only when x=0.
, whichever of them is larger. This reading turns many modulus statements into simple pictures. The equation
∣x−2∣=3
asks for the numbers at distance 3 from 2, which are
−1
and
5
. The inequality
∣x−2∣<3
asks for the numbers closer than 3 to 2, which form the interval
−1<x<5
.
(
b=0
)
∣−3x∣=3∣x∣
∣a∣2=a2 and a2=∣a∣
(x−1)2=∣x−1∣
∣a∣=∣b∣⟺a=±b⟺a2=b2
∣x∣=∣4∣⟺x=±4
∣x∣<k⟺−k<x<k
∣x∣<2⟺−2<x<2
∣x∣>k⟺x<−k or x>k
∣x∣>2⟺x<−2 or x>2
∣a+b∣≤∣a∣+∣b∣
∣3+(−5)∣=2≤8
, not
−3
. The last property, the triangle inequality, says that the size of a sum is at most the sum of the sizes; the two are equal only when
a
and
b
have the same sign (or one is zero).
; for negative
x
it gives a negative answer from a square root. The correct statement for all real
x
is
x2=∣x∣
.
it is the line
y=−x
. The two halves meet at the origin in a sharp V-shaped corner, and the graph is symmetrical in the
y
-axis. Its range is
y≥0
. A graph of the form
y=a∣x−h∣+k
is this V transformed as in 2.11: its corner is at
(h,k)
.
y = |x|
y = |x − 2| − 1
y = |x| is a V with its corner at the origin. y = |x − 2| − 1 is the same V translated by the vector (2, −1), so its corner is at (2, −1).
-axis.
-axis becomes a local maximum.
, labelling the intercepts and any turning points.
Show the solution
First find the key features of y=f(x).
Zeros: x2−2x−3=(x−3)(x+1)=0, so x=−1 and x=3.
y-intercept: f(0)=−3.
Vertex: completing the square, f(x)=(x−1)2−4, so the vertex is (1,−4).
Between the zeros, f(x)<0, so this part is reflected in the x-axis. The y-intercept (0,−3) becomes (0,3)
. A horizontal asymptote
y=c
becomes
y=∣c∣
. For example,
y=lnx
has the vertical asymptote
x=0
with
lnx→−∞
as
x→0+
; the graph of
y=∣lnx∣
rises to
+∞
on both sides of its corner at
(1,0)
as it approaches the
y
-axis or moves to the right.
. For
x<0
,
∣x∣=−x
, so
f(∣x∣)=f(−x)
, which takes the same value at
x
as
f
takes at
−x
. The left-hand half is therefore the mirror image of the right-hand half.
in the
y
-axis.
, labelling the intercepts and turning points.
Show the solution
For x≥0 the graph is y=f(x)=(x−1)(x−3)=(x−2)2−1. On this half it has zeros x=1 and x=3, a y-intercept (0,3) and a minimum at (2,−1).
Reflect this half in the y-axis. The zeros x=1 and x=3 give zeros x=−1 and x=−3
, so the positive
x
-values are copied to the left. "Outside acts on
y
, inside acts on
x
" is the same rule as in 2.11.
-axis upwards. For
f(x)=x2−4x+3
, the two minima
(±2,−1)
of
y=f(∣x∣)
become local maxima
(±2,1)
of
y=∣f(∣x∣)∣
, and the graph has a W-like shape with corners at
x=±1
and
x=±3
.
, and it has two branches, mirror images in the
y
-axis, both approaching the vertical asymptote
x=0
.
y = ln|x|
y = |ln x|
y = ln|x| copies the graph of y = ln x into x < 0. y = |ln x| keeps the domain x > 0 and reflects the negative part, for 0 < x < 1, upwards.
Zero at x=a
Vertical asymptote x=a
Vertical asymptote x=a
Zero at x=a (the graph meets the axis there)
f(x)→±∞ as x→±∞
Horizontal asymptote y=0
Horizontal asymptote y=c, c=0
Horizontal asymptote y=c1
Local maximum at (a,k), k=0
Local minimum at (a,k1)
Local minimum at (a,k), k=0
Local maximum at (a,k1)
f positive (or negative)
f1 positive (or negative), on the same intervals
f increasing
f1 decreasing, and the other way round
Points where y=1 or y=−1
The same points: they are invariant
, which are
y=1
and
y=−1
. A maximum swaps with a minimum because a larger positive number has a smaller reciprocal.
for every
x
. It never crosses the
x
-axis where
f
is defined, because
f(x)1
is never zero; it can only meet the axis at a point where
f
has a vertical asymptote.
.
Join the points on each interval, staying on the same side of the x-axis as f, and approaching the asymptotes.
, giving its asymptotes, its
y
-intercept and its invariant points.
Show the solution
Asymptotes: f has a zero at x=2, so y=2x−41 has the vertical asymptote x=2. As x→±∞, f(x)→±∞, so y=f(x)1→0: the horizontal asymptote is y=0.
y-intercept: f(0)=−4, so f(0)1=−41
Invariant points: 2x−4=1 gives x=2.5, and 2x−4=−1 gives x=1.5
Signs: f(x)>0 for x>2 and f(x)<0 for x<2
, giving the equations of its asymptotes and the coordinates of its turning point.
(b) Find the x-coordinates of the invariant points.
Show the solution
(a) Zeros of f: x2−4=0 gives x=±2, so the vertical asymptotes are x=−2 and x=2.
As x→±∞, f(x)→+∞, so f(x)1→0
f has a minimum at (0,−4), so f1 has a maximum at (0,−41)
Signs: f(x)<0 for −2<x<2, so the middle branch lies under the x-axis, rising to its maximum (0,−41)
(b) f(x)=1 gives x2=5, so x=±5
becomes
(0,−41)
, not
(0,4)
or
(0,41)
: the reciprocal keeps the sign.
, the minimum point
(1,1)
has
y=1
, so it is invariant, and it becomes the maximum of
y=f(x)1
. The reciprocal graph is a smooth hump between
0
and
1
, approaching the asymptote
y=0
on both sides.
and a zero at
x=0
. Sketch
y=f(x)1
, giving its asymptotes and its zero.
Show the solution
Zero of f at x=0: the reciprocal has a vertical asymptote x=0.
Vertical asymptote of f at x=1: there ∣f(x)∣→∞, so f(x)1→0 and the reciprocal graph meets the x-axis at (1,0).
Horizontal asymptote of f, y=1: since 11=1, the reciprocal has the same horizontal asymptote y=1
In fact f(x)1=xx−1=1−x1
has a minimum value of
0
.
Where ∣f(x)∣>1 the graph moves further from the axis, and where ∣f(x)∣<1 it moves closer, since squaring a number between −1 and 1 makes it smaller in size.
Points with y=0 or y=1 are invariant, and points with y=−1 move to y=1.
A vertical asymptote of f stays a vertical asymptote; a horizontal asymptote y=c becomes y=c2.
is
2f(x)f′(x)
, which is zero wherever
f′(x)=0
and also wherever
f(x)=0
. So the zeros of
f
become new minimum points.
and state the coordinates of its turning points.
Show the solution
The zeros x=±2 of f become points where the new graph touches the x-axis: minima at (−2,0) and (2,0).
The minimum (0,−4) of f is a stationary point, so [f(x)]2 has a stationary point at x=0
For ∣x∣>2, f(x) grows without limit, and its square grows much faster.
and
y
-intercept
(0,−1)
, the graph of
y=(ex−2)2
has asymptote
y=4
, touches the
x
-axis at
(ln2,0)
and has
y
-intercept
(0,1)
. The point
(ln3,1)
, where
f(x)=1
, is invariant.
touches the axis smoothly there, and its values are squared rather than kept the same size.
.
From f(a(x+ab)): a horizontal stretch with scale factor a1, then a translation by (−ab0).
. This gives
and a vertical asymptote
x=7
.
(a) For the graph of y=f(2x+1), find the zeros, the image of the maximum and the vertical asymptote.
(b) For the graph of y=f(3−x), find the image of the maximum and describe the transformations.
Show the solution
(a) Use (x0,y0)↦(2x0−1,y0).
Zeros: 2−1−1=−1 and 25−1=2
Maximum: (3,6)↦(23−1,6)=(1,6).
Asymptote: x=27−1=3.
(b) Solve 3−x=x0, giving x=3−x0
Write f(3−x)=f(−(x−3)). Reading from the inside, x is translated by 3 then has its sign changed; the graph changes in the reverse order. One correct description is a reflection in the y
. When the right-hand side contains the unknown, as in
∣A∣=B
, the same split gives
A=B
or
A=−B
, but each answer is valid only if
B≥0
, because a modulus can never equal a negative number.
, that is
x≥0
.
Case 1: x−2=3x. Then −2=2x, so x=−1. This fails x≥0; check: ∣−1−2∣=3 but 3(−1)=−3. Reject x=−1: it is an extraneous solution.
Case 2: x−2=−3x. Then 4x=2, so x=21. Check: 21−2=23 and 3×21=23. Valid.
The only solution is x=21.
y = |x − 2|
y = 3x
The line meets the V only once. The value x = −1 solves x − 2 = 3x, but that line is the reflected half of the V, which y = |x − 2| does not include for x < 2.
does not satisfy the original equation. Substitute every value back into the original equation before stating it.
. This replaces the modulus with a polynomial equation. The equivalent statement
A=±B
gives the same solutions, often with less algebra.
4x2−4x+1=x2+6x+9
3x2−10x−8=0
(3x+2)(x−4)=0
So x=−32 or x=4.
Method 2 (A=±B). From 2x−1=x+3, x=4. From 2x−1=−(x+3), 3x=−2, so x=−32.
Check: at x=4, ∣7∣=∣7∣; at x=−32, −37=37. Both are valid.
appeared in Case 1 there.
.
Case 1: x2−4=3x, so x2−3x−4=0, (x−4)(x+1)=0, giving x=4 or x=−1. Reject x=−1 since it is negative.
Case 2: x2−4=−3x, so x2+3x−4=0, (x+4)(x−1)=0, giving x=1 or x=−4. Reject x=−4.
Check: ∣16−4∣=12=3(4) and ∣1−4∣=3=3(1).
The solutions are x=1 and x=4.
y = |x² − 4|
y = 3x
The line y = 3x crosses the reflected hump of y = |x² − 4| at x = 1 and the outer branch at x = 4.
, so consider three intervals.
For x≥3: both are non-negative, so (x−3)+(x+1)=6, 2x−2=6, x=4. Since 4≥3, this is valid.
For −1≤x<3: x−3<0 and x+1≥0, so −(x−3)+(x+1)=6, which gives 4=6. This is impossible, so there are no solutions in this interval.
For x<−1: both are negative, so −(x−3)−(x+1)=6, −2x+2=6, x=−2. Since −2<−1, this is valid.
The solutions are x=−2 and x=4. In terms of distance, these are the points whose distances to 3 and to −1 add up to 6; every point between −1 and 3 has a total distance of exactly 4.
and finding the
x
-coordinates of their intersections. The graph also shows how many solutions to expect, which is a useful check on an algebraic method. On a graphic display calculator (GDC), the absolute value function is usually written abs, and the intersection tool gives each solution; give answers to 3 significant figures unless told otherwise.
or
A>k
(for
k>0
) solve the simplest inequalities directly. The first describes values within
k
of zero, a single interval; the second describes values further than
k
from zero, two separate intervals.
. Add 2 to every part:
−1<x<5
.
(b) 2x+1≥5 or 2x+1≤−5. The first gives x≥2; the second gives 2x≤−6, so x≤−3.
The solution is x≤−3 or x≥2. This is two separate intervals, which must not be written as one double inequality.
, so this inequality describes nothing. Two separate intervals are joined by "or", or written as
x∈]−∞,−3]∪[2,∞[
.
. The result is a polynomial inequality, solved with the methods of 2.7 and 2.15.
4x2−4x+1<x2+6x+9
3x2−10x−8<0
(3x+2)(x−4)<0
The quadratic 3x2−10x−8 has a positive leading coefficient and zeros −32 and 4, so it is negative between them.
−32<x<4
(b) The two V-shaped graphs intersect at x=−32 and x=4 (the solutions of ∣2x−1∣=∣x+3∣). The graph of y=∣2x−1∣ lies under the graph of y=∣x+3∣ between these intersections, which gives the same answer.
y = |2x − 1|
y = |x + 3|
The steeper V is lower than the other V only between the two intersections, so the solution set is the single interval −2/3 < x < 4.
first. A solution needs
x+1≥0
, so
x≥−1
.
Case 1: x2−3=x+1, so x2−x−4=0 and
x=21±17
Only x=21+17≈2.56 satisfies x≥−1; the other value, ≈−1.56, is rejected.
Case 2: x2−3=−(x+1), so x2+x−2=0, (x+2)(x−1)=0, giving x=1 or x=−2. Reject x=−2.
The graphs meet at x=1 and x=21+17. Test a value between them: at x=2, ∣4−3∣=1<3, true. Test a value outside: at x=0, ∣0−3∣=3<1 is false; at x=3, ∣9−3∣=6<4 is false.
1<x<21+17
y = |x² − 3|
y = x + 1
The line y = x + 1 lies above the modulus graph only between x = 1 and x = (1 + √17)/2.
, labelling the intercepts and the local maximum.
(b) Solve the equation ∣f(x)∣=3.
(c) Find the set of values of k for which ∣f(x)∣=k has exactly four solutions.
(d) Sketch the graph of y=f(x)1, giving the equations of all asymptotes and the coordinates of the turning point and the y-intercept.
Show the solution
(a) f(x)=(x−1)(x−5)=(x−3)2−4. The zeros are x=1 and x=5, the y-intercept is (0,5) and the vertex is (3,−4).
Between x=1 and x=5 the parabola is under the x-axis, so it is reflected: the vertex becomes the local maximum (3,4). The intercepts (1,0)
(b) ∣f(x)∣=3 means f(x)=3 or f(x)=−3.
x2−6x+5=3 gives x2−6x+2=0
x=26±36−8=3±7
x2−6x+5=−3 gives x2−6x+8=0
The four solutions are x=3−7, 2, 4
(c) A horizontal line y=k meets the graph four times when it cuts the reflected hump twice and each outer branch once. This happens when it lies strictly between the x-axis and the local maximum: 0<k<4. (At k=4
(d) Vertical asymptotes at the zeros of f: x=1 and x=5. Since f(x)→∞ as x→±∞
The minimum (3,−4) becomes the maximum (3,−41), and the y
The marks for (d) are typically for both vertical asymptotes, the horizontal asymptote, the turning point and the correct shape of all three branches.
.
.
(b) Solve the inequality ∣x3−4x∣≤2.
(c) The equation ∣f(x)∣=k has exactly six solutions. Find the set of possible values of k, giving exact values.
(d) Hence write down the number of solutions of [f(x)]2=4.
Show the solution
(a) f(x)=x(x−2)(x+2) has zeros at x=−2, 0 and 2. The cubic is negative for 0<x<2 and for x<−2; these parts are reflected upwards. The graph of y=∣f(x)∣ has two equal humps between the zeros and rises steeply outside them, with sharp corners at the three zeros.
(b) Use a GDC to find where y=∣x3−4x∣ meets y=2. The six intersections are at x≈−2.21
−2.21≤x≤−1.68or−0.539≤x≤0.539or1.68≤x≤2.21
(c) A line y=k meets each hump twice and each outer branch once when 0<k<h, where h is the height of the humps. The tops of the humps come from the turning points of f. Here f′(x)=3x2−4=0
f(32)=338−38=3316=9163
So 0<k<9163
(d) [f(x)]2=4 is equivalent to ∣f(x)∣=2, since both sides of ∣f(x)∣=2
.
To do:
I can sketch y=∣f(x)∣ by reflecting the parts of y=f(x) under the x-axis.
To do:
I can sketch y=f(∣x∣) by reflecting the part of y=f(x) with x≥0 in the y-axis.
To do:
I can sketch y=f(x)1, turning zeros into vertical asymptotes, swapping maxima and minima, and marking the invariant points where y=±1.
To do:
I can sketch y=[f(x)]2, showing that zeros become points where the graph touches the axis.
To do:
I can find the image of a point under y=f(ax+b) and describe the transformations in a correct order.
To do:
I can solve modulus equations by cases, by squaring and with graphs, and reject extraneous solutions.
To do:
I can solve modulus inequalities with one or two separate intervals in the answer, algebraically and with a GDC.
A1
(a)(ii)
Find the exact value of f(65π).
[1]1 mark
Markscheme (a)(ii)
arcsin(21)=6πA1
(a)(iii)
Find the exact value of f(67π).
[1]1 mark
Markscheme (a)(iii)
arcsin(−21)=−6πA1
(b)
Use your GDC to sketch the graph of y=f(x) for −π≤x≤2π. Clearly indicate the coordinates of any maximum and minimum points.
[3]3 marks
Markscheme (b)
a "zigzag" of straight line segments, crossing the x-axis at x=−π,0,π,2πA1
maximum point (2π,2π)A1
minimum points (−2π,−2π) and (23π,−2π)
Note: Accept decimal coordinates, for example (1.57,1.57). Award the second A1 only if the graph is drawn with sharp corners at these points (not smooth turning points).
(c)
Show that f(x)=π−x for 2π≤x≤23π.
[3]3 marks
Markscheme (c)
sin(π−x)=sinxM1
for 2π≤x≤23π
(d)(i)
Write down the period of f.
[1]1 mark
Markscheme (d)(i)
2πA1
(d)(ii)
Hence write down an expression for f(x) for 23π≤x≤25π.
[1]1 mark
Markscheme (d)(ii)
f(x)=x−2πA1
(e)
Show that f is an odd function.
[2]2 marks
Markscheme (e)
f(−x)=arcsin(sin(−x))=arcsin(−sinx)M1
=−arcsin(sinx), since arcsin is an odd function R1
=−f(x)AG
(f)(i)
Write down an expression for g(x) for 0≤x≤π.
[1]1 mark
Markscheme (f)(i)
g(x)=xA1
(f)(ii)
Show that g(x)=2π−x for π≤x≤2π.
[2]2 marks
Markscheme (f)(ii)
cos(2π−x)=cosxM1
for π≤x≤2π, 0≤2π−x≤π, the range of arccos
g(x)=arccos(cos(2π−x))=2π−xAG
(g)
Let h(x)=f(x)+g(x), for 0≤x≤2π.
Find an expression for h(x) on each of the intervals 0≤x≤2π, 2π≤x≤π, π≤x≤23π and 23π≤x≤2π.
[4]4 marks
Markscheme (g)
0≤x≤2π: h(x)=x+x=2x
(h)
Find all the solutions of the equation f(x)=2x, for x≥0.
[3]3 marks
Markscheme (h)
for 0≤x≤2π: x=2x⇒x=0A1
for 2π≤x≤23π: π−x=2x⇒x=32π
for x>π, 2x>2π≥f(x)
Note: Award the R1 for any valid argument that rules out solutions for larger x, for example a reference to the range of f.
(i)(i)
Show that, for cosx=0, f′(x)=∣cosx∣cosx.
[3]3 marks
Markscheme (i)(i)
attempt to use the chain rule with dud(arcsinu)=1−u21
(i)(ii)
Hence explain why f is not differentiable at x=2π.
[1]1 mark
Markscheme (i)(ii)
f′(x)=1 for x just less than 2π and f′(x)=−1 for x just greater than 2π, so the gradients on either side are different R1
(j)
Find the exact value of ∫010π∣f(x)∣dx.
[3]3 marks
Markscheme (j)
on 0≤x≤π the region under y=∣f(x)∣ is a triangle with base π and height 2π, area 4π2 M1A1
∣f(x)∣ has period π, so the integral is 10×4π2=25π2
. Outside the zeros the parabola is unchanged. The zeros
(−1,0)
and
(3,0)
are invariant and become sharp corners.
y = f(x)
y = |f(x)|
Only the part of the parabola under the x-axis changes: it is reflected, so the minimum (1, −4) becomes the local maximum (1, 4).
, and the minimum
(2,−1)
gives a second minimum
(−2,−1)
. The
y
-intercept
(0,3)
is on the mirror line, so it is invariant; the two halves meet there in a corner, a local maximum of
y=f(∣x∣)
.
y = f(x)
y = f(|x|)
For x ≥ 0 the two graphs are the same. For x < 0, y = f(|x|) is the mirror image of its right-hand half, not the original parabola.
, giving
(0,−41)
.
. The invariant points are
(2.5,1)
and
(1.5,−1)
.
, so the reciprocal graph is over the
x
-axis to the right of the asymptote and under it to the left. Since
f
is increasing,
f1
is decreasing on each branch.
y = 2x − 4
y = 1/(2x − 4)
The zero of the line at x = 2 becomes the vertical asymptote of the reciprocal. The two graphs meet where y = 1 and y = −1.
from over the axis: the horizontal asymptote is
y=0
.
.
and falling towards
−∞
at each asymptote. The two outer branches lie over the axis.
.
f(x)=−1
gives
x2=3
, so
x=±3
. There are four invariant points, at
x=±3
(where
y=−1
) and
x=±5
(where
y=1
).
y = x² − 4
y = 1/(x² − 4)
The minimum (0, −4) of the parabola becomes the maximum (0, −1/4) of the reciprocal. The middle branch stays under the x-axis, where the parabola is negative.
.
, valid for
x=0
and
x=1
, which confirms all three features. Strictly,
f1
is not defined at
x=1
, because
f(1)
does not exist, so the point
(1,0)
is not part of the graph; the curve only approaches it.
y = x/(x − 1)
y = 1/f(x) = (x − 1)/x
The zero of f at x = 0 becomes the reciprocal's vertical asymptote, and f's asymptote x = 1 becomes the reciprocal's zero. Both graphs share the asymptote y = 1.
with value
(−4)2=16
. Between the two minima the graph rises to it, so
(0,16)
is a local maximum.
y = x² − 4
y = (x² − 4)²
Squaring turns the zeros into points where the graph touches the axis, and the minimum (0, −4) into the local maximum (0, 16).
. The zeros are
x=−1
and
x=2
.
. The maximum
(3,6)↦(0,6)
.
-axis followed by a translation by
(30)
. Check:
(3,6)↦(−3,6)↦(0,6)
.
,
(5,0)
and
(0,5)
are unchanged.
y = |f(x)|
The line y = 3 meets the graph four times: twice on the reflected hump and once on each outer branch.
, so
, so
(x−2)(x−4)=0
and
x=2
or
x=4
.
and
3+7
. No check for extraneous solutions is needed because the right-hand side, 3, is a positive constant.
there are three solutions, at
k=0
two, and for
k>4
two.)
, the horizontal asymptote is
y=0
.
-intercept is
(0,51)
. The middle branch lies under the
x
-axis; the outer branches lie over it.
y = 1/f(x)
The two zeros of f become vertical asymptotes, and the vertex of the parabola becomes the maximum of the middle branch.
y = |x³ − 4x|
The graph is at or under the line y = 2 on three separate intervals, one around each zero.
,
−1.68
,
−0.539
,
0.539
,
1.68
and
2.21
. The graph is on or under the line near each zero, so
gives
x=±32
, and
(approximately
3.08
).
are non-negative. Since
0<2<9163
, part (c) gives exactly six solutions, the six values found in (b).
A1
,
−2π≤π−x≤2π
R1
so π−x lies in the range of arcsin and arcsin(sinx)=arcsin(sin(π−x))=π−xA1