D.3 Hazard risk and vulnerability
Profile geophysical hazard events, explain their varied impacts on human well-being, and examine why vulnerability differed between and within communities, using two earthquakes, two eruptions and two mass movements.
- IB Geography
- Part of D Geophysical hazards
- SL and HL
Key terms introduced here
Each is in the Geography glossary, with every other term in the subject.
- Areal extent
The size of the area affected by a hazard event, from a single slope or valley to a whole region or, for ash clouds and tsunamis, an ocean basin.
- Cascading hazard
A chain of hazards in which one event triggers others, such as an earthquake causing landslides, liquefaction and a tsunami, or an eruption followed by lahars.
- Differential vulnerability
The unequal susceptibility to harm of different groups within the same place exposed to the same hazard, because of differences in income, gender, age, disability, ethnicity, legal status or housing.
- Direct impact
An effect caused immediately and physically by a hazard event, such as deaths, injuries, collapsed buildings and destroyed roads or crops.
- Duration
The length of time for which a hazard event lasts, from seconds for an earthquake's main shaking to months or years for an eruption or a slow landslide.
- Economic loss
The monetary value of the damage and disruption caused by a hazard event, including destroyed property and infrastructure and lost production, whether or not it is insured.
- Fatalism
An attitude to hazards in which people accept losses as inevitable or as the will of a higher power and believe that little can be done to prevent them.
- Hazard event profile
A diagram or table that compares the physical characteristics of a hazard event, such as magnitude, frequency, duration, areal extent, speed of onset and spatial predictability, on a scale from low to high.
- Hazard perception
The way in which individuals or groups understand and judge the threat posed by a hazard, shaped by experience, knowledge, culture, religion, wealth and trust in authorities.
- Human well-being
The quality of people's lives in all its dimensions, including health, safety, housing, income and livelihoods, education, social relationships, culture and the ability to make choices.
- Impact per capita
A measure of a hazard's impact divided by the population of the area affected, such as deaths per 100,000 people, so that impacts on places of different size can be compared fairly.
- Indirect impact
An effect that follows from the direct damage of a hazard event, often later or further away, such as lost income, disease, interrupted schooling or disrupted supply chains.
- Insured loss
The part of the economic loss from a hazard event that insurance companies pay out to policyholders; it is usually a large share of losses in high-income countries and a small share in low-income countries.
- Place attachment
The emotional bond between people and a place, built through family history, community, identity and livelihoods, which can lead people to stay in or return to hazardous places.
- Post-traumatic stress
A mental health condition that can follow a frightening or distressing event such as a disaster, with symptoms including flashbacks, anxiety, sleep problems and avoidance that can last for months or years.
- Preparedness
The knowledge, plans, resources and practised actions that individuals, households and communities have in place to respond effectively before and during a hazard event.
- Spatial predictability
How accurately the location of a future hazard event can be known in advance, for example along a mapped fault, on the flanks of a known volcano or on a slope with a landslide history.
Notes on D.3 Hazard risk and vulnerability
Learning objectives
Describe the hazard event profile of an earthquake, a volcanic eruption and a mass movement, including their secondary hazards.
Construct a hazard event profile for a named event from real data.
Distinguish between direct and indirect impacts, and between absolute and relative measures of impact.
Explain the varied impacts of geophysical hazards on different aspects of human well-being, at local, national and global scales.
Determine deaths per 100,000 people and economic loss as a percentage of GDP, and suggest why the results differ between events.
Explain why vulnerability varies between communities and within the same community.
Examine how hazard perception, personal knowledge and preparedness vary from place to place and affect the outcome of an event.
Compare and contrast two earthquakes, two volcanic events and two mass movements in their profiles, impacts and patterns of vulnerability.
Evaluate the relative importance of physical and human factors in explaining the impacts of geophysical hazards.
Introduction
The same kind of hazard can kill tens of thousands of people in one place and almost nobody in another. Two earthquakes of magnitude 7.8, in Türkiye in 2023 and in New Zealand in 2016, killed more than 59,000 people (in Türkiye and neighbouring Syria) and 2 people respectively. Explaining such contrasts needs knowledge of the physical event, of the people it strikes and of decisions taken long before it.
Two key concepts are central. Place matters because a location’s buildings, wealth, isolation and history of hazards shape what happens when an event occurs. Power matters in two senses: the physical power of the hazard itself, and the power of governments, landowners, builders and households to decide who lives where, how buildings are made and who receives help. The six events that follow, two earthquakes, two volcanic eruptions and two mass movements, show both at work.
Hazard event profiles
Before the impacts of an event can be explained, the event itself has to be described precisely. A hazard is a potential threat to people and property; a disaster occurs when a hazard event seriously disrupts a community beyond its capacity to cope. The physical characteristics of the hazard event set the scale of the threat, and geographers summarise them in a hazard event profile.
The profile describes the hazard, not its impacts such as deaths or damage, so that two events can be compared on the same axes. It is drawn as horizontal bars or as a radar diagram.
The six characteristics
Characteristic | Low | High |
|---|---|---|
Magnitude (physical size) | Mw 5 earthquake; VEI 1 eruption; one rockfall | Mw 9 earthquake; VEI 6 eruption; a whole hillside failing |
Frequency (how often in this place) | Once in several centuries | Every year or season |
Duration | Seconds to minutes | Months to years |
Areal extent | One slope or valley | A whole region or an ocean basin |
Speed of onset | Weeks of warning signs | Seconds or no warning |
Spatial predictability | Unmapped faults or slopes | A known volcano, mapped fault or active landslide |
Hazard magnitude and hazard frequency are linked: large events are rarer than small ones, which is the magnitude-frequency relationship. Duration, areal extent and spatial predictability need more explanation than the table can give.
Areal extent describes the footprint of the hazard. Hazards with a large areal extent are harder to respond to, because help has to reach many places at once.
Spatial predictability is different from forecasting the time of an event: faults, volcano valleys and unstable slopes can be mapped even when the timing of an event cannot be known.
Typical profiles of the three hazard types
Each hazard type has a characteristic profile, although individual events differ from these averages.
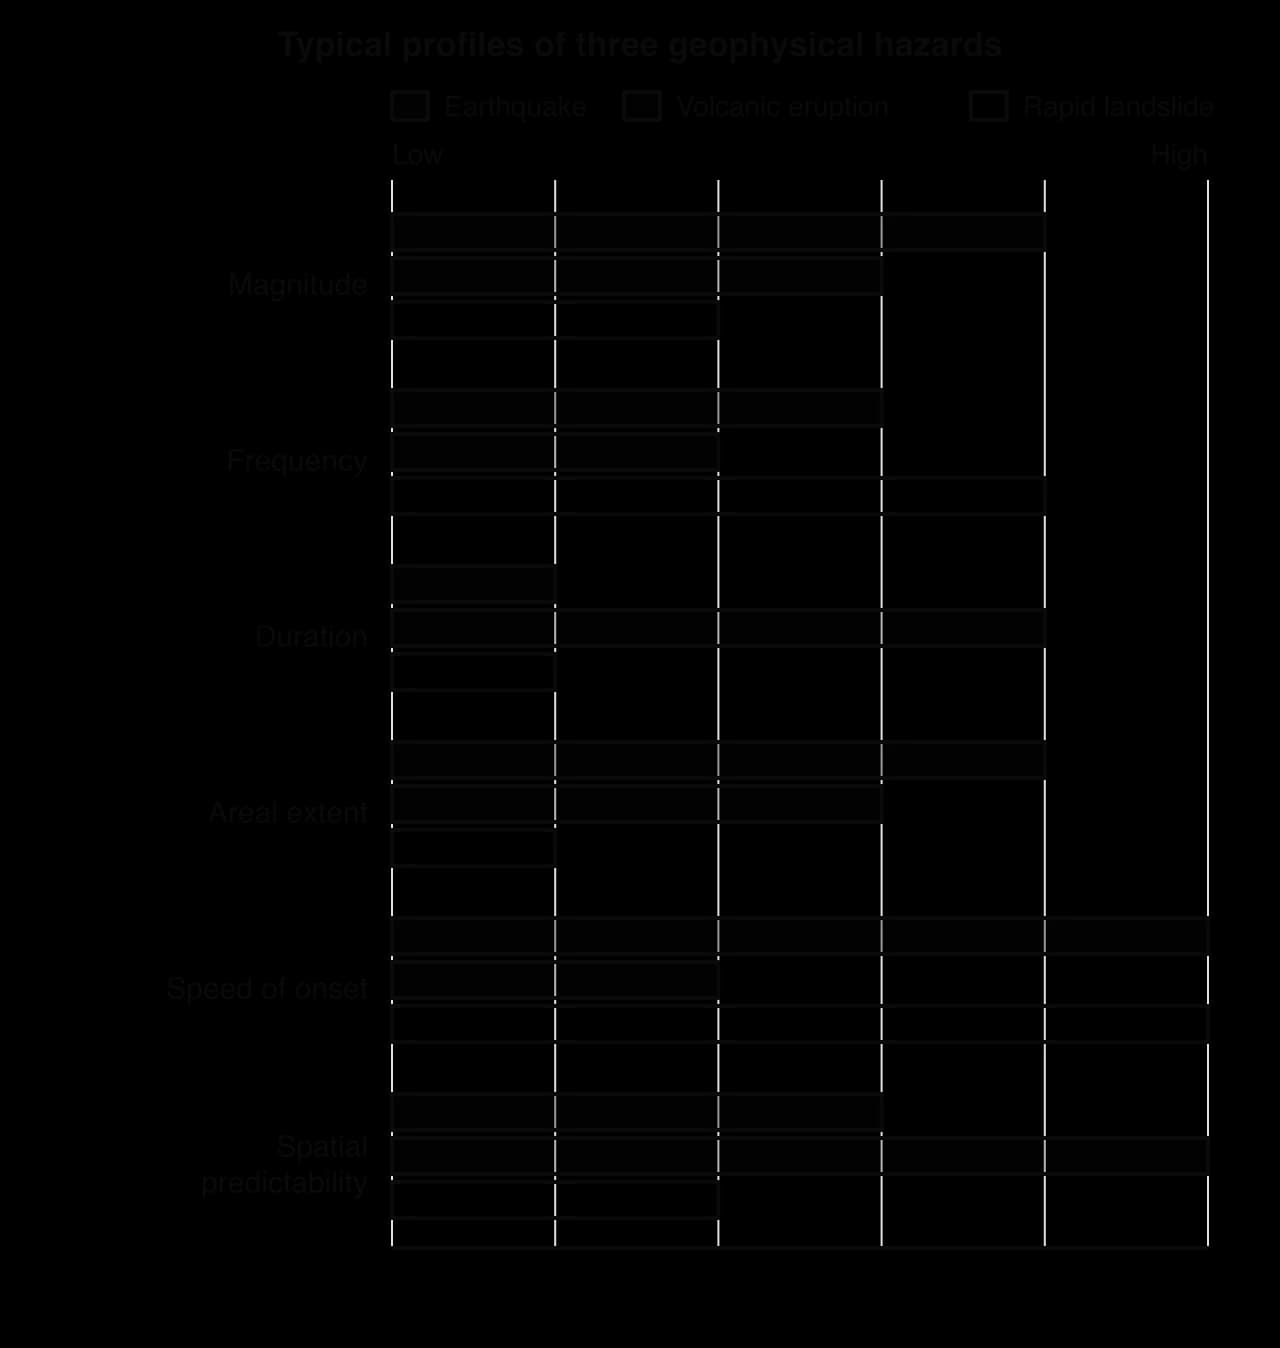
The profiles explain why the hazards kill in different ways. Earthquakes strike without warning across a wide area, so deaths depend on whether buildings stand up; volcanoes give warning at a known place, so deaths depend on monitoring and evacuation; rapid landslides are sudden and local, so deaths depend on where people live.
Building a profile from data
A profile for a named event is built from published measurements: United States Geological Survey (USGS) event pages for earthquakes, the Smithsonian Institution’s Global Volcanism Program for eruptions, and geological survey reports for mass movements. Each characteristic is then scored from 1 (low) to 5 (high).
Primary, secondary and cascading hazards
Very few geophysical events consist of a single hazard. A primary hazard is caused directly by the event, such as ground shaking, a lava flow or a rockfall. A secondary hazard results from the primary one, such as liquefaction or a tsunami after an earthquake, or a lahar after an eruption. When each hazard triggers the next, the sequence is a cascading hazard.
Hazard type | Primary hazards | Typical secondary hazards |
|---|---|---|
Earthquake | Ground shaking; surface rupture | Aftershocks, landslides, liquefaction, tsunamis, fires, disease |
Volcanic eruption | Lava, pyroclastic flows, ash fall, gases | Lahars, flank collapse, tsunamis, crop failure |
Mass movement | Rockfall, slide or flow | Landslide dams and outburst floods; isolation of communities |
Secondary hazards often cause more deaths than the primary event: in 2004 the Indian Ocean tsunami killed far more people than the shaking, and in 1985 a lahar from Nevado del Ruiz buried the Colombian town of Armero. They also stretch the duration of a disaster, because aftershocks and lahars continue for months.
Impacts on human well-being
The impacts of a hazard are measured on people and their lives. Geographers use the idea of human well-being to capture everything that a disaster can damage, from a person’s life and health to the culture and community that give their life meaning.
Dimensions of well-being
A disaster affects well-being in many linked ways.
Dimension | What can be lost | Example |
|---|---|---|
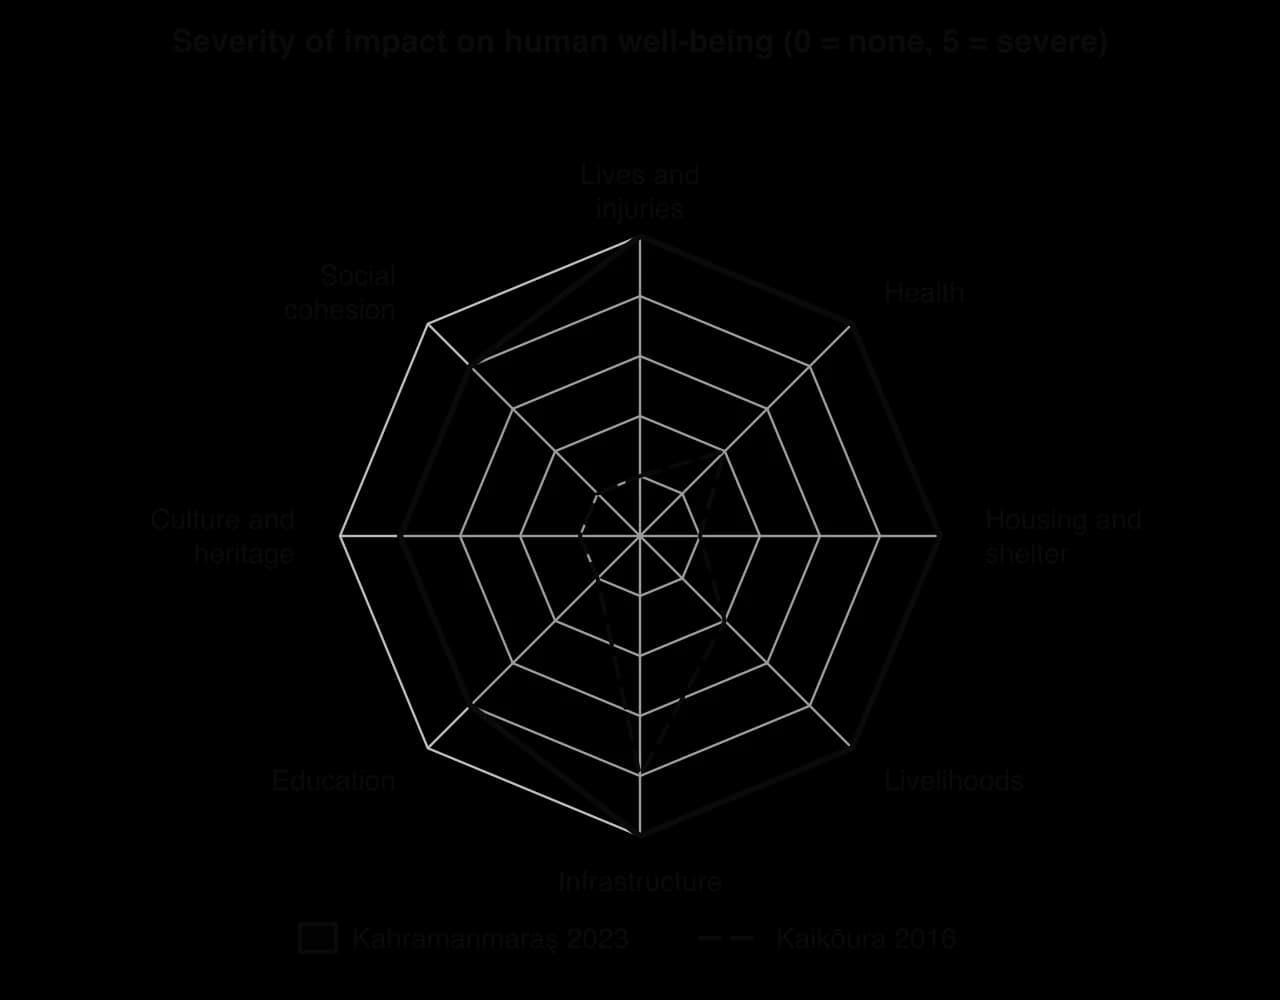
Life and safety | Deaths, injuries, people missing | More than 59,000 deaths in Türkiye and Syria, 2023 |
Health | Disease where water and sanitation fail; mental illness | Cholera already present in north-west Syria in 2023 |
Housing and shelter | Homes destroyed; displacement | More than 2 million left the affected provinces of Türkiye |
Livelihoods | Jobs, crops, livestock, businesses | About 8,500 ha of crops destroyed by Fuego in 2018 |
Infrastructure | Roads, water, power, hospitals | State Highway 1 north of Kaikōura closed for over a year |
Education | Schools destroyed or used as shelters | Five schools destroyed near Goma in 2021 |
Culture and heritage | Historic buildings, places of worship | The Citadel of Aleppo damaged in 2023 |
Social cohesion | Families split; trust in authorities lost | Anger at late evacuation orders at Fuego in 2018 |
The dimensions interact: when a road is cut, people lose access to work, schools and hospitals at once, and poorer households, with fewer reserves, are pushed from one loss to the next.
Direct and indirect impacts
Impacts are often classified by how they are caused. Direct impacts come immediately from the physical hazard.
Indirect impacts follow from the direct damage, often later and sometimes far away.
Indirect impacts can be larger and last longer than direct ones. After the 2016 Kaikōura earthquake, the closure of the main road and rail link between Picton and Christchurch disrupted freight across the South Island for months. After the 2024 Wayanad landslides, estate workers lost their workplaces as well as their homes.
Short-term and long-term impacts
Short-term impacts occur in the hours and weeks after an event (deaths, injuries, loss of shelter, water and power); long-term impacts last months to decades (lost livelihoods, slow rebuilding, out-migration, debt).
Mental health is one of the least visible long-term impacts. Many survivors develop post-traumatic stress, which official statistics rarely count.
Impacts at different scales
Impacts change in kind as the scale widens. At the local scale they are personal: a house, a family, a village, as when pyroclastic flows buried San Miguel Los Lotes in Guatemala in 2018. At the regional and national scale they appear as lost production, public spending and displacement: in 2023 more than 20% of Türkiye’s agricultural production was affected by the earthquakes. At the global scale they travel through supply chains, aid and rescue teams: more than 141,000 people from 94 countries joined the rescue effort in Türkiye.
Most geophysical events have local or regional impacts only; very large eruptions and great earthquakes with ocean-wide tsunamis are the exceptions. Through spatial interactions, the impacts of an event in one place reach others along the flows that link them.
Measuring impacts: absolute and relative measures
Comparing impacts fairly needs care. Absolute measures, such as total deaths or total losses in US dollars, show the size of an impact. Relative measures divide by the size of the population or economy, which shows how severe the impact was for the place that suffered it.
Economic loss is usually far higher in high-income countries (HICs), because the buildings and infrastructure destroyed are worth more.
A large share of that loss in HICs is often an insured loss, paid by insurance companies. In low-income countries (LICs) insured losses are small, so households and governments carry most of the cost themselves.
An impact per capita divides an impact by the population affected. The two most common are deaths per 100,000 people and economic loss as a percentage of gross domestic product (GDP).
Why vulnerability varies between and within communities
Vulnerability is the susceptibility of people, property and places to harm from a hazard. In the hazard risk equation, risk rises with the hazard and with vulnerability and falls with the capacity to cope. Exposure, being where the hazard strikes, is the first condition.
Vulnerability differs between communities, such as countries, cities and villages, and within a community, because not everyone in the same street has the same means to escape and recover.
Vulnerability between communities
The general factors that make one place more vulnerable than another are economic, social, demographic and political, and the Pressure and Release model traces them from root causes through dynamic pressures to unsafe conditions.
Factor | How it raises or lowers vulnerability | Contrast among the six events |
|---|---|---|
Wealth and technology | Pays for strong buildings, monitoring, warnings and insurance | The Goma Volcano Observatory could not pay for internet access before 2021 |
Governance | Enforces building codes and planning; issues trusted warnings | Amnesties in Türkiye legalised unsafe buildings; late evacuation orders at Fuego |
Conflict | Destroys infrastructure and blocks aid | Aid to north-west Syria entered through one crossing in 2023 |
Demography | High density in unsafe buildings | Dense apartment blocks in Antakya |
Location | Distance, time of day and degree of isolation change exposure and access to help | Kaikōura cut off by landslides; a 04:17 earthquake in Türkiye |
These factors act together: poverty pushes people onto cheap land in hazard zones, weak governance allows unsafe building there, and isolation slows help afterwards.
Vulnerability within communities
Within a single city or village, those with the least money, the weakest housing and the least access to information usually suffer most. Geographers call this differential vulnerability.
Group | Why they are more vulnerable | Example |
|---|---|---|
Low-income households | Weaker buildings on more hazardous land; few savings or insurance | Unplanned hillside settlements in Freetown, Sierra Leone, hit by a mudslide in 2017 |
Women and girls | Caring roles; less access to warnings, land titles and relief | More women than men died in many Aceh villages in the 2004 tsunami |
Children and older people | Less able to escape or survive injury and cold | Many who died in the 2024 Noto earthquake, Japan, were older people |
People with disabilities | Warnings, routes and shelters hard to use | Evacuation plans that assume everyone can walk to high ground |
Refugees and migrants | Insecure legal status, language barriers, poor housing | At least 6,600 Syrians in Türkiye killed in 2023 |
Renters and informal residents | No control over building quality; may not qualify for compensation | Plantation workers’ housing in Wayanad |
These characteristics often overlap in the same person. The groups with least power over where and how they live are the most likely to be harmed, which makes vulnerability a question of equity as much as of physical geography.
Why are women and girls often more vulnerable?
The causes are social. In many places women spend more time at home caring for children and older relatives, so they are indoors or near the shore when a hazard strikes; fewer have learned to swim or climb, and they may have less access to warnings, to land titles that qualify a household for rebuilding aid and to the meetings where recovery is planned. After a disaster, crowded shelters and lost incomes add risks of violence and trafficking.
Mapping vulnerability within a city
Vulnerability can be mapped by scoring each district on building age, population density, the share of residents under 5 or over 65 and income, and adding the scores into an index shown as a choropleth map. Overlaid on a hazard map, it shows where high vulnerability meets high hazard.
Hazard perception
People respond to the risk they perceive, not only to the scientific measure of risk. Hazard perception, one form of risk perception, explains why some people prepare carefully while their neighbours do nothing.
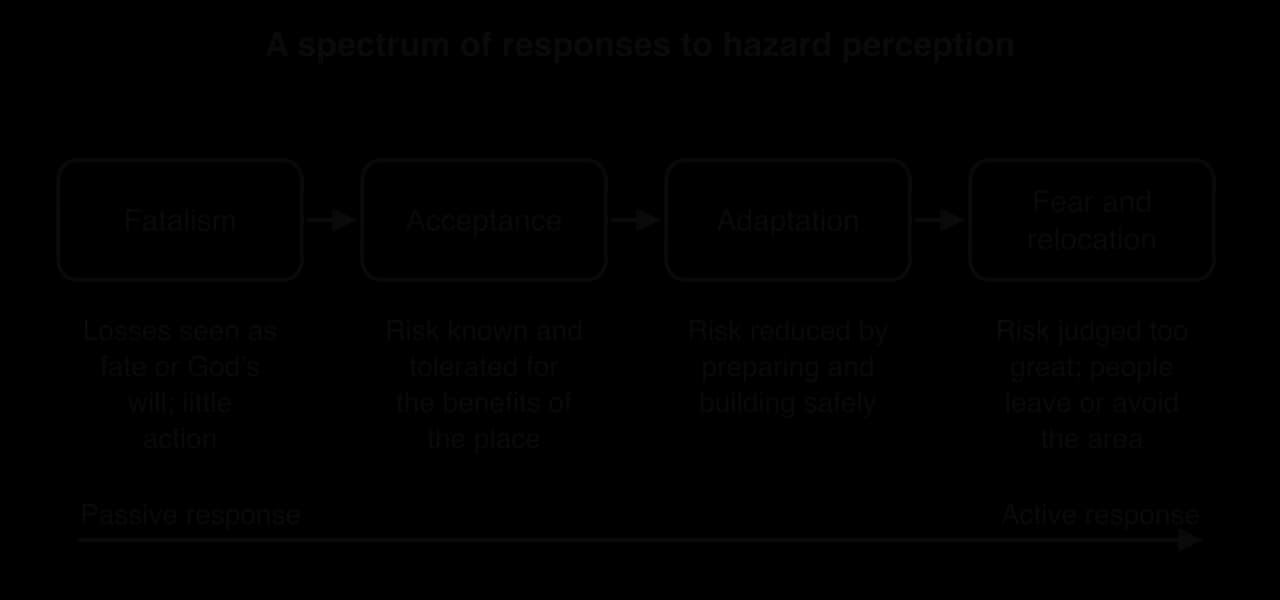
At one end of the spectrum is fatalism, in which losses are seen as inevitable or as the will of God, so little is done to prevent them. Fatalism often reflects a lack of power to act more than a lack of knowledge. Acceptance tolerates a known risk for the benefits of the place, adaptation reduces it while staying, and fear leads people to relocate. Denial, the belief that "it won’t happen to me", sits apart from the spectrum: people who deny the risk take no action at all, and denial is common where the last damaging event is beyond living memory.
Why hazard perception varies from place to place
Experience: people who have lived through an event usually judge the hazard more accurately, but the memory fades as years pass without one.
Distance from the hazard: those closer to a volcano or fault usually perceive more risk, although frequent small events can come to seem normal.
Education and information: schools, drills, media and hazard maps shape what people know; misinformation spreads quickly after events.
Culture, religion and trust: beliefs can encourage fatalism or preserve warnings; people who distrust authorities are less likely to evacuate.
Wealth and power: those who can afford to act tend to see a hazard as manageable; those who cannot are more likely to accept or deny it.
Perception can also be distorted by protection. A strong defence, such as a levee or seawall, can make people feel completely safe, encouraging more building behind it, a process known for floods as the levee effect. An unenforced building code has the same effect.
Perception surveys are a common fieldwork method for studying hazards. The table gives the results of a survey of 200 residents in each of two districts of a hypothetical city on an active fault (hypothetical data).
Response | District A (older housing, low income) | District B (new housing, high income) |
|---|---|---|
Damaging earthquake "very likely" | 38% | 61% |
"It is in God’s hands" | 44% | 12% |
Has an emergency kit | 9% | 47% |
Has taken part in a drill | 15% | 58% |
Personal knowledge and preparedness
Knowledge of a hazard reduces harm when people act on it before and during an event, which is the basis of preparedness.
Personal preparedness includes knowing the warning signs and what to do, an emergency kit, secured furniture, a family meeting place and a known evacuation route. Drills turn this knowledge into habit, so that people act in seconds.
Simeulue, an island off Sumatra, Indonesia, shows the power of local knowledge. It lay close to the epicentre of the magnitude 9.1 Indian Ocean earthquake of 2004, yet only seven of its roughly 70,000 inhabitants died. After a tsunami in 1907 killed more than half the islanders, an oral tradition called smong taught people to run to high ground when the ground shakes and the sea retreats. In 2004 the islanders followed it and moved inland within minutes of the shaking.
Preparedness varies for the same reasons as perception, and it includes building choices: a household that can afford a reinforced or timber-framed home has reduced its vulnerability long before any warning is given.
Why people stay in hazardous places
Millions of people live on active volcanoes, major faults and unstable hillsides, for economic, social and emotional reasons.
Livelihoods: fertile volcanic soils, geothermal energy, tourism and jobs in cities on faults.
Land ownership and cost: families may own land in the hazard zone and be unable to afford land elsewhere.
Lack of alternatives: governments may offer no safe land, or relocation sites may be far from work and services.
Attachment to place: family history, community, identity and religion tie people to particular places.
Place attachment can increase risk, because people resist relocation, but it can also build resilience, because strong communities organise their own rescue and rebuilding. After the 2021 eruption, the authorities considered moving parts of Goma to Sake, a costly and difficult plan for a city whose residents have rebuilt after every eruption.
Case study: Kahramanmaraş 2023 and Kaikōura 2016, two earthquakes of the same magnitude
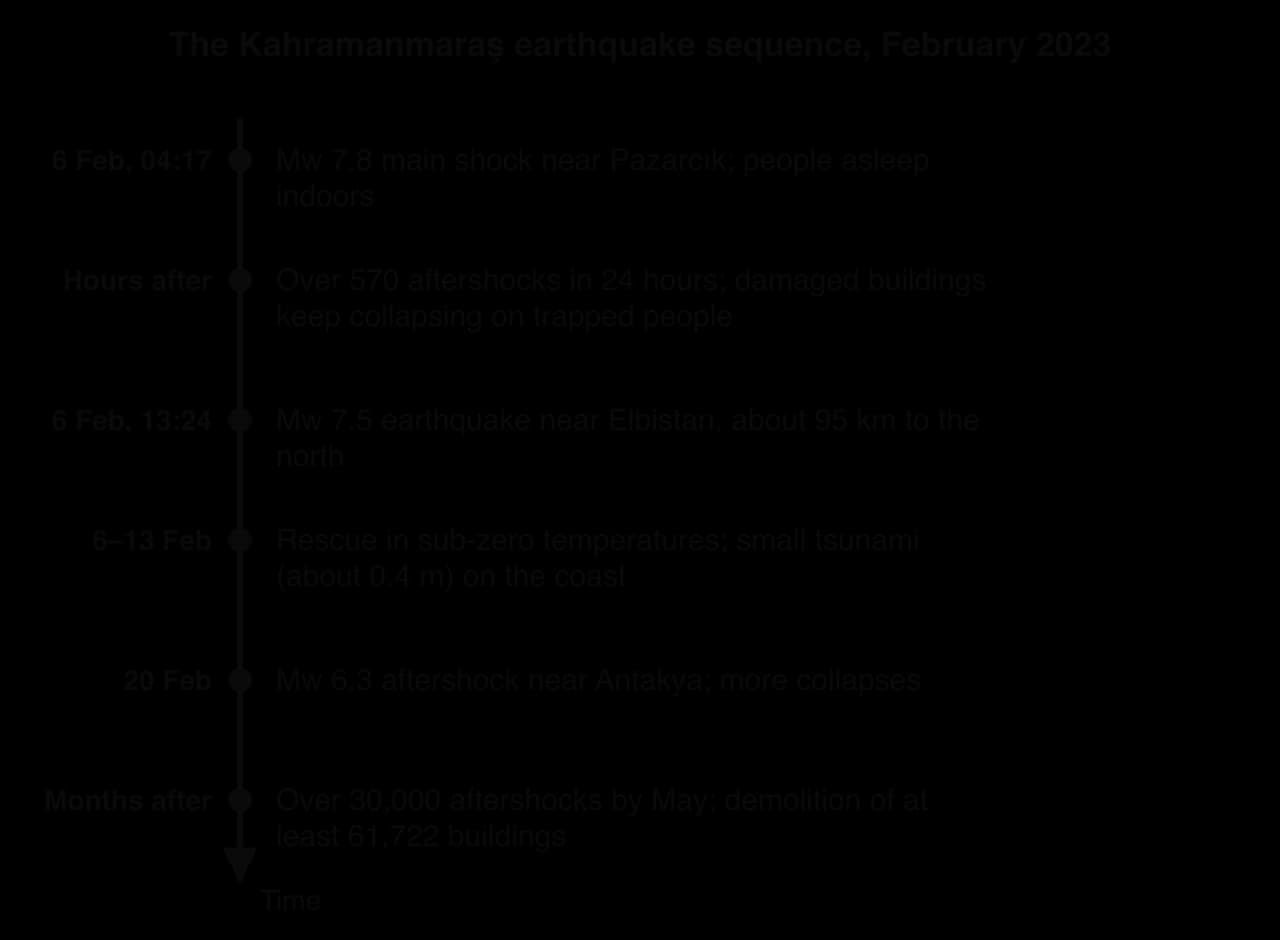
On 6 February 2023 and on 14 November 2016, earthquakes of moment magnitude 7.8 struck south-eastern Türkiye and the north-east of New Zealand’s South Island. Both were shallow, night-time ruptures on land. The Kahramanmaraş earthquakes killed at least 59,000 people in Türkiye and Syria; the Kaikōura earthquake killed two.
Location and setting
South-eastern Türkiye lies where the Anatolian plate is being squeezed westwards between the Arabian and Eurasian plates. The East Anatolian Fault, a transform boundary with left-lateral strike-slip motion, runs from eastern Türkiye south-west towards the Mediterranean near Antakya. About 14 million people, 16% of Türkiye’s population, lived in the affected area, in fast-growing cities such as Gaziantep, Kahramanmaraş, Adıyaman and Antakya, and north-west Syria across the border, much of it held by opposition groups after more than a decade of civil war. Türkiye is an upper-middle-income country; Syria’s economy had been devastated by the war.
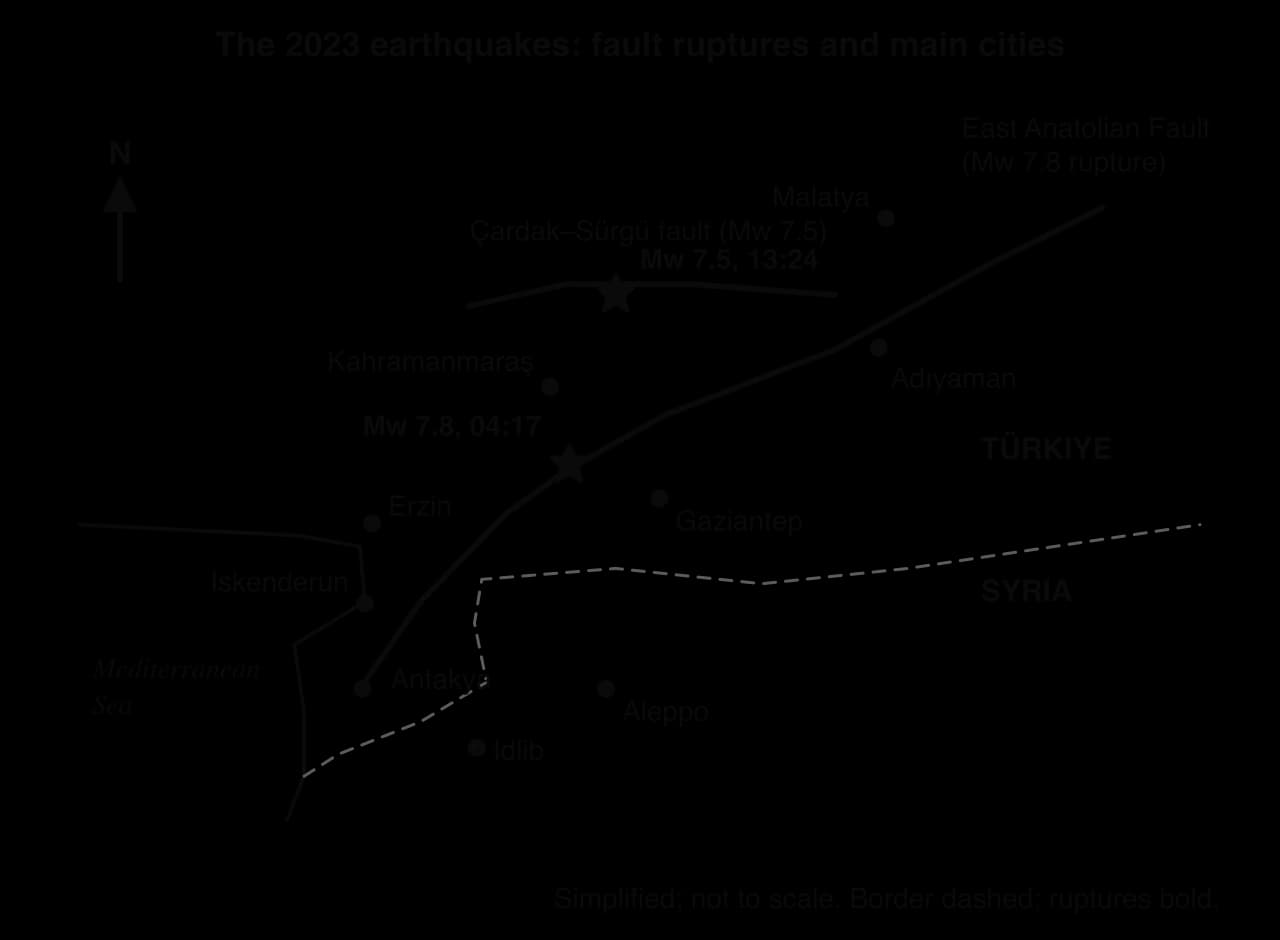
Kaikōura is a small coastal town of about 2,000 residents, with about 1,200 tourists in town on the night of the earthquake, in the zone where the Pacific–Australian plate boundary changes from subduction to transform motion. New Zealand is a high-income country with a GNI per capita of US$39,440 in 2016, strict building codes and a national public scheme that insures homes against earthquake damage.
The event profiles and secondary hazards
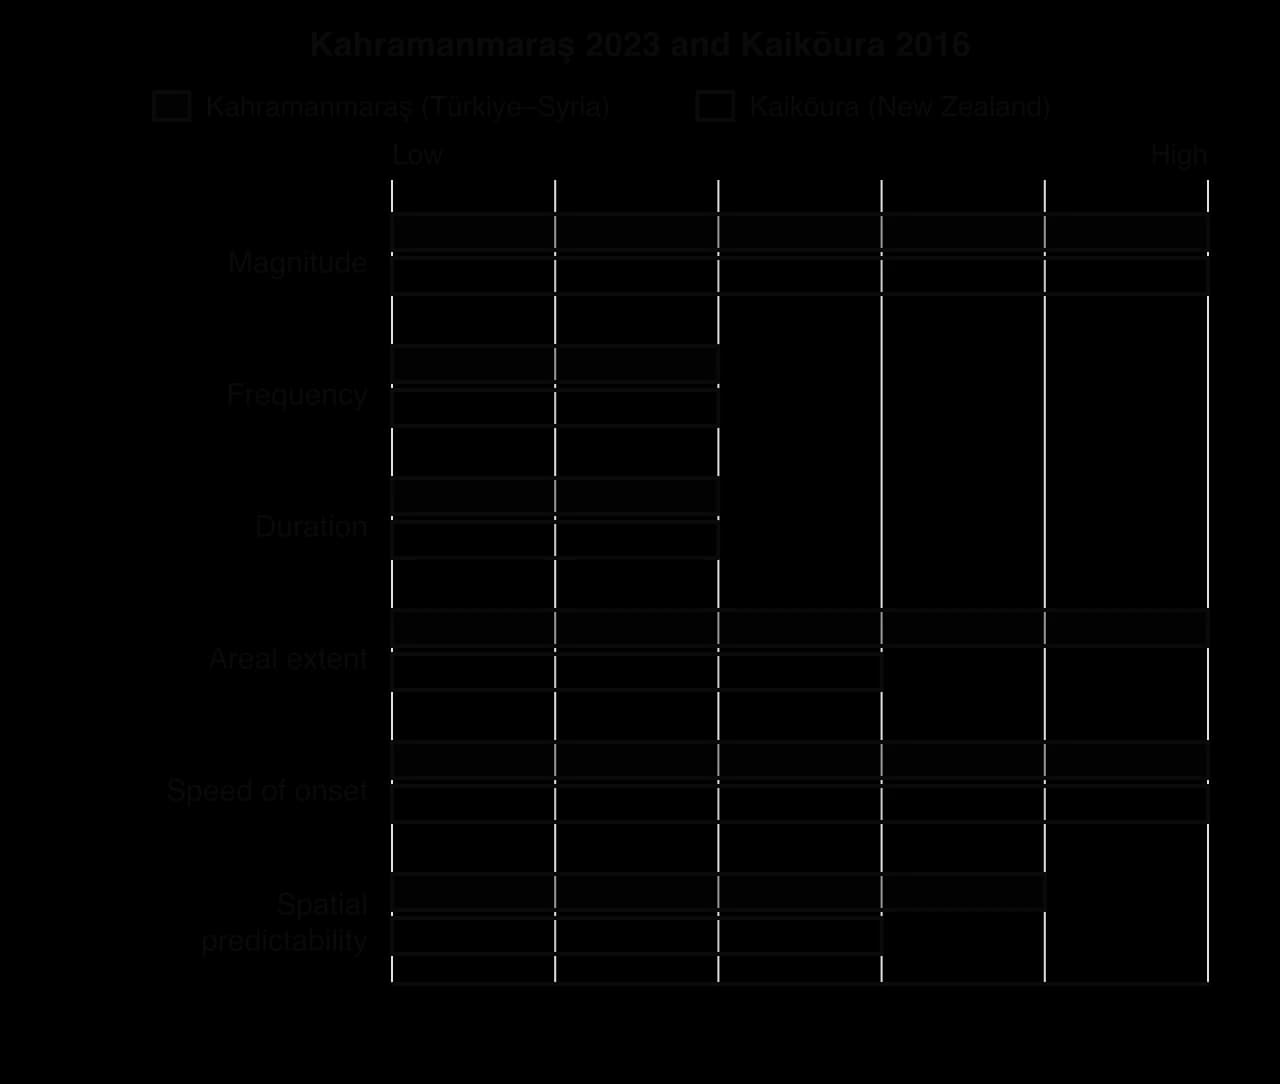
Characteristic | Kahramanmaraş, Türkiye and Syria | Kaikōura, New Zealand |
|---|---|---|
Date and local time | 6 February 2023, 04:17 (Mw 7.8) and 13:24 (Mw 7.5) | 14 November 2016, 00:02 |
Magnitude and depth | Mw 7.8, about 10 km deep; then Mw 7.5 (USGS), 7.4 km deep | Mw 7.8, about 15 km deep |
Fault and motion | Left-lateral strike-slip on the East Anatolian Fault, about 350 km rupture; second rupture on the Çardak–Sürgü fault | Oblique and strike-slip ruptures on about 25 faults, up to 200 km; slip of up to 12 m on the Kekerengu Fault |
Maximum intensity | MMI XII (extreme) near the fault | MMI IX (violent) |
Areal extent | Damage over about 350,000 km² | Mainly a sparsely populated coast and mountains |
Secondary hazards | Over 30,000 aftershocks by May 2023; a 0.4 m tsunami; freezing weather | Tens of thousands of landslides; uplift of up to 6 m; a tsunami of up to 7 m at mid to low tide |
Both were cascading hazards. In Türkiye the second earthquake brought down buildings already weakened and struck rescuers at work. In New Zealand landslides cut State Highway 1 and the railway on both sides of Kaikōura, and the uplifted seabed left boats in the harbour resting on rock.
Impacts on human well-being
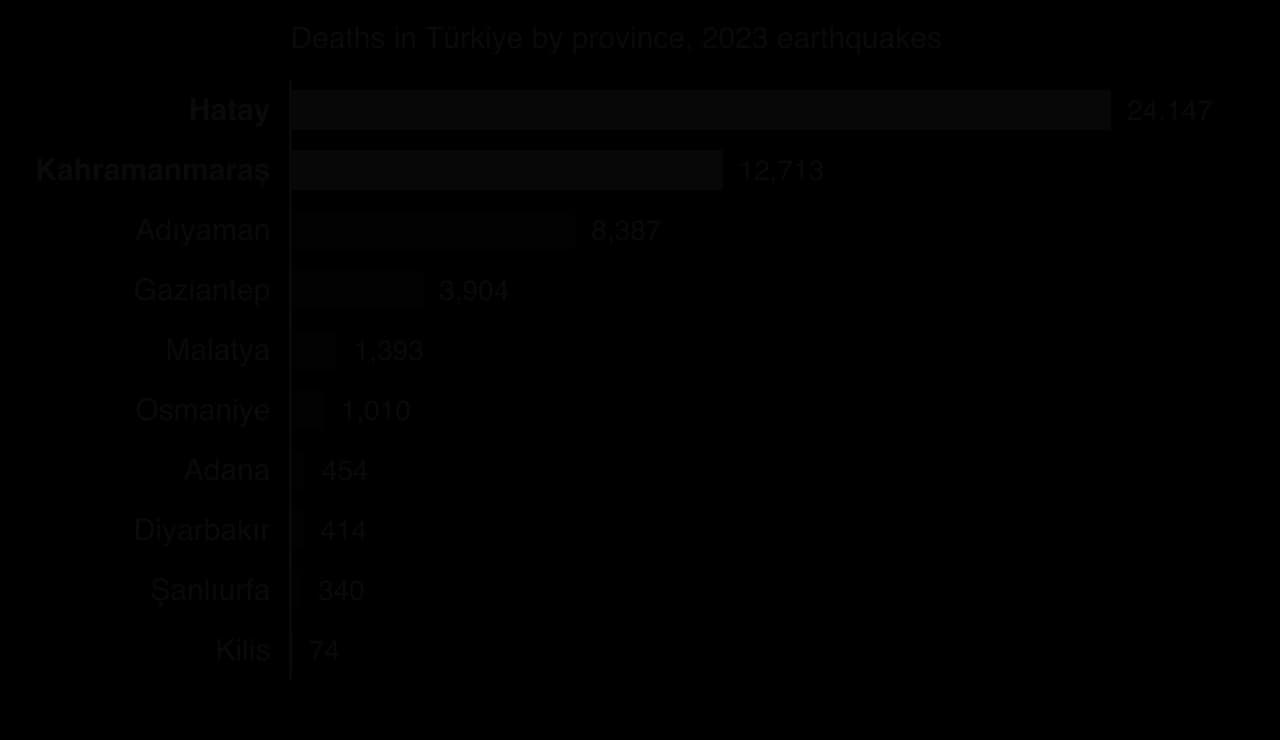
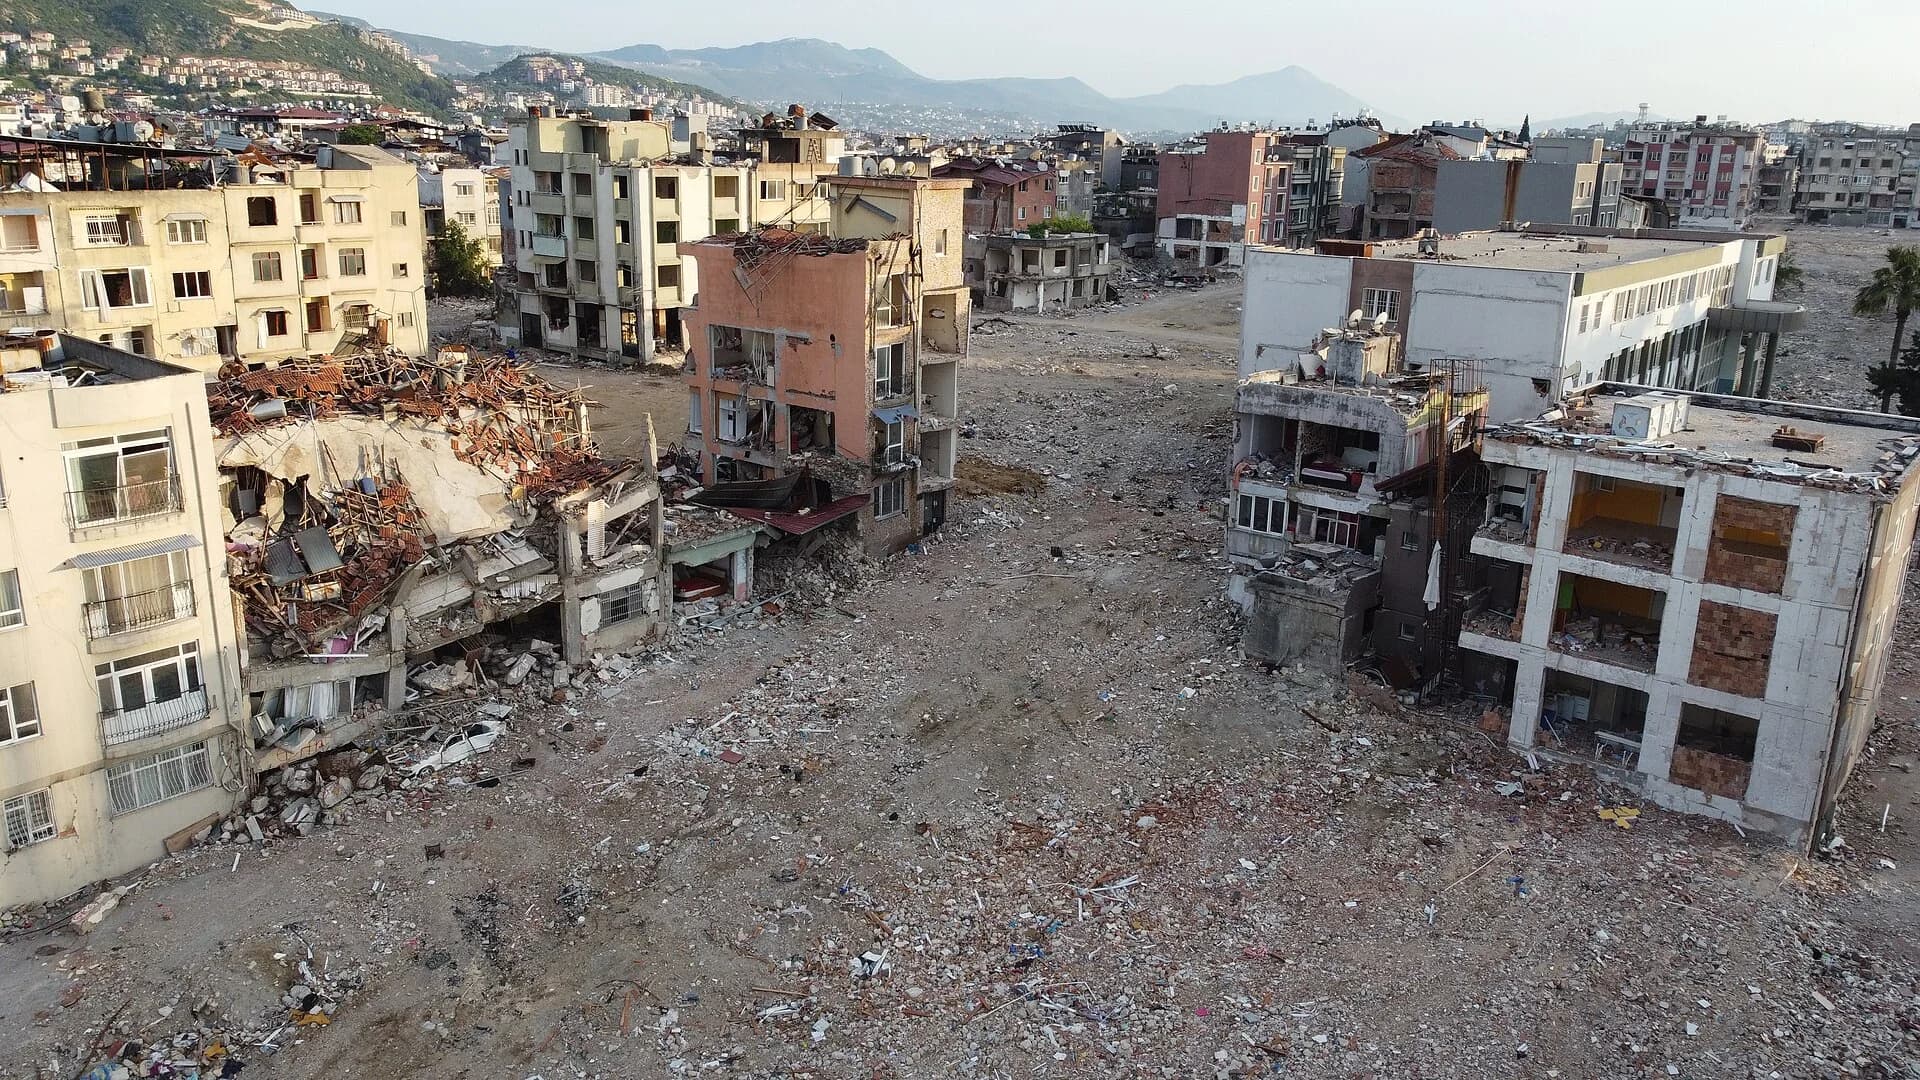
In Türkiye the official toll reached 53,537 deaths and 107,213 injuries in 11 provinces, and estimates for Syria range from 5,951 to 8,476 deaths. Hatay province alone recorded 24,147 deaths, and about 70% of homes in its capital, Antakya, collapsed. Inspections of 1.25 million buildings found 164,000 destroyed or severely damaged, and at least 61,722 had to be demolished. More than 2 million people left the affected provinces, and the International Organization for Migration estimated that over 2.7 million were made homeless.
The indirect impacts spread across every dimension of well-being. About 658,000 workers lost their livelihoods, some people trapped in Adıyaman died of hypothermia, and water shortages raised the risk of disease in shelters. In Syria, at least 453 schools were damaged. Losses were estimated at about US$150 billion in Türkiye and US$9 billion in Syria, about 18% of Syria’s GDP.
Social cohesion suffered too: anger grew over buildings that should not have collapsed, and contractors were investigated and arrested.
In New Zealand, two people died: a man crushed when a historic homestead collapsed near Kaikōura and a woman at Mount Lyford. The main impacts were on infrastructure: State Highway 1 north of Kaikōura reopened only on 15 December 2017, and the rebuilding and strengthening of the coastal road and railway was completed in late 2020 at a cost of NZ$1.25 billion.
Kaikōura was cut off by land, and more than 900 people, many of them tourists, were evacuated by helicopter and by sea, about 450 of them on the navy ship HMNZS Canterbury. Insurers received more than 45,000 claims worth NZ$2.27 billion (US$1.62 billion), and several office buildings in Wellington, across Cook Strait, were later demolished.
Why vulnerability was so different between the two places
Four differences in the human setting explain most of the contrast.
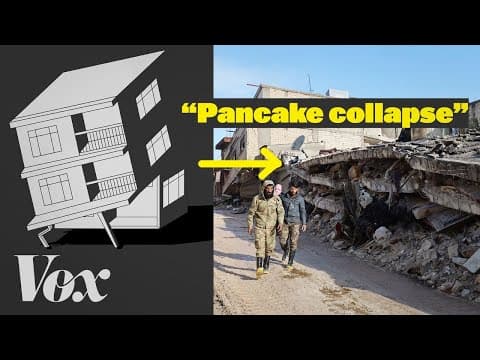
Building quality and enforcement. Türkiye strengthened its building codes after the İzmit earthquake of 1999, but many buildings were not built to the code, and the government’s 2018 zoning amnesty allowed owners to register buildings that broke planning and safety rules for a fee. About 75,000 buildings in the earthquake zone had been registered in this way, according to Turkish engineers and planners. Many concrete blocks with weak ground floors and too little steel collapsed floor on floor. In New Zealand, codes are enforced and most homes in the region were low-rise and timber-framed, a form of construction that flexes rather than collapses.
Exposure and density. The rupture in Türkiye passed through or near cities of hundreds of thousands of people living in multi-storey apartment blocks. Kaikōura and the surrounding Canterbury and Marlborough districts are among the most sparsely populated parts of New Zealand.
Conflict and governance. In north-west Syria, years of war had destroyed hospitals and weakened buildings, and millions of people were already displaced. Aid to the opposition-held north-west could enter only through the Bab al-Hawa crossing, and by 14 February only 58 aid trucks had crossed.
Capacity to cope. New Zealand could evacuate tourists by sea and air within days, insurance paid for rebuilding, and the state rebuilt the transport corridor. In Türkiye, rescuers were overwhelmed by collapses across 11 provinces at once, in winter.
Time of day was the same in both events: people were asleep indoors. It raised deaths in Türkiye, where buildings collapsed, but made little difference at Kaikōura, where houses stood.
Why vulnerability varied within the earthquake region
Within the affected region, vulnerability varied sharply between neighbouring places and groups. In the town of Erzin in Hatay province, there were no major collapses, an outcome credited to the mayor’s strict refusal to allow illegal construction; about 20,000 people fled there, increasing its population by about 50%. In Antakya, by contrast, a single luxury development, the Rönesans Rezidans, collapsed and killed at least 269 people; a later investigation pointed to design and safety failures. Building age, developer and inspection mattered more than income alone.
Refugees were among the most vulnerable groups. About 1.75 million Syrians lived in the southern provinces of Türkiye, often renting older, cheaper flats, and at least 6,600 Syrians in Türkiye were killed. People with limited Turkish or uncertain legal status found it harder to obtain shelter and aid, and in Syria people in opposition-held areas waited longest for help.
 YouTube
In New Zealand, the differences were between those who could leave easily and those who could not: tourists without transport and older residents of isolated farms depended on the military until roads reopened, and tourism businesses in Kaikōura lost income while the town was cut off.
What the pair shows
Key concept | How the pair shows it |
|---|---|
Place | Identical magnitudes produced opposite outcomes because the two places differed in buildings, density, wealth and conflict. |
Process | Strike-slip rupture on a transform fault caused the shaking in both cases; in Türkiye the process continued as a cascade of aftershocks and collapses. |
Power | Decisions by governments and builders over amnesties, inspection and aid access decided who lived and who died; the hazard’s physical power was the same in both places. |
Possibility | Erzin shows that enforcement of existing rules can prevent collapse even in a high-hazard region; reconstruction in Türkiye can either repeat or remove past failures. |
How far does the Erzin example support the argument that governance mattered more than the earthquake’s magnitude?
Suggest why the economic loss was much larger in absolute terms in Türkiye, but also much larger relative to GDP in Syria.
To what extent was the time of day a significant factor in either earthquake?
Sources: USGS earthquake event pages us6000jllz, us6000jlqa and us1000778i; AFAD figures as reported in 2024; International Organization for Migration, 2023; International Labour Organization, 2023; UN OCHA, 2023; GeoNet (New Zealand), 2016; New Zealand Transport Agency, 2017; World Bank, World Development Indicators, 2026.
Volcanic hazards: Fuego 2018 and Nyiragongo 2021
The style of an eruption depends on its magma, and the magma depends on the plate setting. Volcán de Fuego in Guatemala lies on a convergent boundary; Nyiragongo in the Democratic Republic of the Congo (DRC) lies on a divergent boundary within a continent.
Volcán de Fuego, Guatemala, 3 June 2018
Fuego is a composite volcano 44 km south-west of Guatemala City, formed where the Cocos plate is subducted beneath the Caribbean plate. Its andesitic magma is viscous and rich in gas, so it erupts explosively. It has erupted more than 60 times since 1524, and about 54,000 people live within 10 km of the summit, many of them farmers on the fertile slopes.
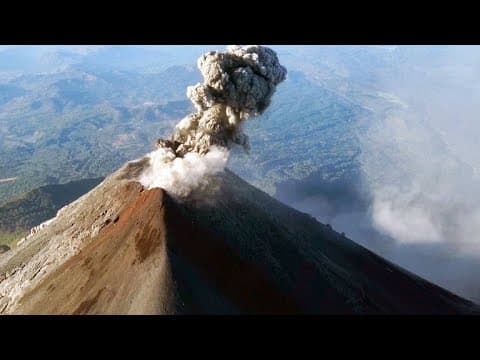
The eruption began at about 06:00 on Sunday 3 June 2018 and reached its climax around midday, with an ash column about 15 km high (VEI 3). Pyroclastic flows travelled down the Las Lajas ravine, overflowed its banks and buried the communities of San Miguel Los Lotes and El Rodeo in Escuintla department. In the following days heavy rain turned the fresh deposits into lahars.
The official count was at least 190 dead and 256 missing, but a local organisation put the possible toll at 2,900. About 3,100 people were evacuated and about 8,500 ha of crops were destroyed. Seismologists had reported rising activity hours before the main phase, but the national disaster agency CONRED called only a voluntary evacuation, and a mandatory order came at 15:00, after flows had reached some communities. In 2012 about 33,000 people had been advised to leave and only about 5,000 did.
Within the area around Fuego, vulnerability depended above all on distance from the ravines. San Miguel Los Lotes lay beside the Las Lajas ravine, so its residents had the least time once flows left the channel. The low uptake of the 2012 evacuation advice, after an eruption that passed without deaths, suggests that experience of earlier eruptions lowered the perceived risk, a pattern of hazard perception that fades between damaging events.
 YouTube
Nyiragongo, Democratic Republic of the Congo, 22 May 2021
Nyiragongo stands on the western branch of the East African Rift, where the African plate is splitting apart. Its very low-silica lava is extremely fluid: in 1977 it flowed at up to 60 km h⁻¹, and the 2002 eruption killed about 250 people. Goma, a city of about 2 million, lies 20 km to the south in a region affected by decades of armed conflict.
At about 18:30 on 22 May 2021 a fissure opened on the volcano’s flank. Lava advanced towards Goma at about 1 km h⁻¹, destroyed hundreds of buildings and cut the N2 road that links Goma with Beni to the north, before stopping in the Buheme district on the city’s northern edge, short of the airport. Earthquakes, including a magnitude 5.3 shock on 25 May, continued for days as magma moved underground.
The death toll was 32: two people burned, nine died in a traffic accident while fleeing, four prisoners were killed escaping and others inhaled gas on cooling lava. About 1,000 homes were destroyed and more than 170 children went missing. The largest impact was displacement: thousands fled into Rwanda and about 25,000 to Sake, and on 27 May about 400,000 people were ordered out of Goma for fear of a further eruption.
Vulnerability was raised by weak monitoring. The Goma Volcano Observatory had barely functioned for a year after the World Bank stopped its funding over corruption allegations; it could not pay for internet access, so staff downloaded data by hand from memory cards.
Within Goma, the northern districts closest to the volcano were the most exposed, and parts of them had been rebuilt on the lava of the 2002 eruption. Children were among the most vulnerable: more than 170 were separated from their families during the night-time flight. Households already displaced by armed conflict in North Kivu had the fewest resources to flee and to find shelter a second time.
Comparing the two volcanic events
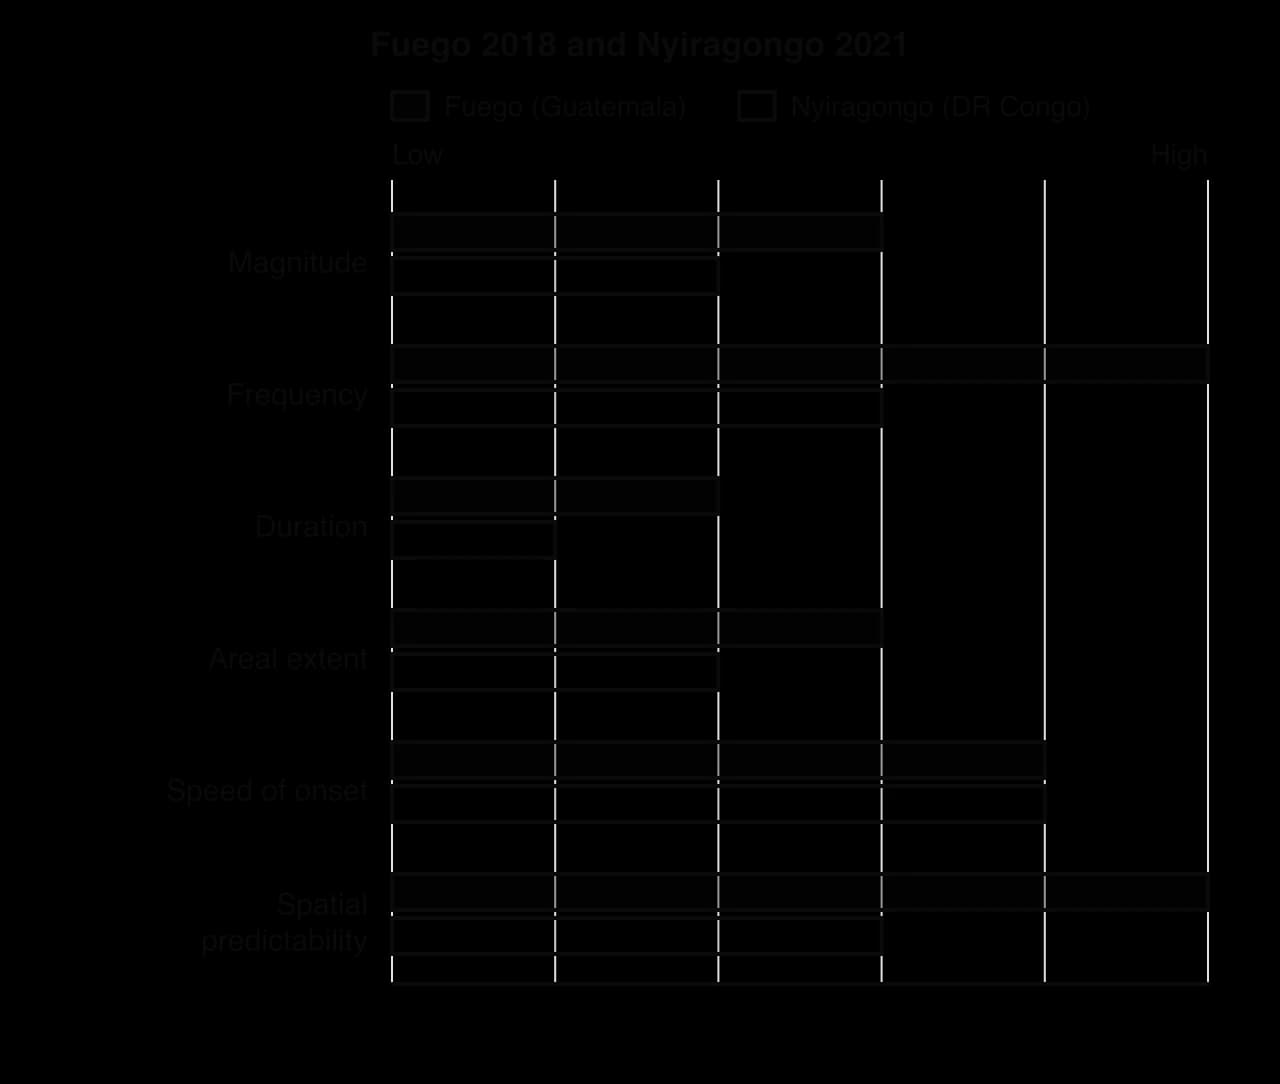
Fuego 2018 | Nyiragongo 2021 | |
|---|---|---|
Plate setting | Convergent: Cocos plate subducted beneath the Caribbean plate | Divergent: continental rift (East African Rift) |
Eruption style and size | Explosive, VEI 3; ash column about 15 km | Effusive flank fissure eruption; lava flows |
Main hazards | Pyroclastic flows, ash fall, lahars | Lava flows, earthquakes, volcanic gases; feared limnic release from Lake Kivu |
Deaths | At least 190, with 256 missing (official); local estimates far higher | 32 |
Displacement | About 3,100 evacuated; more than 1.7 million affected | About 400,000 ordered to leave Goma; about 25,000 fled to Sake |
National income (GNI per capita) | US$4,270 (2018), upper-middle income | US$530 (2021), low income |
Key vulnerability factors | Villages close to ravines; late, voluntary warnings; low uptake of earlier evacuation advice | Unfunded observatory; dense city on the volcano’s path; conflict and poverty |
The physical hazard sets the kind of threat, while human factors decide how many die. Nyiragongo’s lava moved slowly enough for most people to walk away, so deaths were few even with weak monitoring. Fuego’s pyroclastic flows moved far faster than people could run, so a delay of a few hours in ordering evacuation was fatal. Guatemala, the richer of the two countries, therefore had the higher death toll, because its hazard gave less time to respond.
Sources: Global Volcanism Program, Smithsonian Institution; CONRED (Guatemala), 2018; UN OCHA and UNICEF, 2021; World Bank, World Development Indicators, 2026.
Mass movement hazards: Wayanad 2024 and Portuguese Bend 2023–25
Mass movement events range from a debris flow that crosses a valley in minutes to a landslide that moves a few centimetres a week for years. This pair contrasts a fast, wet, loose flow in India with a slow, deep slide of solid rock in California.
Wayanad landslides, Kerala, India, 30 July 2024
Wayanad is a hilly district in the Western Ghats of Kerala, in south-west India, where steep slopes, deeply weathered rock and monsoon rainfall make landslides common. One study found that 62% of the district’s green cover disappeared between 1950 and 2018 as plantations of tea, coffee and cardamom spread.
After 204.5 mm of rain in one 24-hour period and 372.6 mm in the next, a debris slide began at about 1,544 m above sea level near the source of the Punnappuzha river at about 02:17 local time on 30 July 2024. A second failure followed at about 04:10. The slides took up water and loose soil and became a debris flow, which the Geological Survey of India estimated travelled at 57 m s⁻¹, sweeping away the villages of Punjirimattom, Mundakkai and Chooralmala in Meppadi panchayat while most people were asleep.
At least 420 people died, 397 were injured and more than 100 were reported missing. Seventeen whole families died, and most of the victims were tea and cardamom estate workers and their families. More than 1,555 buildings were damaged, the bridge to Mundakkai was destroyed, and more than 10,000 people moved into relief camps.
Vulnerability came from where people lived and from gaps in planning. The villages lay along the river channel that the flow followed, and Chooralmala was not classified as landslide-prone, so many residents stayed at home through the warnings of heavy rain. A 2011 expert report had recommended limits on construction and quarrying in the area, but they were not put into effect. A World Weather Attribution study linked a 10% increase in the intensity of such rainfall to global climate change.
Within the district, vulnerability followed the plantation economy. Estate workers and their families lived close to the river and to the estates where they worked, so the flow destroyed their homes and their livelihoods at the same moment, while households with land or work elsewhere in the district lost far less. Families who lost every working adult faced the longest recovery.
Portuguese Bend landslide, Rancho Palos Verdes, California, 2023–25
Rancho Palos Verdes is a wealthy coastal city in Los Angeles County, on the Palos Verdes Peninsula. Much of the city stands on the ancient Altamira landslide complex, in which blocks of rock slide seaward on a layer of bentonite, a slippery clay formed from weathered volcanic ash. The Portuguese Bend landslide covers about 260 acres (about 1.1 km²), averages about 41 m thick and moves on a slip surface about 30 m below the ground. It is a deep translational slide of mostly solid rock, not a flow.
The slide has a long history. In 1956, during the extension of a road, it reactivated and destroyed or displaced 140 of 170 homes. It moved slowly for decades, but from spring 2023, after very wet winters raised groundwater levels, it accelerated sharply, reaching about 28 cm a week at its peak in July 2024. In 2024 gas was cut off to 135 homes and electricity to 245, California declared a state of emergency, and more than 200 homeowners left.
No one died, because the slow onset gave residents weeks or months to leave. The impacts were economic and social: homes worth millions of dollars lost, utilities cut and property values falling. Standard home insurance in the United States does not cover land movement, so owners bore the losses themselves. Wells pumped out groundwater to lower the pore-water pressure on the slip surface, and by May 2026 the movement had slowed to about 3 cm a week.
Within Rancho Palos Verdes, the losses fell on the owners of homes on the moving ground, while streets a few hundred metres away on stable land were unaffected. Owners whose savings were tied up in a home that could no longer be sold or insured had the least ability to move elsewhere.
Comparing the two mass movements
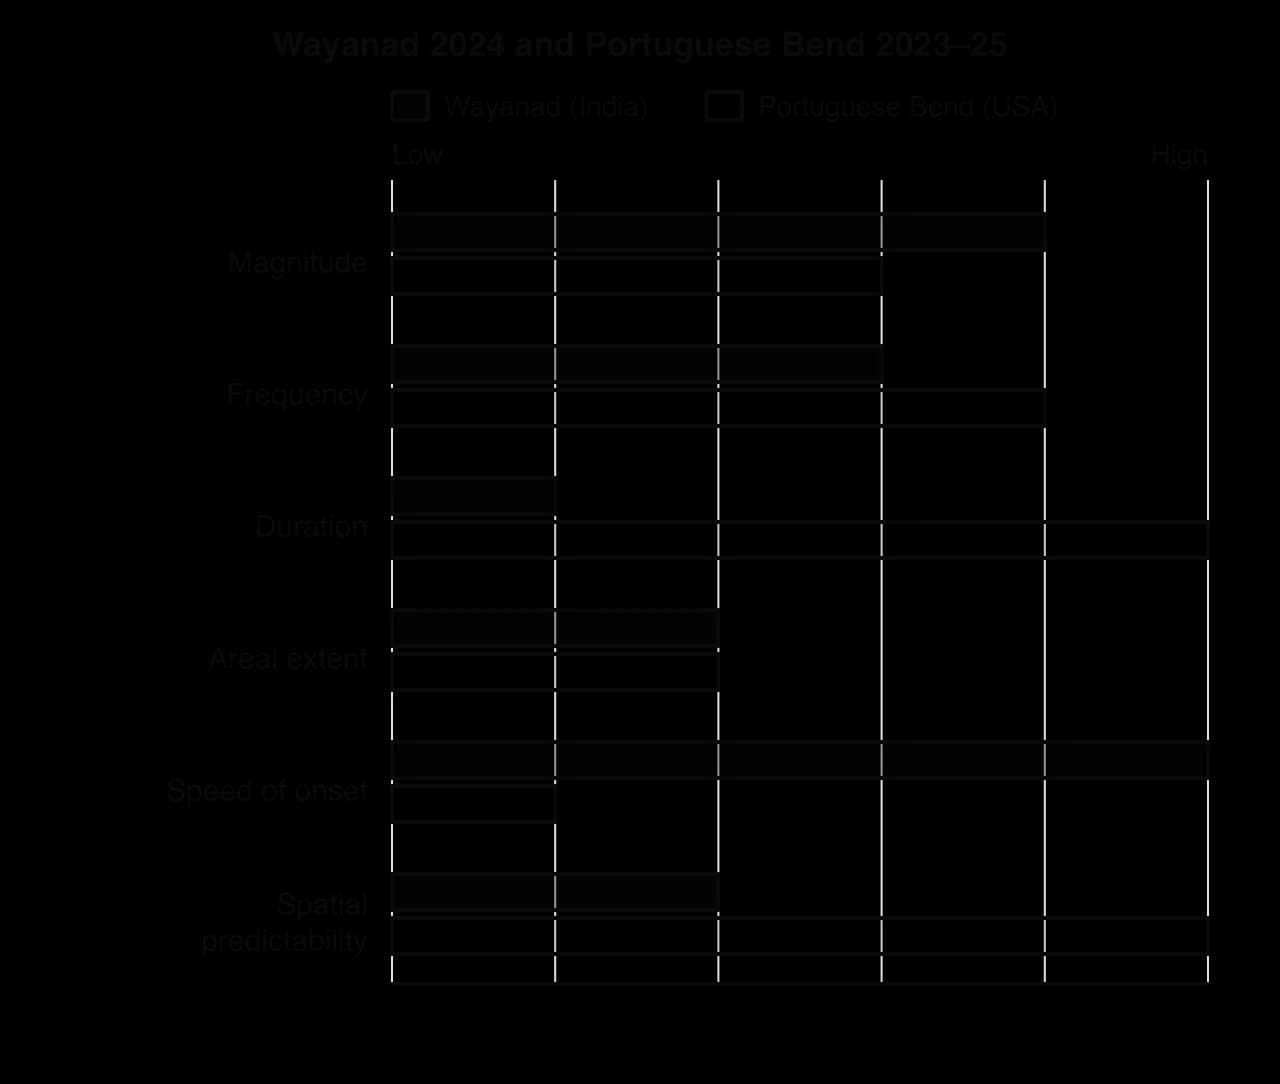
Wayanad 2024 | Portuguese Bend 2023–25 | |
|---|---|---|
Type of movement | Debris slide becoming a debris flow (wet, loose material) | Deep translational slide of rock blocks on a clay layer (solid) |
Speed of onset | Extremely rapid: about 57 m s⁻¹ | Very slow: up to about 28 cm a week |
Duration | Minutes | Years, with acceleration over about 18 months |
Trigger | Extreme monsoon rainfall over 48 hours | Rising groundwater after wet winters, on a slide reactivated by road building in 1956 |
Deaths | 420, with more than 100 reported missing | None |
National income (GNI per capita) | India: US$2,490 (2023), lower-middle income | USA: US$79,950 (2023), high income |
Key vulnerability factors | Workers’ housing in the flow path; unmapped hazard; land-use change; night-time onset | Homes built on a known slide; no insurance cover for land movement |
Here the physical characteristics explain most of the contrast in deaths: a night-time debris flow at 57 m s⁻¹ left no time to escape, whereas a slide moving centimetres a week let everyone leave. The socio-economic setting explains who suffered and how: in Wayanad the poorest workers lost lives, homes and jobs together, while wealthy owners in Rancho Palos Verdes lost valuable property but kept their lives.
Sources: Geological Survey of India, 2024; Government of Kerala, 2024; World Weather Attribution, 2024; City of Rancho Palos Verdes, 2024–2026; World Bank, World Development Indicators, 2026.
Comparing the six events
Taken together, the six events show how the balance between physical and human factors shifts from one hazard type to another. The table summarises which factors best explain the difference in deaths within each pair.
Pair | Deaths | Main physical explanation | Main human explanation |
|---|---|---|---|
Earthquakes | Over 59,000 v 2 | Similar events; larger populated area in Türkiye | Building quality and enforcement, density, conflict in Syria |
Volcanoes | At least 190 (plus missing) v 32 | Fast pyroclastic flows at Fuego; slow lava at Nyiragongo | Late warnings at Fuego; failed monitoring at Nyiragongo (offset by the slow hazard) |
Mass movements | 420 v 0 | Very rapid onset at Wayanad; very slow onset at Portuguese Bend | Unmapped hazard and workers’ housing in Wayanad; monitoring and evacuation in California |
For earthquakes, which give no warning, building quality dominates. For volcanoes and mass movements, the speed of onset largely decides whether people can escape, and monitoring, warnings and planning decide whether that time is used. In every case the poorest groups suffered most, which supports the view that vulnerability, more than the hazard, turns an event into a disaster.
Scale also varies: the earthquakes had national and international impacts, while the volcanic and mass movement events were mainly local, although Nyiragongo displaced people into Rwanda.
Are the six events "natural disasters"?
Many geographers avoid the phrase "natural disaster". The six hazard events were natural, but each became a disaster, or did not, because of human decisions about where and how people built, whether observatories were funded and whether warnings were trusted; calling the outcome "natural" can hide those decisions. Others keep the term to separate these events from technological disasters. Governments and builders may stress the size of the hazard, survivors and critics its human causes.
Exam practice
Structured questions on this content give a table, map or photograph and ask for readings, an outline and two explanations; extended answers ask you to examine or evaluate the factors that explain impacts or vulnerability, using your contrasting case studies.
Comparison questions need a particular structure, because the command terms "compare" and "contrast" ask for points that refer to both events throughout.
Structured question
The table shows data for four geophysical hazard events.
Event | Year | Country (income group) | Hazard | Deaths | Population of country (millions) |
|---|---|---|---|---|---|
Kahramanmaraş | 2023 | Türkiye (upper-middle) | Earthquake, Mw 7.8 | 53,537 | 85.3 |
Kaikōura | 2016 | New Zealand (high) | Earthquake, Mw 7.8 | 2 | 4.7 |
Wayanad | 2024 | India (lower-middle) | Debris flow | 420 | 1,451 |
Nyiragongo | 2021 | DR Congo (low) | Lava flow | 32 | 99.1 |
Sources: AFAD, 2024; GeoNet, 2016; Government of Kerala, 2024; UN OCHA, 2021; World Bank, World Development Indicators, 2026.
Extended response
Summary
A hazard event profile compares magnitude, frequency, duration, areal extent, speed of onset and spatial predictability; it describes the hazard, not its impacts.
Most geophysical events are cascading hazards, and secondary hazards such as aftershocks, lahars and landslide dams often cause much of the harm.
Impacts affect every dimension of human well-being, can be direct or indirect and short- or long-term, and vary from local to global scale.
Absolute measures (total deaths, US$ losses) and relative measures (deaths per 100,000, losses as % of GDP) tell different stories; death tolls are contested and often omit the missing.
Vulnerability varies between communities because of wealth, governance, conflict, density and isolation, and within them because of income, gender, age, disability, legal status and housing.
Hazard perception ranges from fatalism to relocation, varies with experience, distance, education, culture and trust, and fades between events.
Two Mw 7.8 earthquakes killed over 59,000 people in Türkiye and Syria in 2023 and 2 in New Zealand in 2016, mainly because of differences in building quality, enforcement, density and conflict.
Speed of onset largely explains the contrast in deaths between Fuego and Nyiragongo and between Wayanad and Portuguese Bend; human factors decide whether warning time is used.
Self-check
- To do:
I can describe and construct a hazard event profile for an earthquake, an eruption and a mass movement, including their secondary hazards.
- To do:
I can distinguish direct from indirect impacts and absolute from relative measures of impact.
- To do:
I can explain the impacts of geophysical hazards on different aspects of human well-being at several scales.
- To do:
I can determine deaths per 100,000 and economic loss as a percentage of GDP, and explain the limits of the data.
- To do:
I can explain why vulnerability varied between and within communities, with named groups and reasons.
- To do:
I can examine how hazard perception, personal knowledge and preparedness affected the outcome of named events.
- To do:
I can compare and contrast my two earthquakes, two volcanic events and two mass movements in their profiles, impacts and vulnerability.
- To do:
I can evaluate the relative importance of physical and human factors in explaining hazard impacts.
Questions on D.3
96 exam-style questions on this subtopic, written in the style of the IB papers. The first has its markscheme open. Counted on
Question 1 · GEO-0008810 marks
To what extent have improvements in weather forecasting reduced the human impacts of river flooding?
10 marks
Markscheme
Marks should be allocated according to the markbands.
Weather forecasting predicts the amount, intensity, timing and location of precipitation. Improvements include more powerful numerical weather prediction models, ensemble forecasting (many model runs giving probabilities), satellite and radar observation, and links between rainfall forecasts and hydrological models that predict river levels. The human impacts of flooding include deaths and injuries, damage to property and infrastructure, displacement and economic losses. The question asks whether better forecasts have actually reduced these impacts, which also depends on how warnings are communicated and acted on.
Possible applied themes (AO2) demonstrating knowledge and understanding (AO1):
Longer lead times allow evacuation, moving belongings and livestock, closing roads and operating defences (eg Thames Barrier closures planned from forecasts; Bangladesh's flood forecasting and warning system, extended by satellite data and newer AI-based forecasts).
Ensemble forecasts and continental systems (eg the European Flood Awareness System, EFAS) can flag the risk of large river floods several days ahead.
Radar nowcasting helps with short-notice flash floods in small basins.
Deaths from river floods in some countries have fallen as warning systems have improved, although economic losses have generally kept rising because of growing exposure.
Limits: in July 2021 EFAS issued warnings days ahead of the floods in Germany and Belgium, yet more than 180 people died in Germany, many in the Ahr valley, as warnings were not passed on or acted on in time.
Valencia, Spain, October 2024: a red rainfall warning was issued, but the mobile phone alert reached residents after flooding had begun; more than 220 people died.
Forecast accuracy is lowest for intense convective storms in small, steep basins, where lag times are shortest.
Forecasts reduce loss of life more than damage to property, which cannot be moved.
Good answers may be well structured (AO4) and may additionally offer a critical evaluation (AO3) which distinguishes between the quality of the forecast and the effectiveness of the warning chain (communication, trust, preparedness and the ability to respond). Another approach might be to compare places at different levels of development or different scales: high-income countries may have advanced forecasts but suffer large economic losses, while lower-income countries may save many lives with simple community-based warnings. Answers may conclude that forecasting is a necessary but not sufficient condition for reducing impacts.
For 5–6 marks, expect some weakly-evidenced outlining of how forecasting can reduce flood impacts.
For 7–8 marks, expect a structured account which includes:
either well-evidenced explanation of how improved forecasting has (or has not) reduced flood impacts, supported by named examples
or a discursive conclusion (or ongoing evaluation) grounded in geographical concepts and/or perspectives.
For 9–10 marks, expect both of these traits.
Markbands (10 marks, 2 marks per band)
Marks | Level descriptor |
|---|---|
0 | The response does not reach a standard described by the descriptors below. |
1–2 | Too brief, lists unconnected information, not focused on the question and lacks structure. Knowledge is very general, with large gaps or errors; examples or case studies are missing or only listed. No analysis; terminology is missing or used incorrectly. |
3–4 | Too general, lacks detail, not focused on the question and largely unstructured. Outlines examples, statistics and facts, both relevant and irrelevant, with links to the question only listed. Basic terminology is used, with errors or inconsistently. No critical evaluation of evidence; any conclusion is irrelevant. |
5–6 | Partially addresses the question, with a narrow argument, an unsubstantiated conclusion and limited evaluation. Describes relevant supporting evidence (examples, case studies) and outlines links to the question. The argument repeats one point or covers only part of the question. Other perspectives, or strengths and weaknesses of evidence, are listed. |
7–8 | Addresses the whole question; the analysis is evaluated and the conclusion is relevant but lacks balance. Relevant evidence is described correctly and covers all the main points. The argument is clear but one-sided or unbalanced. Complex terminology is used correctly but not consistently. Other perspectives, or strengths and weaknesses of evidence, are described. |
9–10 | In-depth and specific to the question (topic and command term). Correct, relevant examples, statistics and detail are integrated and their link to the question explained. The argument is balanced, explaining complexity, exceptions and comparisons. Evaluation of evidence and perspectives is well developed, and the conclusion is balanced and aligned with the evidence. Logically structured and easy to follow. |
Question 2 · GEO-0015510 marks
Examine the strengths and weaknesses of personal insurance and household flood preparation as ways of reducing flood risk.
10 marks
Answer it, then compare with the markscheme.Check this one with a free account
Question 3 · GEO-0015810 marks
Examine the view that flood mitigation should focus on reducing people's vulnerability rather than on controlling rivers.
10 marks
Answer it, then compare with the markscheme.Check this one with a free account
Carry on with D.3 in Augment
With a free account, Augment remembers where you stopped and what you have practiced.