Explain where geophysical hazards occur, how magnitude and frequency shape risk management, and why economic, social, demographic, political and geographic factors make hazard risk differ between places.
Each is in the Geography glossary, with every other term in the subject.
A set of legal standards that buildings must meet in design and construction, for example to resist earthquake shaking.
The ability of people, organisations and systems to use their resources and skills to manage a hazard event and its effects.
How cut off a place is from transport routes, communications and outside help, which affects how quickly rescue and relief arrive after a hazard event.
A serious disruption of a community caused by a hazard event, involving loss of life, property or livelihoods beyond the community's ability to cope with its own resources.
In the PAR model, the processes such as rapid urbanisation, population growth or a lack of training that turn root causes into unsafe conditions.
A hazard caused by processes in the solid Earth: earthquakes, volcanic activity and mass movements.
The ways in which a society is managed and decisions are made and enforced, by governments and other institutions, including how laws are applied and how accountable those in power are.
The increase in the strength of earthquake shaking where seismic waves pass from hard rock into soft sediments.
Distinguish between a hazard and a disaster, and explain why “natural disaster” is a contested term.
Describe and explain the global distribution of earthquakes, volcanoes and mass movements, using maps.
Explain the magnitude–frequency relationship and the Gutenberg–Richter relationship, and construct and interpret a magnitude–frequency graph.
Examine the relevance of hazard magnitude, frequency, recurrence, seismic gaps and forecasting for risk management.
Explain hazard risk using the risk equation and the Pressure and Release (PAR) model, and evaluate the PAR model.
Examine how economic, social, demographic and political factors make hazard risk differ between places.
Explain how rural or urban location, time of day, degree of isolation and ground conditions affect the impacts of a hazard event.
Analyse real data on deaths, income and shaking intensity, including an isoseismal map and a scatter graph.
Hazard risk is the chance that people will be harmed by a hazard event. Two earthquakes of the same magnitude can kill a handful of people in one country and tens of thousands in another, because risk depends not only on the physical event but on who lives in its path, how they live and who makes decisions about their safety.
The topic links place and power. Place matters because the hazards a location faces come from its position on the Earth, its slopes and its ground, while its wealth, housing and age structure decide how badly an event affects it. Power matters because the people at greatest risk, the poor, the very young and old, and women in many societies, are often those with least influence over where and how they live, and because governments decide whether building codes are written and enforced.
85 exam-style questions on this subtopic, written in the style of the IB papers. The first has its markscheme open. Counted on
Examine the relationship between plate boundary processes and the global distribution of earthquake and volcanic hazards.
10 marks
Marks should be allocated according to the markbands.
The question asks how processes at constructive (divergent), destructive (convergent) and conservative (transform) plate boundaries explain where earthquakes and volcanoes occur. Distribution may be described at the global scale (belts, clusters and gaps) and explained through the processes operating at each boundary type. Hotspots (intraplate volcanism) and intraplate earthquakes should be credited as exceptions to the relationship. The focus is on the hazards, so answers should link the distribution of the physical events to where they pose a risk.
Possible applied themes (AO2) demonstrating knowledge and understanding (AO1):
The Pacific Ring of Fire contains roughly three-quarters of the world’s active volcanoes and is the setting for about 90% of earthquakes; this reflects subduction of oceanic plates around the Pacific (eg the Pacific Plate beneath Japan, the Nazca Plate beneath South America).
Subduction zones generate the largest (megathrust) earthquakes, eg Chile 1960 (M9.5), Indian Ocean 2004 (M9.1), Tōhoku 2011 (M9.0), and explosive andesitic or rhyolitic volcanoes because melting of the subducted slab produces viscous, gas-rich magma (eg Pinatubo 1991, Merapi).
Continental collision zones (Alpine–Himalayan belt) produce frequent shallow and intermediate earthquakes over wide areas but little volcanism, as no oceanic crust is subducted (eg Nepal 2015, Kashmir 2005, Türkiye 2023 lies at the junction of collision and transform movement).
Conservative boundaries produce shallow earthquakes but no volcanoes (eg the San Andreas Fault, California; the North Anatolian Fault, Türkiye; the Enriquillo–Plantain Garden fault zone, Haiti 2010).
Constructive boundaries produce frequent, low-magnitude, shallow earthquakes and effusive basaltic eruptions; most lie under the ocean, so the hazard to people is limited except where ridges rise above sea level (eg Iceland: Eyjafjallajökull 2010, the Reykjanes peninsula eruptions near Grindavík from 2023) or at continental rifts (eg East African Rift: Nyiragongo, Goma).
With a free account, Augment remembers where you stopped and what you have practiced.
The rule that, in a region, the number of earthquakes falls by about ten times for each one-unit rise in magnitude.
A potential threat to people, property or the environment from a natural or human process.
Estimating the probability of a hazard event of a given size occurring in an area over a period of time.
How often a hazard event of a given magnitude occurs in a place, often expressed as a recurrence interval or an annual probability.
The size or energy of a hazard event, measured on a scale such as moment magnitude, the VEI or the volume of a landslide.
Stating precisely when and where a hazard event will occur and how large it will be.
The probability of harm or loss from a hazard event, which depends on the hazard, the exposure and vulnerability of people and assets, and their capacity to cope.
An earthquake that occurs within a tectonic plate, far from a plate boundary, on an older zone of weakness.
A map showing lines that join places that experienced the same intensity of earthquake shaking.
The inverse relationship between the size of hazard events and how often they occur: small events are frequent and large events are rare.
A hazard caused by a natural process in the Earth's surface, atmosphere or interior, such as an earthquake, eruption, landslide or tropical cyclone.
The belt of subduction zones, volcanoes and earthquakes that surrounds the Pacific Ocean, where about two-thirds of the world's volcanoes and most large earthquakes occur.
A model of disaster risk in which root causes, dynamic pressures and unsafe conditions build vulnerability, and a disaster happens when this vulnerability meets a hazard.
A map showing the level of a hazard, such as ground shaking, that has a stated chance of being exceeded in a given period, used for building codes and insurance.
In the PAR model, the deep economic, demographic and political processes, such as poverty and limited access to power, that make people vulnerable.
A section of an active fault that has not ruptured in a large earthquake for a long time, where stress is building and a future earthquake is likely.
In the PAR model, the specific forms of vulnerability in a place and time, such as weak buildings on unstable slopes or a lack of warnings.
A hazard is a potential threat: something that could cause harm. A natural hazard arises from a natural process; a geophysical hazard is the type of natural hazard caused by processes in the solid Earth (earthquakes, volcanic eruptions and mass movements), as distinct from atmospheric or hydrological hazards such as tropical cyclones and floods.
Geophysical hazards are grouped with hydrological and atmospheric hazards as natural hazards. Earthquakes and volcanic eruptions are driven by processes deep inside the Earth, so they cannot be prevented, only prepared for. Mass movements are partly different, because slopes can be drained, stabilised or left unbuilt, which reduces how often they fail.
A disaster is what happens when a hazard event actually strikes vulnerable people and seriously disrupts a community, causing losses that are beyond its ability to cope with its own resources. An earthquake in an uninhabited desert is a hazard event but not a disaster; the same earthquake beneath a city of poorly built homes can be a catastrophe.
Hazards can also be human-made, such as industrial accidents, and many hazards are partly both: an earthquake triggered by wastewater injection, or a landslide on a slope cut for a road.
Geophysical hazards are not spread evenly. Earthquakes and volcanoes are concentrated in narrow belts that follow plate boundaries; mass movements are concentrated where steep slopes, heavy rain, earthquakes and rapid unplanned building coincide. Mapping these patterns is the first step in identifying which places face which hazards.
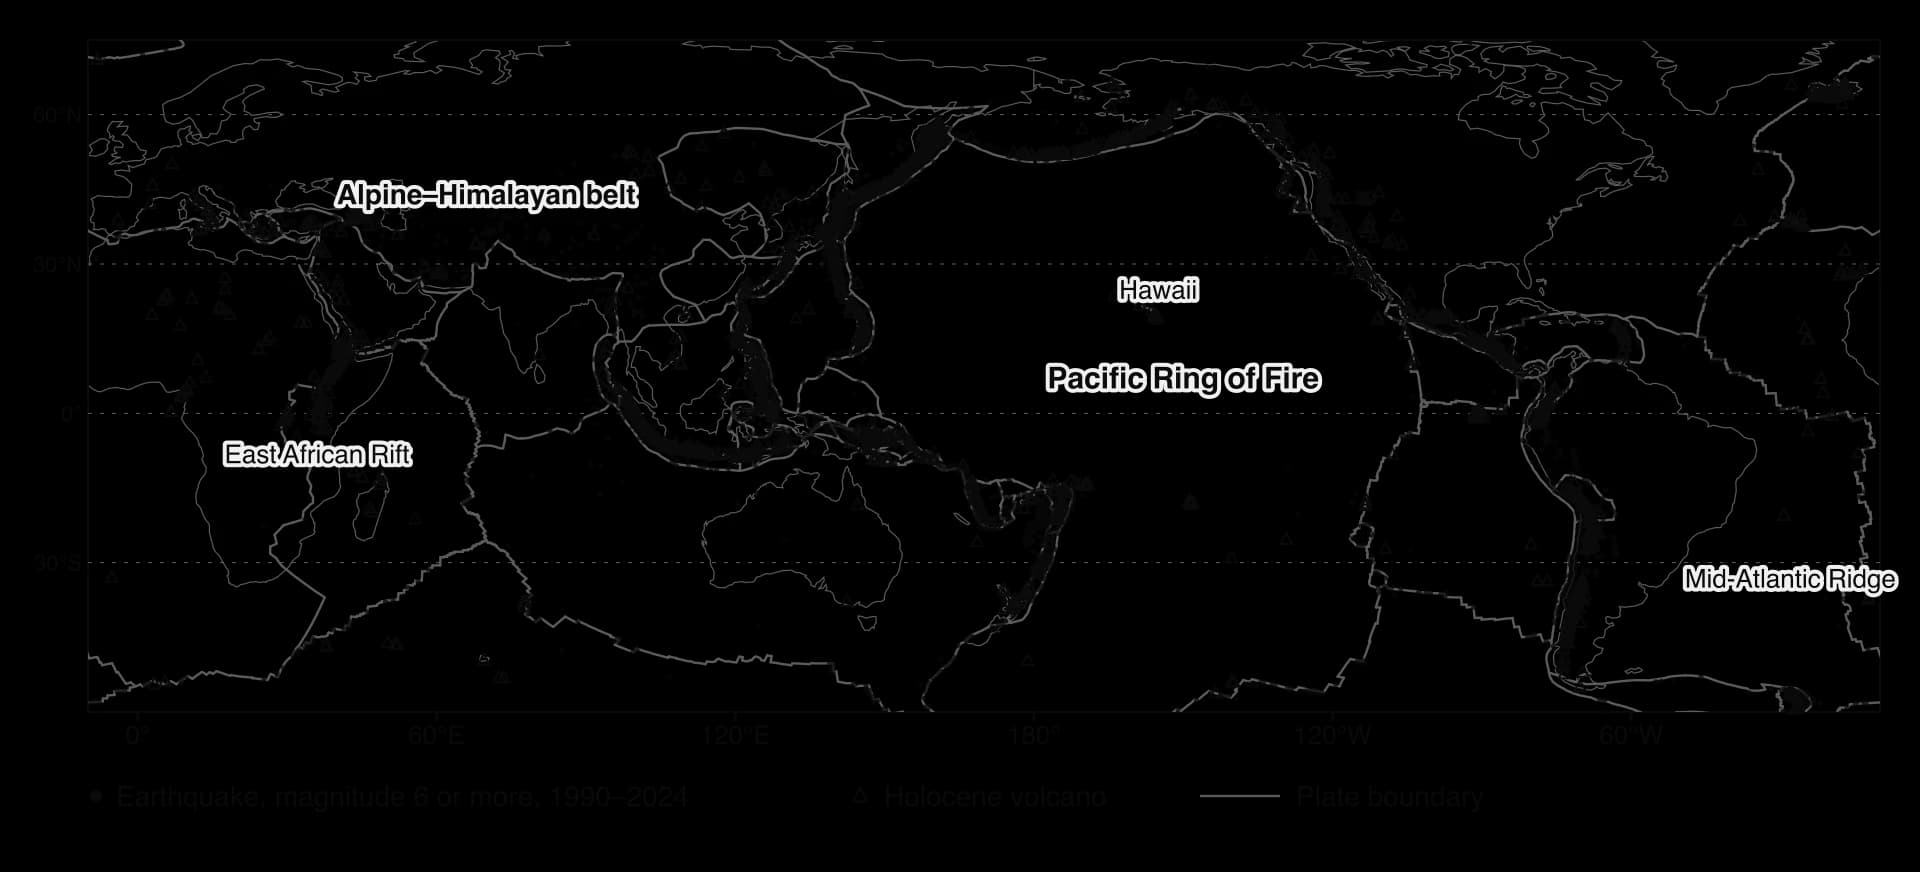
Most large earthquakes occur in narrow belts along plate boundaries. The Pacific Ring of Fire, the chain of subduction zones and transform faults around the Pacific Ocean, has about 90% of the world’s earthquakes and most of the largest, from Chile and Alaska to Japan, Indonesia and New Zealand. The second great belt is the Alpine–Himalayan belt, which runs from the Mediterranean through Türkiye, Iran and the Himalayas to Myanmar, where Africa, Arabia and India push into Eurasia.
The pattern is not a set of thin lines everywhere. Mid-ocean ridges and transform faults produce narrow lines of mostly small earthquakes. Collision zones produce broad zones of earthquakes hundreds of kilometres wide, because the continental crust deforms over a large area: in Iran and western China, damaging earthquakes occur far from any single boundary line. A few intraplate earthquakes occur within plates, such as the series of earthquakes of magnitude 7 or more at New Madrid, Missouri, in 1811–1812, which occurred more than 1,000 km from the nearest plate boundary.
About 1,600 volcanoes are known to have erupted in the last 10,000 years. Their distribution follows the three settings that produce magma. Most lie along subduction zones: the Ring of Fire contains between 750 and 915 active or dormant volcanoes, about two-thirds of the world total, including most of the explosive composite volcanoes. Many others lie along divergent boundaries, mostly hidden under the sea along mid-ocean ridges but exposed in Iceland and the East African Rift. A small number lie above hotspots, such as Hawaii, the Galápagos, Réunion and Yellowstone.
Large numbers of people live close to volcanoes, because volcanic soils are fertile, volcanic landscapes attract tourists and geothermal energy is valuable. About 800 million people live within 100 km of a volcano that could erupt, in 86 countries, with Indonesia among the most exposed.
Mass movements occur on slopes everywhere, but deadly ones cluster where several conditions overlap: steep, young mountains with weak or fractured rock (the Himalaya, the Andes, Central America, Papua New Guinea), heavy seasonal rain from monsoons and tropical cyclones (South Asia, the Philippines, southern China), frequent earthquakes, deforestation, and rapid unplanned building on slopes, as in Freetown (Sierra Leone), the favelas of Rio de Janeiro and La Paz (Bolivia).
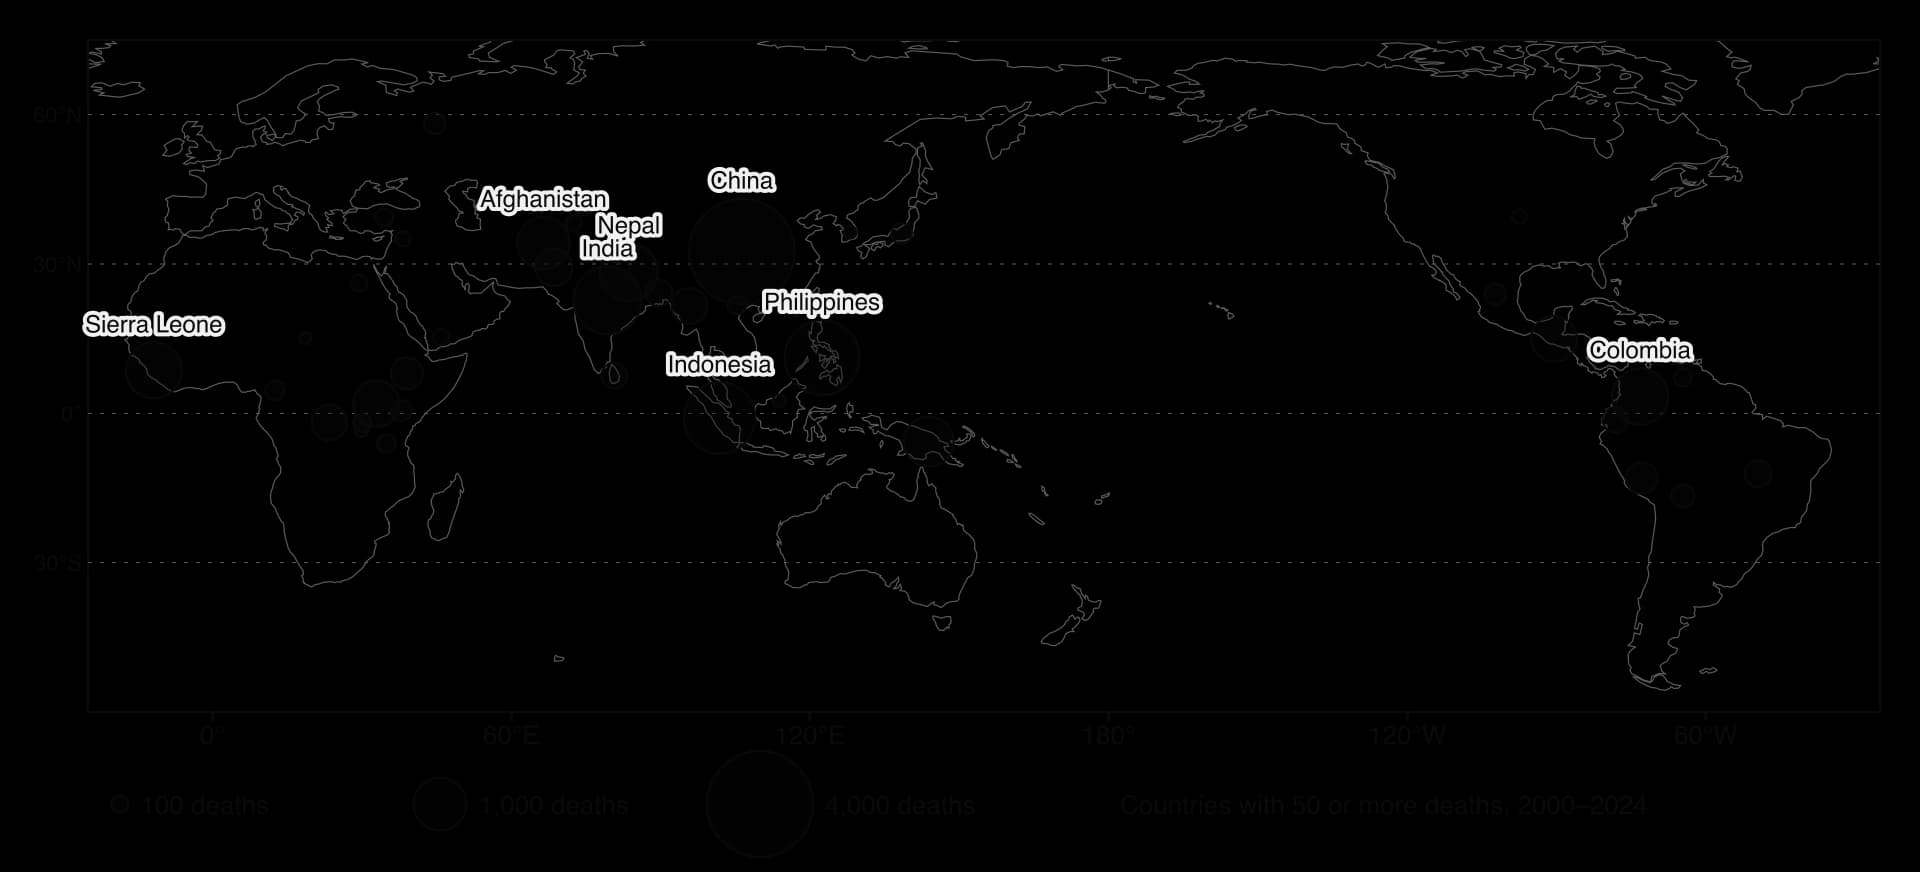
EM-DAT, the international disaster database, recorded about 22,000 deaths in landslide disasters between 2000 and 2024, about 64% of them in Asia; China, the Philippines, Indonesia, India and Nepal had the most. A separate global database of fatal landslides compiled by Froude and Petley (2018) found 55,997 deaths in 4,862 landslides between 2004 and 2016 alone, about 75% of them in Asia, and showed that landslides triggered by construction, illegal mining and hill cutting were increasing.
Sources: Froude, M. J. and Petley, D. N. (2018), Global fatal landslide occurrence from 2004 to 2016, Natural Hazards and Earth System Sciences; Loughlin, S. C. et al. (eds) (2015), Global Volcanic Hazards and Risk, Cambridge University Press; Our World in Data (EM-DAT), 2025.
Hazard magnitude is the size of an event: its energy, the volume of material involved or the area affected. Hazard frequency is how often events of a given size occur in a place. For every geophysical hazard, the two are inversely related.
Magnitude can be measured in different ways for each hazard: energy for earthquakes, ejected volume for eruptions, and volume or area for mass movements.
The magnitude–frequency relationship describes a simple pattern: small events are frequent and large events are rare. For earthquakes it takes a precise form, the Gutenberg–Richter relationship: in a region, the number of earthquakes falls by about ten times for each rise of one unit in magnitude. The same pattern holds for eruptions by VEI and for landslides by volume.
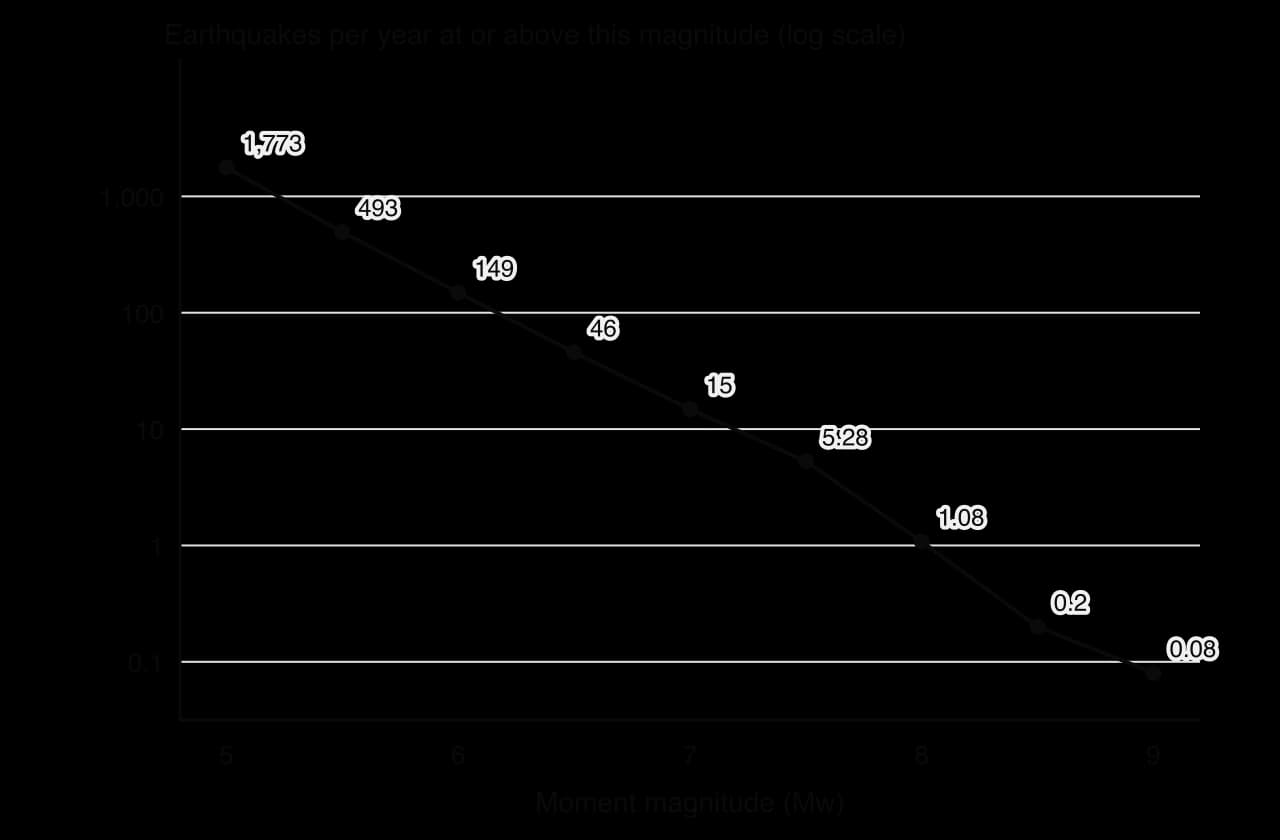
Frequency is often expressed as a recurrence interval (or return period): the average time between events of a given size. A “1-in-500-year” earthquake has a 0.2% chance of occurring in any one year, not a promise that it will happen only once in five centuries. Recurrence intervals are estimated from instrumental records (about 120 years long), historical documents and geological evidence such as offset sediments and buried soils.
A seismic gap is a segment of a fault that has not slipped while segments on either side have. The North Anatolian Fault in Türkiye shows the idea clearly. Since the magnitude 7.8 Erzincan earthquake of 1939, which killed more than 32,000 people, a sequence of large earthquakes has broken the fault progressively westward: 1942, 1943, 1944, 1951, 1957 and 1967, then the magnitude 7.6 İzmit earthquake and the Düzce earthquake in 1999.
The İzmit earthquake killed about 17,000–18,000 people. The next segment west lies beneath the Sea of Marmara, about 20 km south of Istanbul.
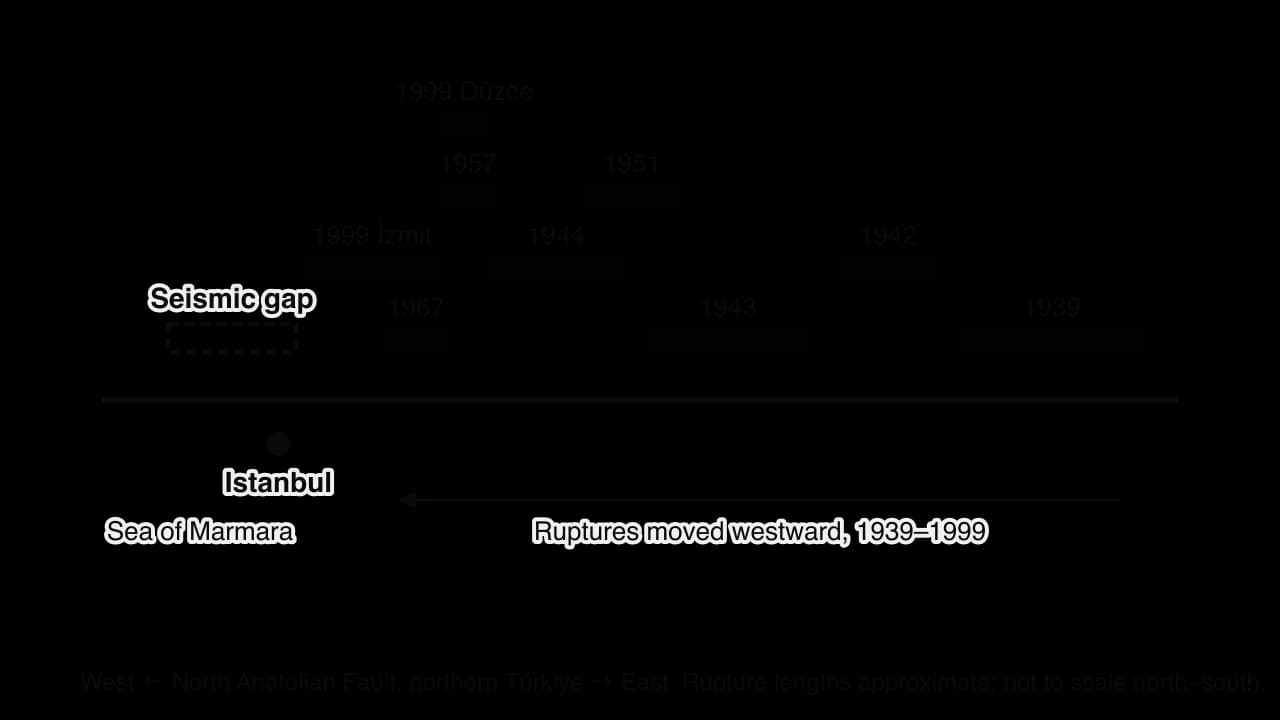
A magnitude 6.2 earthquake under the Sea of Marmara on 23 April 2025 injured 359 people but did not release the stored strain. One widely cited estimate gives a 64% chance of an earthquake of Mw 7.0 or more near Istanbul before 2030; other studies give different figures, because each depends on assumptions about how much strain the fault has stored. The Cascadia subduction zone off the north-west coast of the USA and Canada is another gap: its last great earthquake, of about magnitude 9, struck on the evening of 26 January 1700, dated from drowned “ghost forests” and records of a tsunami in Japan.
Seismologists combine the location of faults, their slip rates and their magnitude–frequency patterns into a probabilistic hazard map. A common standard shows the shaking that has a 10% chance of being exceeded in 50 years. Engineers then design buildings to resist that level of shaking.
Hazard prediction means stating exactly when, where and how large an event will be. Hazard forecasting means estimating the probability of an event of a given size in an area over a period. The three geophysical hazards differ greatly in how far they can be forecast.
No method can yet predict an earthquake, but forecasts of all three hazards are improving.
Hazard | Can it be predicted? | Basis of forecasts | Example |
|---|---|---|---|
Earthquakes | No: the time of rupture cannot be predicted | Long-term probabilities from fault slip rates, seismic gaps and past events | Istanbul and Cascadia probabilities; no warning before Gorkha 2015 |
Volcanic eruptions | Often forecast days to weeks ahead | Earthquakes, ground swelling and gas emissions as magma rises | Pinatubo, 1991: about 60,000 people evacuated before the eruption, saving thousands of lives |
Mass movements | Partly: large slow slides can be monitored; rapid ones are hard to time | Rainfall thresholds, slope monitoring, mapping of unstable slopes | Landslide warnings issued when rainfall passes set amounts |
Magnitude and frequency together shape how societies prepare. Where moderate events are frequent, people, governments and builders learn from repeated experience. Japan has many damaging earthquakes each decade; earthquake drills, strict building codes and public awareness are part of everyday life. Where large events are rare, memory fades and preparation lapses. In Nepal, the previous great earthquake, in 1934, was beyond the memory of most people in 2015, and much of the housing built in the intervening decades had never been tested by strong shaking.
The rarest, largest events can exceed what even well-prepared societies plan for. Along the Tōhoku coast in 2011, many sea walls had been built for tsunamis much lower than the one that arrived, and the waves overtopped them; the town of Fudai was spared by its 15.5 m floodgate.
Designing for very rare events is expensive, so every society decides how much protection is worth paying for. Ordinary buildings are commonly designed for the shaking with a 10% chance of being exceeded in 50 years (about 1 in 475 years), critical buildings such as hospitals for rarer shaking (a 2% chance in 50 years, about 1 in 2,500 years), and nuclear power plants for rarer events still.
Event type | Typical frequency | What it means for risk management |
|---|---|---|
Low magnitude, high frequency | Months to years | People learn and adapt; costs of repeated small losses add up; preparedness is easier to sustain |
Moderate magnitude | Decades | Building codes and land-use plans are designed around these events |
High magnitude, low frequency | Centuries or more | Exceeds design limits; memory fades; protection is costly; planning relies on probability and evacuation |
Hazard risk is the probability of harm or loss from a hazard. It depends on three things: the hazard itself (its magnitude and frequency), the vulnerability of people and property, including their exposure (being in the hazard’s path), and their capacity to cope.
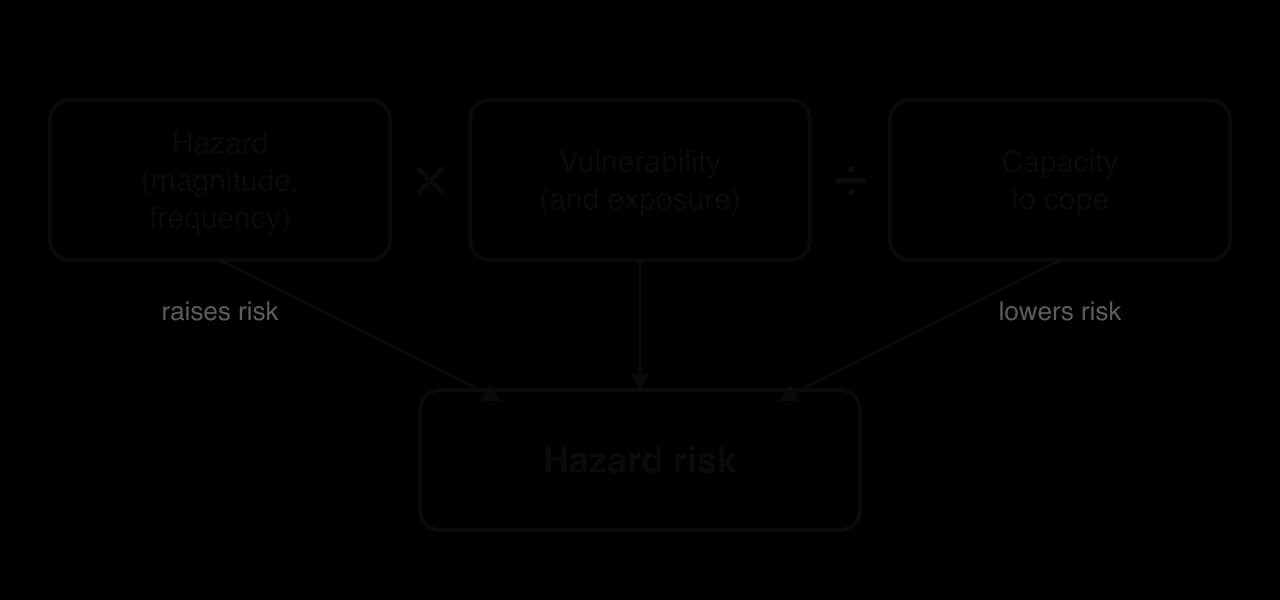
The equation is not a calculation with real numbers but a way of thinking about risk. It shows that risk is zero if nobody is exposed, that the same hazard produces very different risks in different places, and that risk can be reduced without changing the hazard at all, by reducing vulnerability or raising capacity. Capacity includes money, skills, warning systems, emergency services, insurance and social networks; resilience, the ability to absorb, recover from and adapt to an event, is its long-term result.
The Pressure and Release model, developed by Blaikie, Cannon, Davis and Wisner (first published in 1994), explains where vulnerability comes from. It pictures a disaster as the point where two sets of pressure meet: the hazard on one side, and on the other a “progression of vulnerability” that builds up through three stages.
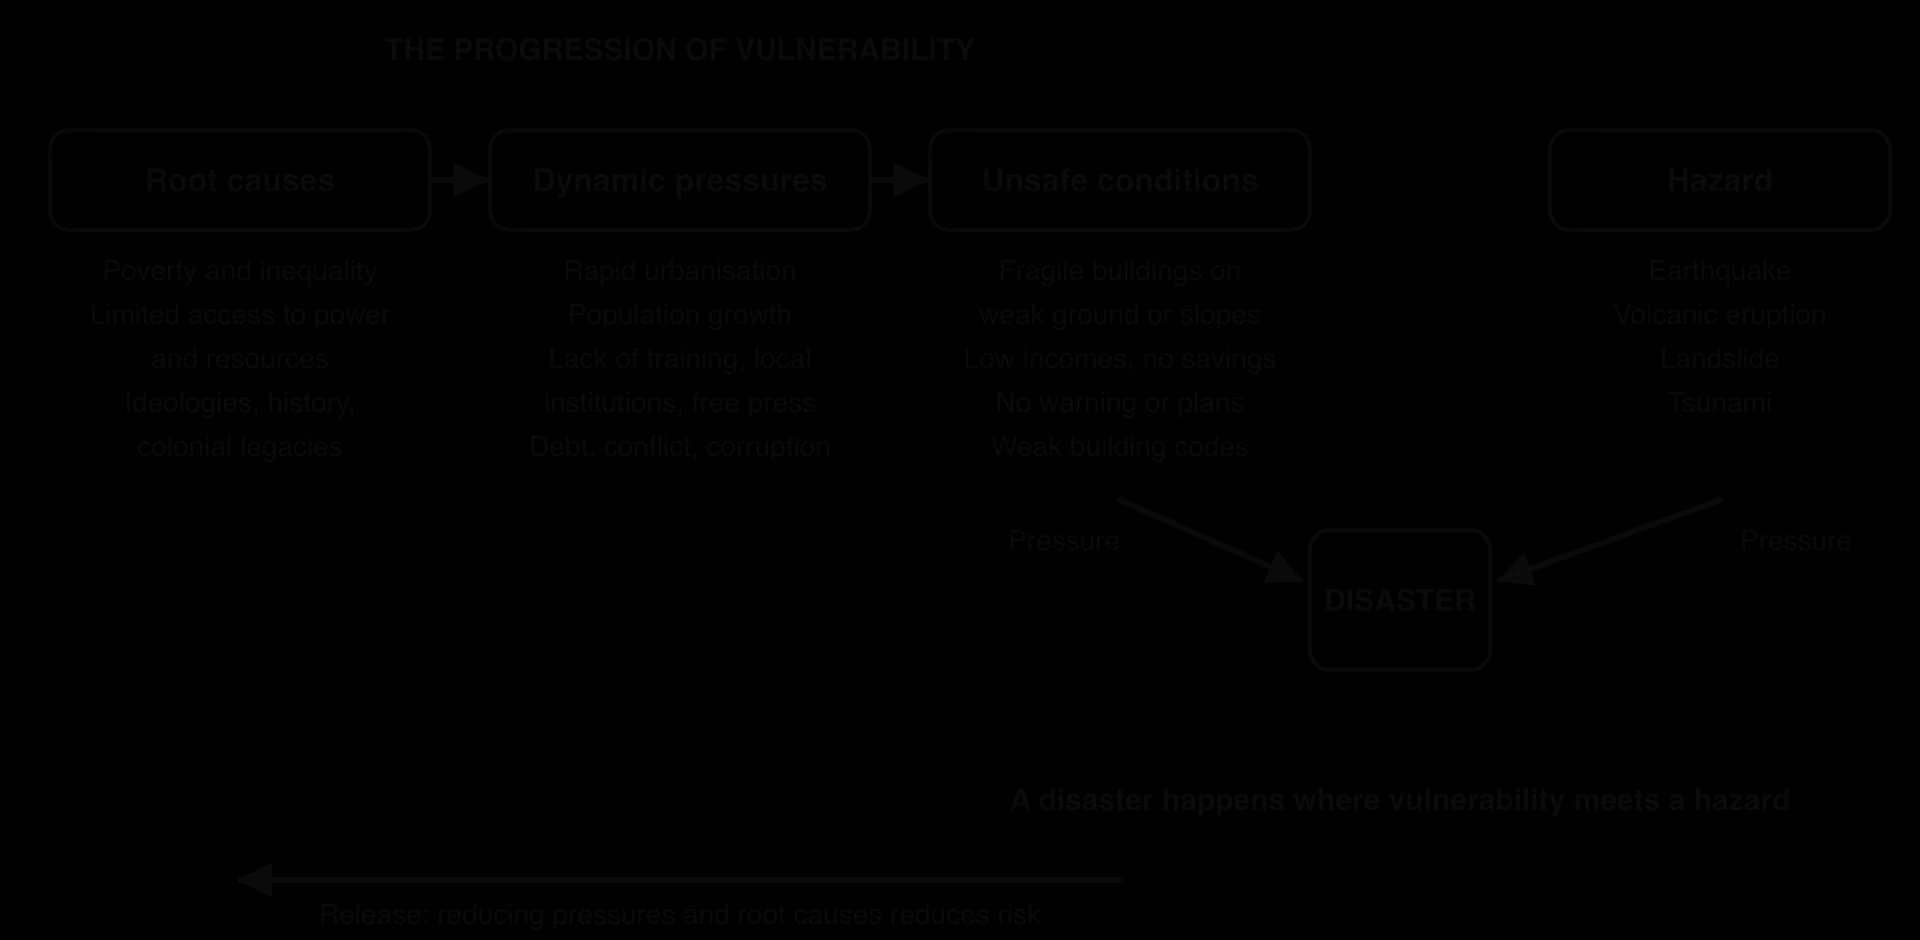
Root causes: deep, often distant economic, demographic and political processes, such as poverty, inequality, limited access to power and resources, and the legacies of history.
Dynamic pressures: processes that turn root causes into unsafe conditions, such as rapid urbanisation, population growth, a lack of local institutions, training or a free press, debt, conflict and corruption.
Unsafe conditions: the specific forms of vulnerability in a place and time, such as fragile buildings on unstable ground, low incomes with no savings, no warning system and unenforced building codes.
Dynamic pressures are the stage at which change happens fastest, so they are often where policy can act most directly: a city can enforce its building code or plan housing for migrants long before it can end poverty.
Strengths | Limitations |
|---|---|
Shows that disasters are produced by human decisions as well as by natural events | Treats the hazard as a fixed input, although human activity can change hazards (induced earthquakes, slope cutting) |
Links local conditions to national and global processes such as debt, conflict and inequality | Root causes are hard to measure and to link to a single disaster; the chain can be vague |
Points to long-term solutions (reducing poverty, improving governance), not only engineering | Says little about capacity, recovery and resilience, which later models added |
Applies to every hazard and setting | Can make people appear passive victims, ignoring local knowledge and coping strategies |
The PAR model is most useful for explaining why the poorest people in the poorest places suffer most, and for showing that risk reduction must deal with causes as well as symptoms. Its weakness is that it explains vulnerability better than it measures it, and it gives little guidance on what to do first, so it works best alongside the risk equation and data on the factors that follow.
Vulnerability and capacity are shaped by four groups of factors: economic, social, demographic and political. They rarely act alone, and each can raise or lower risk.
Richer countries and households can afford engineered buildings, monitoring networks, warning systems, emergency services and insurance. The contrast between two earthquakes in 2010 is often used to show this. On 12 January a magnitude 7.0 earthquake struck 25 km from Port-au-Prince in Haiti, then a low-income country; estimates of the dead range from about 100,000 to more than 300,000, and about 250,000 homes collapsed or were badly damaged. On 27 February a magnitude 8.8 earthquake, releasing hundreds of times more energy, struck central Chile, a much richer country with a long tradition of earthquake engineering; 525 people died.
The relationship is not simple, however. The scatter graph plots the deaths in 77 earthquakes of magnitude 6.5–7.9 between 2000 and 2024 against the GDP per capita of the country hit.
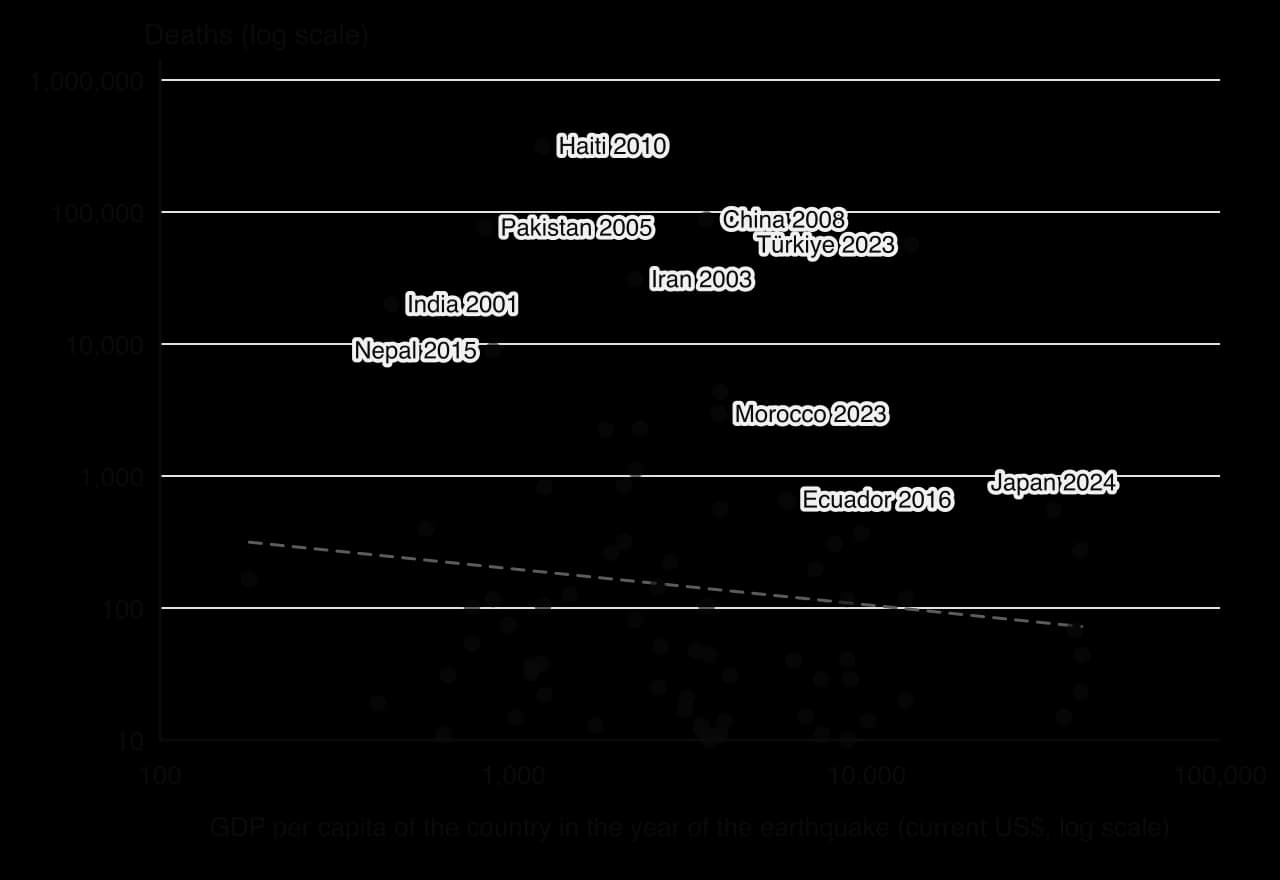
Wealth also changes the type of loss. High-income countries suffer the largest economic losses because they have more valuable buildings and infrastructure in harm’s way, while low-income countries suffer most deaths. The Gorkha earthquake caused damage of about US$10 billion, half of Nepal’s GDP, a far larger share of the economy than the losses of many costlier earthquakes in rich countries. Technology is the means through which wealth reduces risk: seismic engineering, earthquake early warning, volcano monitoring and satellite mapping all depend on investment, trained people and maintenance.
Education reduces vulnerability because people who know how to respond act faster. Children taught to “drop, cover and hold on”, people who know that a retreating sea means a tsunami, and families with an evacuation plan are all less vulnerable. Education also brings jobs, income and access to information, so it raises capacity in many ways.
Gender shapes vulnerability mainly through social roles. In the 2004 Indian Ocean tsunami, Oxfam reported that in some areas up to four times as many women as men died, because women were waiting on the beach for the fishermen to return or looking after children in their houses, and fewer women had been taught to swim or climb trees. In the 2015 Gorkha earthquake, 55% of the deaths recorded in Nepal by district were women, and single women had very little access to relief. Disability adds further vulnerability when warnings are only given by sound or evacuation routes need stairs.
More people in the hazard zone means more exposure. Very high densities in cities and in informal settlements mean that one collapse can kill many people, and narrow lanes slow rescue. Population structure matters too: the very young and the very old are least able to escape and most at risk from injury, cold and disrupted health care. On the Noto Peninsula in Japan, where much of the population is elderly, 504 of the 732 deaths from the earthquake of 1 January 2024 were disaster-related deaths in the weeks after the shaking, aggravated by power and water cuts and life in evacuation shelters.
Governance, the way decisions are made, laws enforced and resources allocated, may be the most important factor of all, because it decides whether wealth and knowledge are turned into safety. A building code only protects people if it is enforced.
In Türkiye, a strict modern earthquake code existed, but successive “zoning amnesties”, the most recent in 2018, allowed buildings that broke the rules to be legalised for a fee; estimates put the number of buildings in the area hit by the February 2023 earthquakes that had received such amnesties at up to 75,000. Across the border in Syria, more than a decade of civil war had damaged hospitals and infrastructure, and for days after the earthquake UN aid could enter the opposition-held north-west through only one crossing, Bab al-Hawa. In Myanmar, the civil war hampered relief after the magnitude 7.7 earthquake near Mandalay on 28 March 2025.
Governance also includes land-use planning, the honesty of construction inspection, the funding of emergency services and the trust that people place in warnings. Where corruption lets builders cut costs, or where authorities are distrusted, even well-designed systems fail.
Factor | How it raises vulnerability | How it can lower it | Example |
|---|---|---|---|
Economic (development) | Cheap, unreinforced buildings; no savings or insurance | Engineered buildings, insurance, emergency services | Haiti 2010 against Chile 2010 |
Technology | No monitoring or warnings | Early warning, monitoring, seismic engineering | Pinatubo 1991 forecast and evacuation |
Social (education, gender) | Lack of knowledge; caring roles; unequal access to warnings and relief | Hazard education, drills, inclusive warnings | Indian Ocean tsunami 2004; Nepal 2015 |
Demographic (density, age) | Crowding; many very young or old people | Planning, care for vulnerable groups | Noto, Japan, 2024 |
Political (governance) | Unenforced codes, corruption, conflict | Enforcement, accountability, planning | Türkiye and Syria, 2023 |
Sources: BBC News, February 2023 (zoning amnesties); Oxfam, 2005 (Indian Ocean tsunami); Wikipedia articles on the 2010 Haiti, 2010 Chile, 2021 Haiti, 2005 Kashmir, 2023 Al Haouz, 2024 Noto, 2025 Myanmar, 1985 Mexico City and 2017 Puebla earthquakes (accessed 2026), citing national agencies.
Even within one country, the impacts of an event depend on where and when it strikes: whether the area is urban or rural, the time of day, how isolated it is, how far it is from the epicentre and what the ground is made of.
Cities concentrate people, buildings and infrastructure, so an earthquake beneath a city causes more collapses, fires and failures of water, power and transport. But cities also have hospitals, rescue teams and better communications. Rural areas often have weaker buildings, such as adobe (mud brick) and unreinforced stone, and help takes longer to arrive. Haiti shows the contrast: the 2010 earthquake near the capital killed at least 100,000 people, while the larger magnitude 7.2 earthquake of 14 August 2021 in the rural Tiburon Peninsula killed 2,248, although it damaged or destroyed about 137,500 buildings.
The timing of an event decides where people are. A night-time earthquake catches people asleep inside heavy houses; a daytime one may catch children in school or workers in offices and factories.
Night: the Al Haouz earthquake in Morocco struck at 23:11 on 8 September 2023, when people in remote Atlas villages were asleep in mud-brick and stone houses; 2,960 died. The Türkiye–Syria earthquake struck at 04:17 local time in winter, trapping families indoors and exposing survivors to freezing temperatures.
School hours: the Kashmir earthquake in Pakistan struck at 08:50 on 8 October 2005, a school day; of more than 87,000 deaths, about 19,000 were children, many of them killed when school buildings collapsed.
Weekends and worship: the Gorkha earthquake struck at 11:56 on a Saturday, when schools were closed but many people were outdoors; about 500 people were reported to have died in collapsing churches during Saturday worship. The 2025 Myanmar earthquake struck during Friday prayers, and hundreds died in collapsing mosques.
Season: monsoon rain after an earthquake triggers further landslides on slopes already loosened by shaking, as in Nepal in 2015.
The degree of isolation of a place decides how fast help arrives. Remote mountain villages can be cut off by landslides that block the only road; islands depend on ports and airports that may be damaged; and loss of power and phone networks stops people from calling for help. After the 2024 Noto earthquake in Japan, landslides and damaged roads on the mountainous peninsula left at least 780 people in remote villages cut off, reachable only by helicopter, and the bridge to Noto Island was closed. In Nepal in 2015, impassable roads and a shortage of helicopters delayed help to villages for days.
Shaking generally weakens with distance from the epicentre, which is shown on an isoseismal map. These maps join places with the same intensity of shaking. The USGS ShakeMap system now produces them within minutes of a large earthquake, combining instrument readings, reports from the public and models of ground conditions.
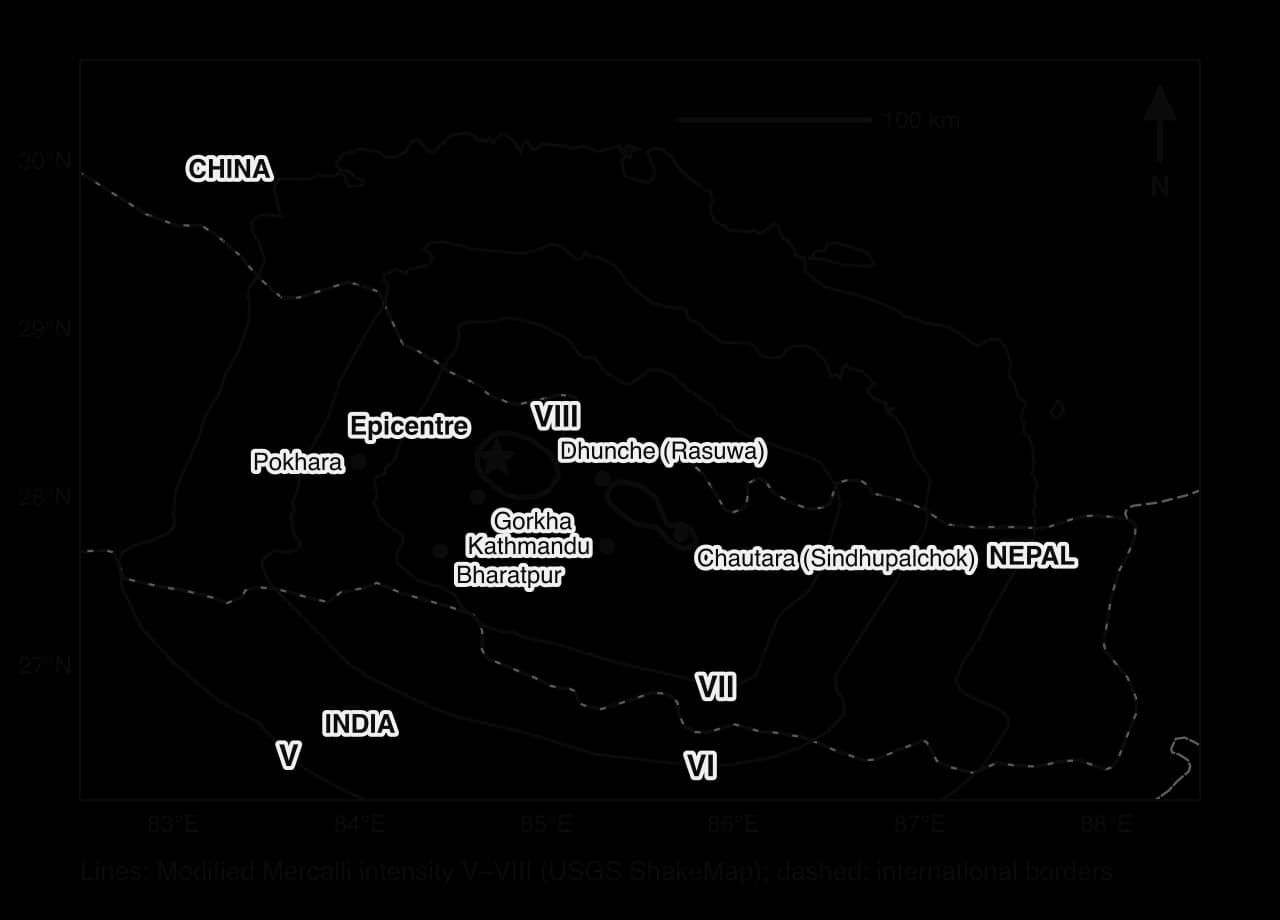
The Gorkha map shows that intensity does not simply fall in circles around the epicentre. In the USGS rupture model, the fault slipped over a zone about 170 km long, mostly east of the epicentre, so the strongest shaking stretched towards Kathmandu and Sindhupalchok, and local ground conditions bent the contours.
Soft ground can reverse the effect of distance. Ground amplification occurs when seismic waves pass from hard rock into soft, water-rich sediments, which shake more strongly and for longer. Mexico City is built on the clay and silt of the drained Lake Texcoco. In 1985 an earthquake on the subduction zone more than 350 km away killed at least 5,000 people (some estimates say about 10,000) in the city, and on 19 September 2017, the anniversary of that earthquake, the magnitude 7.1 Puebla earthquake killed 370 people, 228 of them in Mexico City.
Secondary hazards add further variation: tsunamis threaten low coasts, landslides threaten steep valleys, and liquefaction threatens reclaimed land and river deposits. Preparedness, the knowledge, plans and supplies people already have, then decides how well they respond.
On Saturday 25 April 2015 at 11:56 local time, a magnitude 7.8 earthquake struck central Nepal. Its epicentre was near Barpak in Gorkha District, about 80 km north-west of Kathmandu, and its focus only about 8 km deep. Nearly 9,000 people died in Nepal and neighbouring India, China and Bangladesh. The earthquake shows how each of the risk factors combined in one place, and why risk was very different in different parts of the same country.
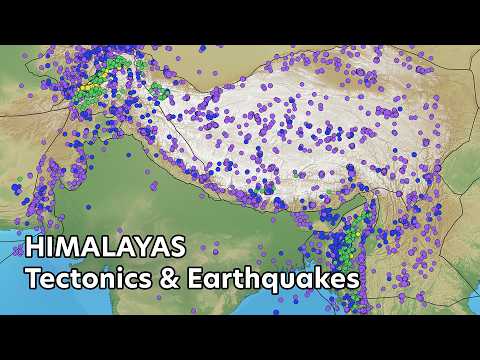
Nepal lies on the collision boundary where the Indian Plate pushes beneath the Eurasian Plate at about 4.5 cm a year. The strain is released on the Main Himalayan Thrust, which slipped in 2015 and moved the block of crust under Kathmandu about 3 m south in 30 seconds. The danger was well known: a 600 km section of the central Himalaya had not ruptured in a great earthquake since 1505, and the 1934 Nepal–India earthquake had already shown what the region could suffer. The hazard was forecast, but its timing could not be predicted.
 YouTube
Measure | Value |
|---|---|
Magnitude and depth | Mw 7.8; focus about 8.2 km deep (USGS) |
Time | 11:56 local time, Saturday 25 April 2015 |
Deaths | 8,857 in Nepal (about 8,964 in all four countries) |
Injured | About 22,300 in Nepal |
Homeless | Nearly 3.5 million people |
Major aftershock | Mw 7.3 on 12 May 2015, killing more than 200 people |
Economic damage | About US$10 billion, roughly 50% of Nepal’s GDP |
GDP per capita | About US$880 in 2015 (low-income country) |
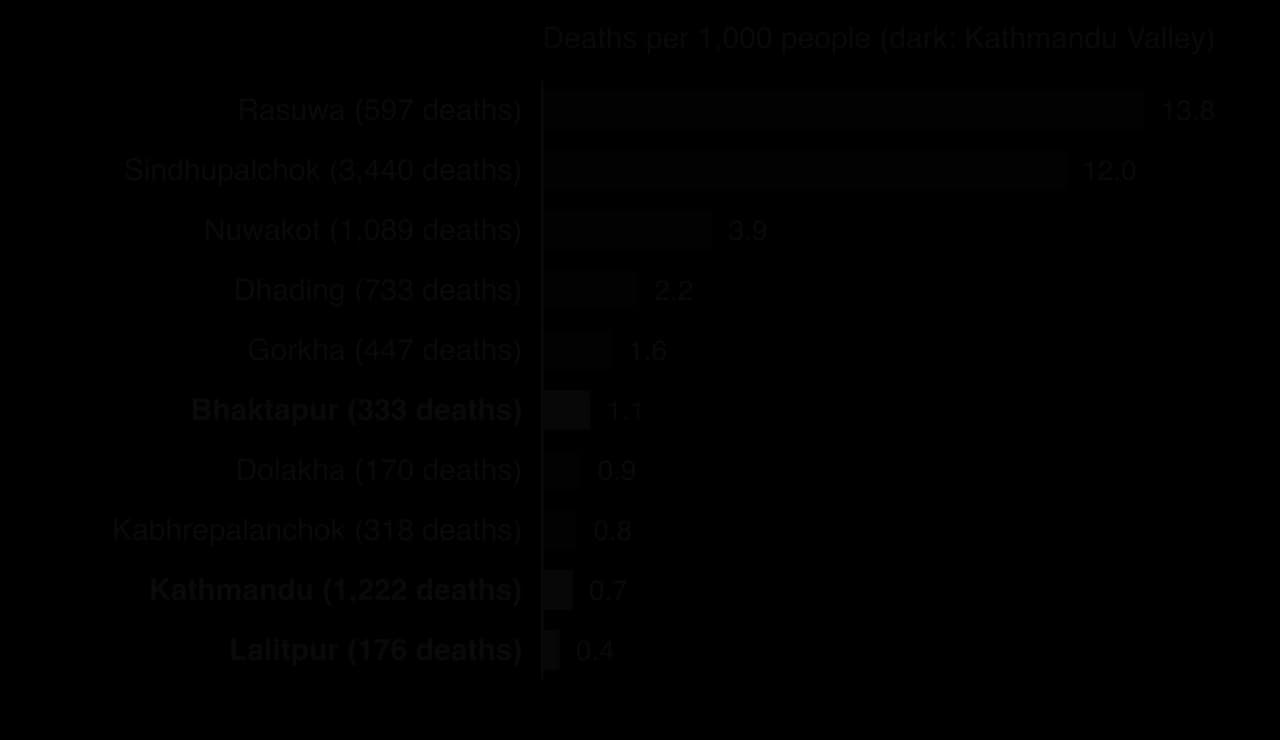
Deaths were extremely uneven. Kathmandu District recorded 1,222 deaths, but in a population of 1.7 million that is less than one death per 1,000 people. In the rural mountain districts of Rasuwa and Sindhupalchok, the rate was 12–14 per 1,000, about 17–20 times higher.
Economic: Nepal was one of the poorest countries in Asia, with GDP per capita of about US$880. Many rural homes were self-built of unreinforced stone or brick. The losses equalled about half of the national economy.
Social and gender: of the deaths recorded by district, 55% were women and girls. Single women had very little access to relief, and traffickers targeted women and girls who had lost their homes.
Demographic: the Kathmandu Valley was one of the fastest-growing urban areas in South Asia, with about 2.5 million people by 2010 and growth of about 4% a year, so new buildings went up quickly; in the mountains, scattered villages on steep slopes were exposed to landslides.
Political: Nepal’s politics were unstable and reconstruction was slow, and the 81 years since the 1934 earthquake had encouraged complacency among officials.
Time of day: the Saturday timing meant that schools were closed, which probably saved many children, and many people were outdoors at midday, but about 500 people were reported to have died in churches during Saturday worship.
Isolation and terrain: landslides blocked mountain roads, communications failed and Nepal had few helicopters, so injured people in outlying areas waited days for help. In Rasuwa, an avalanche and landslides triggered by the earthquake buried Langtang village, leaving 329 people missing, which helps explain that district’s very high death rate. An avalanche on Mount Everest killed 22 people.
Distance and the rupture: the rupture spread east from the epicentre, so Sindhupalchok, near its eastern end, received intensity VIII shaking; Kathmandu, on old lake sediments, was shaken at about intensity VII–VIII, and many modern engineered buildings survived while older brick and timber buildings collapsed.
In Kathmandu, the impact on culture was severe: temples in Kathmandu Durbar Square, a UNESCO World Heritage Site, collapsed, and the collapse of the 19th-century Dharahara tower killed at least 180 people. Monsoon landslides in the following months, on slopes loosened by the shaking, added further deaths.
Sources: USGS event page us20002926; Nepal Ministry of Home Affairs district figures via OCHA/HDX (2015); World Bank, WDI (2025); Wikipedia, “April 2015 Nepal earthquake” (accessed 2026), citing Nepal Disaster Risk Reduction Portal, IPWA and Bloomberg.
Concept | How the Gorkha earthquake shows it |
|---|---|
Place | Rural mountain districts near the rupture had death rates 17–20 times those of Kathmandu: the same event, very different places. |
Power | Women, the rural poor and remote communities had least influence over building quality, warnings and relief; national politics slowed recovery. |
Scale | Local landslides and avalanches, a national loss of half of GDP, and international aid and rescue teams from dozens of countries. |
Analysis questions
Using the district chart, describe the pattern of deaths per 1,000 people and suggest two reasons for it.
Suggest why women made up more than half of the deaths in Nepal.
To what extent was the Gorkha earthquake’s death toll a product of Nepal’s level of development rather than of its geography?
Hazard risk is tested in Paper 1 through structured questions on maps, graphs and tables (distribution maps, magnitude–frequency graphs, data on deaths and losses) and through 10-mark extended responses that ask you to examine or evaluate the factors behind risk.
District | Type | Population (2011) | Deaths | Deaths per 1,000 |
|---|---|---|---|---|
Rasuwa | Rural, mountain | 43,300 | 597 | 13.8 |
Sindhupalchok | Rural, mountain | 287,798 | 3,440 | 12.0 |
Nuwakot | Rural, hill | 277,471 | 1,089 | 3.9 |
Gorkha (epicentre) | Rural, mountain | 271,061 | 447 | 1.6 |
Kathmandu | Urban | 1,744,240 | 1,222 | 0.7 |
Lalitpur | Urban | 468,132 | 176 | 0.4 |
Sources: Nepal Ministry of Home Affairs official figures, via OCHA/HDX, 2015; population from the 2011 census.
A hazard is a potential threat; a disaster happens when a hazard event seriously disrupts a community beyond its capacity to cope. Many geographers see disasters as socially produced.
Earthquakes and volcanoes lie in belts along plate boundaries, above all the Pacific Ring of Fire and the Alpine–Himalayan belt; mass movements cluster in steep, wet, tectonically active and rapidly urbanising areas, especially in Asia.
Small events are frequent and large ones rare; for earthquakes, the number falls about tenfold for each unit of magnitude (Gutenberg–Richter).
Recurrence intervals, seismic gaps and probabilistic hazard maps guide building codes and planning; earthquakes cannot be predicted, eruptions can often be forecast, and rare large events exceed design limits.
Risk = (hazard × vulnerability) ÷ capacity; the PAR model traces vulnerability from root causes through dynamic pressures to unsafe conditions.
Economic, social, demographic and political factors make risk differ between places; governance decides whether wealth and knowledge become safety.
Rural or urban location, time of day, isolation, distance and ground amplification make impacts differ within a country, as Nepal in 2015 shows.
I can distinguish a hazard from a disaster and explain why “natural disaster” is contested.
I can describe and explain the distribution of earthquakes, volcanoes and mass movements from maps.
I can construct and interpret a magnitude–frequency graph and explain the Gutenberg–Richter relationship.
I can explain how magnitude, frequency, seismic gaps and forecasting affect risk management.
I can explain hazard risk with the risk equation and the PAR model, and evaluate the PAR model.
I can examine how economic, social, demographic and political factors affect hazard risk, with examples.
I can explain how location, time of day, isolation and ground conditions affect the impacts of an event.
I can interpret an isoseismal map and a scatter graph of deaths against income.
Hotspots produce volcanoes away from plate boundaries (eg Hawaiʻi, Kīlauea 2018); intraplate earthquakes can occur on old faults (eg New Madrid, USA, 1811–1812).
Depth and type of movement influence how hazardous the events are, eg shallow-focus earthquakes cause stronger ground shaking at the surface.
Good answers may be well structured (AO4) and may additionally offer a critical evaluation (AO3) which examines the strength of the relationship, for example noting that plate boundary type explains the location of almost all earthquakes and volcanoes, but that hotspots and intraplate events show it is not complete. Another approach might be to distinguish between the distribution of hazard events and the distribution of hazard risk: many boundary zones are sparsely populated (mid-ocean ridges), while others are densely populated (Java, Japan, the Andes), so the physical relationship does not on its own explain where the hazard is greatest for people (places, processes).
For 5–6 marks, expect some weakly-evidenced outlining of the distribution of earthquakes and/or volcanoes in relation to plate boundaries.
For 7–8 marks, expect a structured account which includes:
either well-evidenced explanation of the processes at two or more types of plate boundary and the hazards they generate
or a discursive conclusion (or ongoing evaluation) grounded in geographical concepts and/or perspectives, eg on exceptions to the relationship.
For 9–10 marks, expect both of these traits.
NB. Maximum [6] if only earthquakes or only volcanoes are addressed. Well-drawn annotated diagrams of plate boundaries should be credited.
Marks | Level descriptor |
|---|---|
0 | The response does not reach a standard described by the descriptors below. |
1–2 | Too brief, lists unconnected information, not focused on the question and lacks structure. Knowledge is very general, with large gaps or errors; examples or case studies are missing or only listed. No analysis; terminology is missing or used incorrectly. |
3–4 | Too general, lacks detail, not focused on the question and largely unstructured. Outlines examples, statistics and facts, both relevant and irrelevant, with links to the question only listed. Basic terminology is used, with errors or inconsistently. No critical evaluation of evidence; any conclusion is irrelevant. |
5–6 | Partially addresses the question, with a narrow argument, an unsubstantiated conclusion and limited evaluation. Describes relevant supporting evidence (examples, case studies) and outlines links to the question. The argument repeats one point or covers only part of the question. Other perspectives, or strengths and weaknesses of evidence, are listed. |
7–8 | Addresses the whole question; the analysis is evaluated and the conclusion is relevant but lacks balance. Relevant evidence is described correctly and covers all the main points. The argument is clear but one-sided or unbalanced. Complex terminology is used correctly but not consistently. Other perspectives, or strengths and weaknesses of evidence, are described. |
9–10 | In-depth and specific to the question (topic and command term). Correct, relevant examples, statistics and detail are integrated and their link to the question explained. The argument is balanced, explaining complexity, exceptions and comparisons. Evaluation of evidence and perspectives is well developed, and the conclusion is balanced and aligned with the evidence. Logically structured and easy to follow. |
Examine why the global distribution of mass movement hazards differs from that of earthquake and volcanic hazards.
10 marks
Examine the relevance of hazard magnitude and frequency for the management of geophysical hazard risk in one or more named places.
10 marks