Identify the sources of water pollution, measure water quality and BOD, explain eutrophication and its feedback, and evaluate management at three levels, with HL sewage treatment, indices, HABs and dead zones.
Each is in the ESS glossary, with every other term in the subject.
Water flowing over or through farmland into streams and lakes, carrying fertiliser nutrients, manure, pesticides and soil particles with it.
A rapid increase in the population of phytoplankton, such as algae or cyanobacteria, in a water body, usually after an increase in a limiting nutrient, that discolours the water.
The complete absence of dissolved oxygen in water or sediment, in which only anaerobic microorganisms can survive.
The amount of dissolved oxygen consumed by microorganisms as they decompose the organic matter in a water sample, usually measured in mg per litre over five days at 20 °C.
A scale that indirectly measures the quality of an environment, such as a river, from the pollution tolerance, diversity and relative abundance of the organisms living there.
Photosynthetic bacteria, often called blue-green algae, that can form dense blooms in nutrient-rich water; some species produce toxins.
A toxin produced by cyanobacteria, such as microcystin, which damages the liver, that can poison people and animals that drink or swim in affected water.
Outline the main sources of water pollution and distinguish point sources from non-point sources.
Describe a specific example of water pollution in detail: its location, sources, environmental impacts and management.
Explain how plastic debris accumulates in oceanic gyres and how microplastics carry toxins into food chains.
Describe how the chemical, physical and biological quality of water is measured and why monitoring matters for management.
Explain what biochemical oxygen demand (BOD) measures and calculate it from dissolved oxygen readings.
Explain the causes of eutrophication and its sequence of impacts, and construct a systems model of it that includes positive feedback.
Discuss how eutrophication affects ecosystem services.
Evaluate pollution management strategies using the three-level pollution management model.
Outline the effects of a wide range of water pollutants and of toxic algal blooms, and explain why dead zones are spreading (HL).
Outline the three stages of sewage treatment and the difficulty of providing treatment fairly (HL).
Calculate and interpret a biotic index and a water quality index, and explain the role of indicator species (HL).
Evaluate the roles of drinking-water standards and of citizen action in reducing water pollution (HL).
Water pollution is the addition of substances or energy to rivers, lakes, groundwater or the sea at a rate faster than the water can disperse, break down, recycle or store them harmlessly. Almost half of the world’s household wastewater is still released without safe treatment, and nutrients washed off farmland have created low-oxygen zones in coastal seas from the Gulf of Mexico to the Baltic. Polluted water harms aquatic life and also the people who drink it, fish in it, farm with it or depend on it for their livelihoods.
The official deck for this part of the syllabus.
What is pollution?
What is a pollutant?
With a free account, Augment remembers where you stopped and what you have practiced.
An area of a sea or lake where the water, usually near the bottom, is hypoxic or anoxic, so that it cannot support most aquatic animal life.
A single-celled protist with two flagella, common in marine plankton; some species form red tides and produce neurotoxins that accumulate in shellfish.
Liquid waste discharged into the environment from a pipe or outfall, such as treated or untreated sewage or industrial wastewater.
A chemical that interferes with the production or action of hormones in an organism, disrupting growth, development or reproduction, often at very low concentrations.
The enrichment of lakes, estuaries and coastal waters with mineral nutrients, especially nitrates and phosphates, often causing excessive phytoplankton growth and oxygen depletion.
An area at the centre of an oceanic gyre where floating debris, mostly plastic fragments and lost fishing gear, accumulates at unusually high concentrations.
A bloom of algae, cyanobacteria or other phytoplankton that harms people, animals or ecosystems, especially by producing toxins or by clogging the gills of fish.
A condition in which dissolved oxygen in water is too low to support most animal life, commonly defined as 2 mg per litre or less.
The development of male sex organs in female marine snails, such as dog whelks, caused by exposure to endocrine disruptors such as tributyltin.
A species whose presence, absence or abundance shows a particular environmental condition, such as a level of pollution, because it is sensitive to or tolerant of that condition.
A negatively charged ion of nitrogen and oxygen (NO₃⁻); a highly soluble plant nutrient that is easily washed from soil into water and contributes to eutrophication.
Pollution that enters the environment from many dispersed sources over a wide area, such as run-off from farmland or roads, so that no single source can easily be identified.
A large, roughly circular system of ocean surface currents driven by prevailing winds and the Earth’s rotation, which can concentrate floating debris at its centre.
The release of crude oil or refined fuel into the environment, especially the sea, from tankers, offshore rigs, pipelines or storage facilities.
A graph of dissolved oxygen against distance downstream of an input of organic pollution, showing a fall to a minimum and a gradual recovery as the organic matter is decomposed.
A negatively charged ion of phosphorus and oxygen (PO₄³⁻); a plant nutrient, often limiting in fresh water, that enters water in sewage, detergents, manure and eroded soil.
The accumulation of plastic objects and particles in the environment in amounts that harm wildlife, habitats or people.
Pollution released into the environment from a single, clearly identifiable location, such as a discharge pipe, sewage outfall or chimney, which makes it easier to monitor and regulate.
A substance or form of energy, such as heat, that harms living things or the environment when it is added faster than it can be dispersed, broken down or stored.
The addition of a substance or form of energy to the environment at a rate faster than it can be made harmless by dispersal, breakdown, recycling or storage, causing harm to living things.
A model matching management strategies to three stages of pollution: changing the human activity that produces a pollutant, controlling its release, and cleaning up and restoring ecosystems.
The first, physical stage of sewage treatment, in which screens and settling tanks remove large objects, grit and settleable solids.
A coastal bloom of phytoplankton, usually dinoflagellates, dense enough to discolour the water red or brown; many red tides produce toxins harmful to marine life and people.
A flat disc with black and white quarters lowered into water on a marked line; the depth at which it disappears from view measures water clarity.
The biological stage of sewage treatment, in which aerobic microorganisms break down dissolved and suspended organic matter, greatly reducing biochemical oxygen demand.
Wastewater from homes and other buildings, containing human waste, food residues, detergents and other dissolved and suspended material, carried away by drains and sewers.
The process of removing solids, organic matter, nutrients and pathogens from wastewater in primary, secondary and tertiary stages so that the effluent can be released or reused safely.
The advanced stage of sewage treatment, using chemical and biological processes to remove nutrients such as nitrate and phosphate and to disinfect the effluent.
A change in the temperature of a water body, usually an increase caused by the discharge of cooling water, that lowers dissolved oxygen and harms aquatic organisms.
The dry mass of particles in a known volume of water that can be trapped by a filter, usually given in milligrams per litre.
A biotic index for rivers, published in 1964, that scores water quality from 10 (clean) to 0 (grossly polluted) using the most sensitive invertebrate group present and the number of groups.
A toxic tin compound formerly used in anti-fouling ship paints; an endocrine disruptor that causes imposex in marine snails, banned on ships worldwide from 2008.
The cloudiness of water caused by suspended particles such as clay, silt, organic matter and plankton, which reduces the depth to which light penetrates.
The chemical, physical and biological characteristics of water, measured against the standards needed for a particular use or for a healthy aquatic ecosystem.
A single number, usually on a scale of 0 to 100, calculated as a weighted average of the quality values of several water tests, summarising the overall degree of contamination.
A lake, a river or a coastal sea can be treated as an open system: it has inputs of water, nutrients and organic matter, storages in the water, the living things and the sediment, and outputs to the sea, the atmosphere and the sediment. Pollution changes the size of these inputs, and the way a society responds depends on the perspective of the people involved and on who pays the cost. Water pollution is therefore a question of sustainability as well as of chemistry and ecology.
Every water body receives some dead leaves, animal waste and dissolved minerals from its surroundings. Rivers and lakes can absorb these natural inputs because bacteria break down the organic matter, plants take up the nutrients and currents dilute and carry away the rest. Pollution happens when an input arrives faster than these processes can deal with it, so that it builds up and harms living things.
The substance or energy that does the harm is the pollutant. Pollutants may be natural materials in the wrong amount (sewage, nitrate, sediment), synthetic chemicals that natural processes cannot easily break down (pesticides, plastics), or energy such as heat. The same pollutant can be harmless in a large, fast-flowing river and damaging in a small, still pond, because the rate of input matters as much as the type of substance.
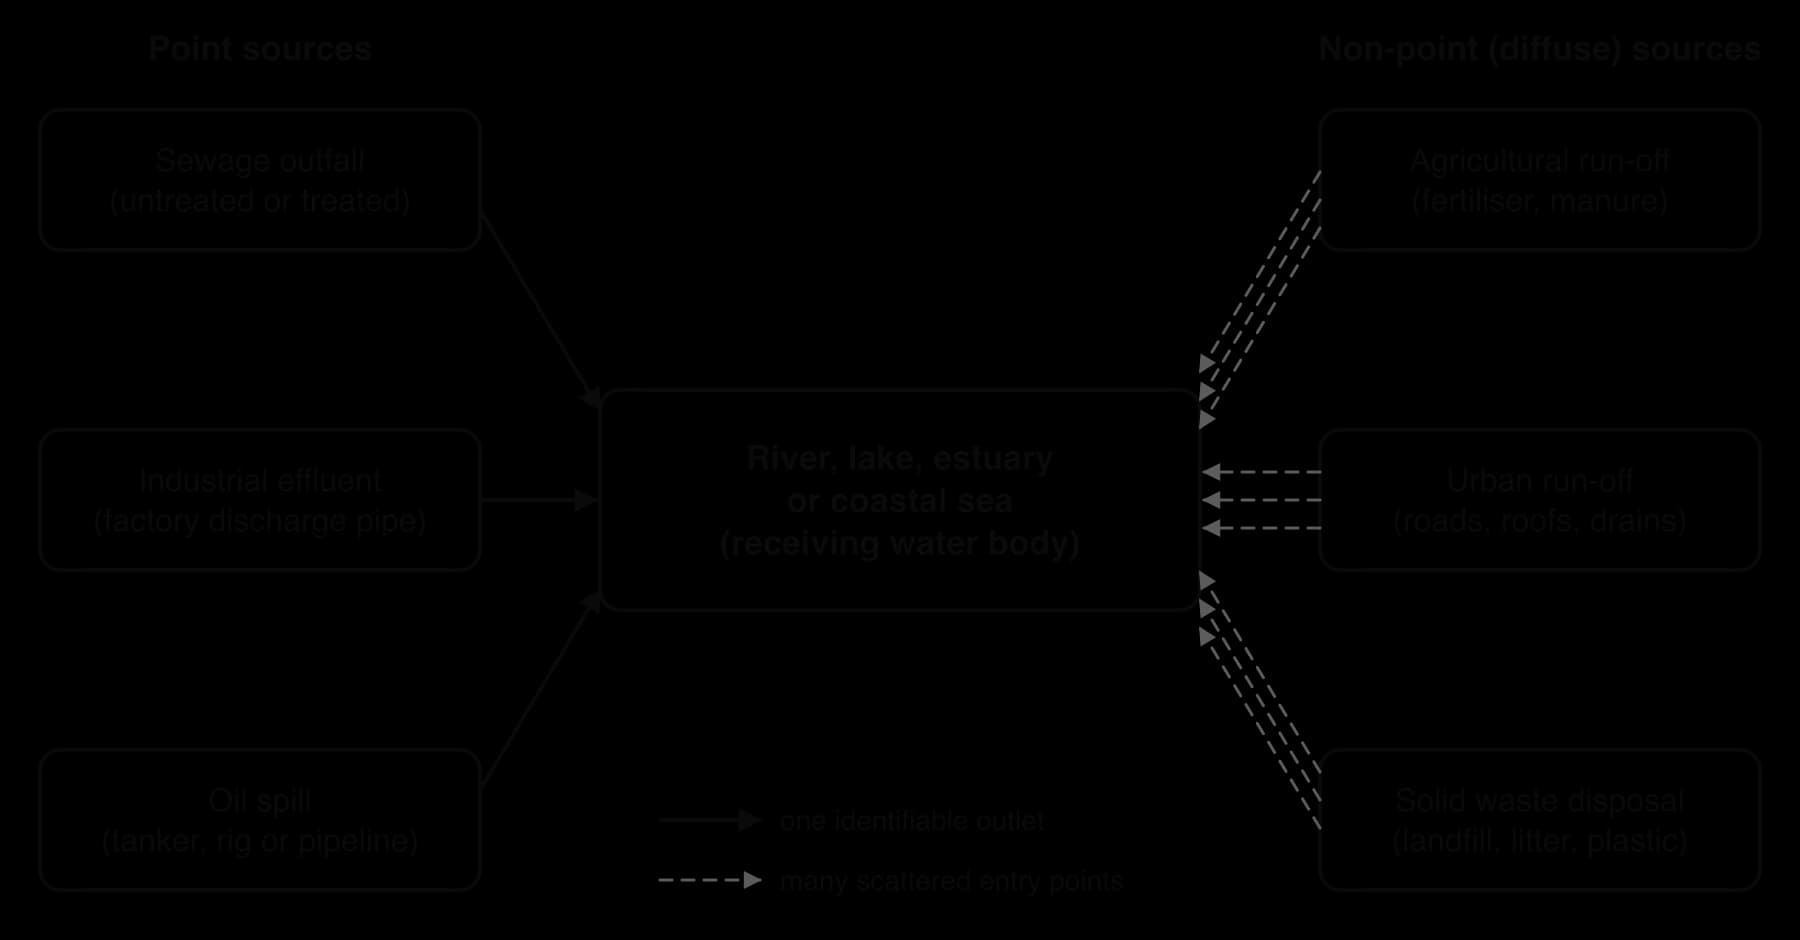
Pollution sources are often classified by how the pollutant enters the water. A point source releases pollution from one identifiable place, such as the outfall pipe of a sewage works or a factory. A non-point source releases pollution from many scattered places over a wide area, such as nitrate washing off thousands of fields or oil and rubber washing off every road in a city.
The distinction matters for management. A point source can be monitored, licensed and fitted with treatment equipment, and the owner can be held responsible. Non-point sources are much harder to control, because each contributor adds only a small amount and the pollution cannot easily be traced back to them. In many high-income countries, controls on factories and sewage works have greatly reduced point-source pollution, so non-point sources, especially agriculture, now supply most of the nutrients reaching rivers and coasts.
Six groups of human activity supply most water pollution. Each adds a typical mixture of pollutants and has typical effects on freshwater and marine ecosystems. Real water bodies usually receive several of them at once, so the impacts add together.
Source | Main pollutants | Typical impacts |
|---|---|---|
Sewage (domestic wastewater) | Organic matter, nitrates and phosphates, pathogens (bacteria, viruses, parasites), detergents, medicines | Oxygen depletion as organic matter decomposes; eutrophication; waterborne diseases such as cholera and typhoid |
Agricultural run-off | Nitrates and phosphates from fertiliser and manure, pesticides, soil sediment | Eutrophication; pesticides toxic to invertebrates and fish; sediment that smothers spawning grounds and cuts light |
Industrial effluent | Heavy metals (mercury, lead, cadmium), acids, dyes, organic chemicals, hot water | Direct poisoning; bioaccumulation and biomagnification of persistent chemicals; changes in pH and temperature |
Urban run-off | Oil, rubber and metal particles from roads, litter, animal waste, salt | Toxic pulses after storms; litter and plastics carried to the sea; warmer water from heated surfaces |
Solid waste disposal | Leachate from landfills (metals, ammonia, organic matter), plastics and other litter | Groundwater contamination; plastic debris in rivers and oceans |
Oil spills | Crude oil and refined fuels | Coats seabirds and mammals; smothers shores and marshes; toxic to fish eggs and larvae |
Sewage and agricultural run-off are the most widespread sources worldwide, because almost every settlement produces sewage and almost all modern farming uses fertiliser. Industrial and oil pollution are more localised but can be extremely toxic. In low-income countries, untreated sewage is the main cause of water-related disease, while in high-income countries the greatest remaining problem is usually diffuse run-off from farms and cities.
Effluent is the general name for liquid waste discharged into the environment from a pipe or outfall, whether it is treated or untreated, domestic or industrial. Agricultural run-off is water that flows over or through farmland into streams, carrying fertiliser, manure, pesticides and soil with it. It is largest after heavy rain on bare soil, and when fertiliser is spread just before rain or in larger amounts than the crop can take up.
An oil spill is the release of crude oil or refined fuel into the environment, most visibly from tankers, offshore rigs and pipelines. Oil floats and spreads into a thin film that blocks gas exchange at the surface. It coats the feathers of seabirds and the fur of sea otters, so they lose insulation and buoyancy, and the lighter, more toxic fractions poison fish eggs, larvae and invertebrates. On shore, oil smothers salt marshes and mangroves, where it can persist in the sediment for decades.
The largest marine spill in history followed the explosion of the Deepwater Horizon drilling rig in the Gulf of Mexico on 20 April 2010. Eleven workers were killed, and about 4.9 million barrels of oil flowed from the damaged well over 87 days until it was capped on 15 July. Responses used two of the three levels of the pollution management model: stricter rules on deep-water drilling and well safety (controlling the release, level 2), and booms, skimmers, controlled burning, chemical dispersants and beach cleaning (removing the oil afterwards, level 3). BP’s costs for clean-up, compensation and penalties exceeded US$65 billion by 2018, including a US$20.8 billion settlement agreed in 2016.
Sources: Wikipedia, “Deepwater Horizon oil spill” (2026), citing US government estimates.
Chronic, smaller leaks can do as much damage as single disasters. In the Niger Delta, decades of leaks from pipelines and illegal refining have polluted the creeks and mangroves of Ogoniland, where many people depend on fishing and farming.
The Citarum River in West Java, Indonesia, shows how industrial effluent, sewage and solid waste combine in a fast-industrialising region. The river is about 270 km long and around five million people live in its basin. It feeds three hydroelectric reservoirs that supply Bandung and Greater Jakarta with electricity and irrigates rice fields downstream.
More than 2,000 industries, many of them textile factories, discharge into the river, adding heavy metals such as lead, mercury and arsenic. Environmental groups estimate that about 20,000 tonnes of waste and 340,000 tonnes of textile wastewater enter it every day, and fish numbers are reported to have fallen by about 60% since 2008. In 2018 the national government launched a seven-year clean-up plan in which 7,000 soldiers were assigned to clear waste and block illegal discharge pipes, alongside new waste and water treatment facilities. Weak coordination, limited funding and bribery by some factories have slowed progress.
Sources: Wikipedia, “Citarum River” (2026).
The Ganges is sacred to Hindus and supports hundreds of millions of people in northern India, but much of the sewage from the towns along its banks has entered it untreated. The Namami Gange programme, announced in 2014 with an original budget of ₹20,000 crore, funds new sewage treatment plants, monitoring of industrial effluent, riverfront works and public awareness campaigns. By 2020 treatment capacity was roughly 2,000 million litres per day, against an estimated need of 3,600.
Progress has been uneven. A government audit found that only about a quarter of the available money had been spent between 2014 and 2017, and the national pollution control board still judged water along most of the river unfit for bathing and drinking in 2020. The case shows that building treatment works (level 2 management) is slow and expensive, and that it achieves little if sewers do not connect homes to the plants.
Sources: Wikipedia, “Namami Gange Programme” (2026), citing the Comptroller and Auditor General of India (2018) and the Central Pollution Control Board (2020).
Example | Main source | Key impacts | Main management response |
|---|---|---|---|
Deepwater Horizon, Gulf of Mexico (2010) | Oil spill from an offshore well (point source) | Oiled coasts, seabirds, turtles and dolphins; fisheries closed | Clean-up (level 3); drilling safety rules (level 2) |
Citarum River, Indonesia | Textile effluent, sewage and solid waste | Heavy metals in water; fish numbers down by about 60% since 2008 | Military-led clean-up and blocking of illegal pipes (levels 2 and 3) |
Ganges, India | Untreated sewage from riverside towns | Water unfit for bathing and drinking along much of the river | New sewage treatment plants under Namami Gange (level 2) |
Plastics are cheap, light and durable, which makes them useful and also makes them a lasting pollutant. Most plastics do not biodegrade on any human timescale. Instead, sunlight, heat and wave action break them into smaller and smaller pieces. Plastic pollution reaches the sea from land, mainly through litter, poorly managed landfills and rivers, and from the sea itself, as fishing nets, lines and buoys are lost or discarded.
Entanglement. Seals, turtles, whales and seabirds become trapped in lost nets and packaging, which can drown them or cut into their bodies as they grow. Nets that keep catching animals after being lost are called ghost gear.
Ingestion. Turtles mistake plastic bags for jellyfish and seabirds feed floating fragments to their chicks. Plastic fills the stomach, so animals starve with a full gut.
Transport of species. Floating debris carries barnacles, algae and other organisms to new regions, where some can become invasive.
Habitat damage. Debris smothers coral reefs and the seabed and blocks light.
An oceanic gyre is a large system of rotating surface currents, driven by the prevailing winds and deflected by the Earth’s rotation. There are five major subtropical gyres, in the North and South Pacific, the North and South Atlantic and the Indian Ocean. Wind-driven surface currents move floating material slowly towards the calm centre of each gyre, where it is trapped. Over years, floating plastic accumulates there in a garbage patch.
The best-studied example is the Great Pacific Garbage Patch, in the North Pacific Subtropical Gyre between Hawaii and California. A 2018 study estimated that it covered about 1.6 million km² and held 45,000–129,000 tonnes of plastic. It is not a solid island. Most of it is a scattered “soup” of fragments, many too small to see from a ship. By count, about 94% of the estimated 1.8 trillion pieces were microplastics, but by mass most of the plastic was in large objects, and lost fishing nets made up nearly half of the total mass.
Sources: Wikipedia, “Great Pacific garbage patch” (2026), citing Lebreton et al. (2018).
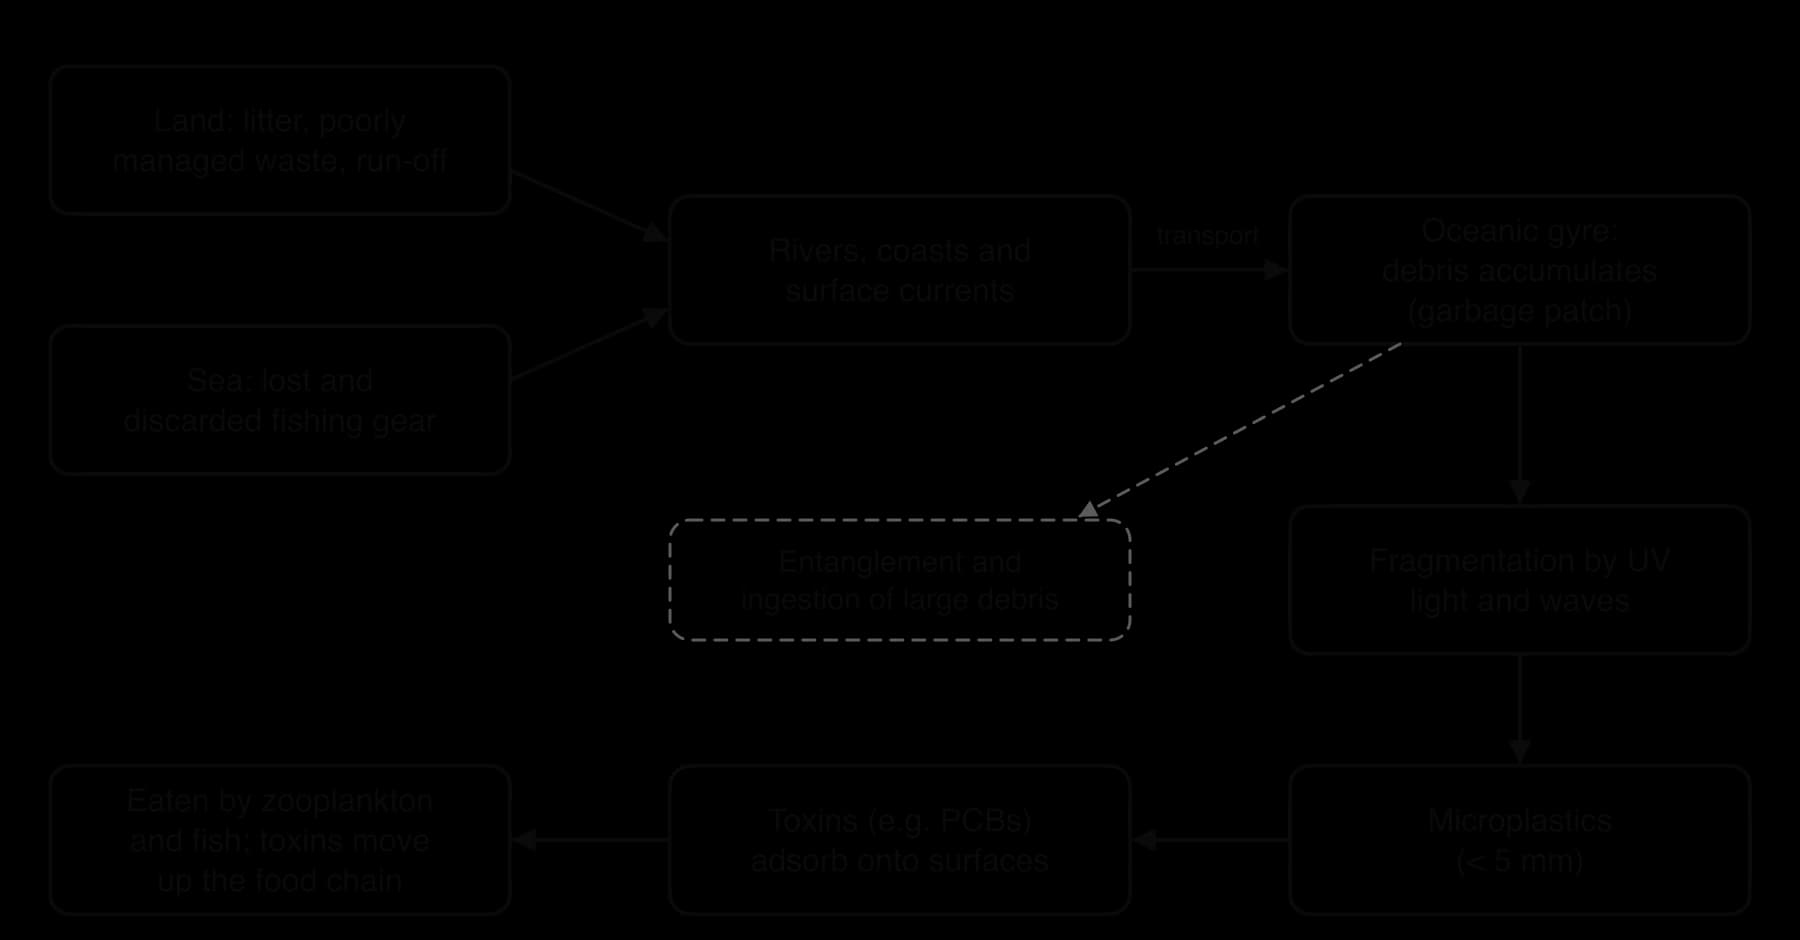
Microplastics are plastic particles smaller than 5 mm. Some are made small (microbeads in cosmetics, pellets used to make plastic goods and fibres shed from synthetic clothes in washing machines), and others form when larger plastic breaks down. Because they are the same size as plankton, they are eaten by zooplankton, filter-feeding shellfish, small fish and seabirds.
Microplastics are also carriers of toxins. Many persistent organic pollutants, such as PCBs and DDT residues, are hydrophobic: they dissolve poorly in water but stick readily to oily plastic surfaces. A floating particle therefore collects these chemicals from the surface layer of the sea, where they are concentrated, and delivers them to whatever eats it. Inside the animal, the toxins can be released into fatty tissue, where they build up over its lifetime (bioaccumulation) and become more concentrated at each step up the food chain (biomagnification). Top predators, including tuna, seals and the people who eat seafood, receive the highest doses.
Plastic management follows the same three levels as any other pollution (the three-level model is set out in full later). The most effective measures remove plastic from the supply chain before it is made or used; others stop it escaping into rivers; the last remove it from the sea.
Reducing use. Bangladesh banned lightweight plastic bags in 2002, the first country to do so. Rwanda has banned them since 2008 and Kenya since 2017, while England introduced a 5p charge per bag in 2015, raised to 10p in 2021. Charges and bans change consumer behaviour at little public cost.
Redesigning products. Reusable packaging, refill systems and materials that are easier to recycle reduce the flow of plastic into waste. Extended producer responsibility schemes make manufacturers pay for collecting and recycling their packaging.
Stopping escape. Better waste collection in fast-growing cities, river barriers and nets, and port facilities for old fishing gear catch plastic before it reaches the open sea.
Clean-up. The Ocean Cleanup, a non-profit organisation, has towed long floating barriers through the Great Pacific Garbage Patch since 2018. By the end of 2024 it had removed only a small fraction of the plastic estimated to be in the patch.
A technocentric view stresses clean-up technology and biodegradable materials. An ecocentric view argues that clean-up treats symptoms and that production of single-use plastic must fall. Most scientists agree that clean-up can only work alongside large cuts in the amount of plastic entering the sea, because new plastic arrives faster than barriers can remove it.
Sources: Wikipedia, “Phase-out of lightweight plastic bags” and “Great Pacific garbage patch” (2026).
Water quality describes how suitable water is for a particular use, such as drinking, irrigation, swimming or supporting a healthy ecosystem. It is measured through a set of chemical, physical and biological characteristics. No single measurement describes water quality fully, because different pollutants change different characteristics.
Water quality varies naturally from place to place and from hour to hour. A shaded mountain stream is colder and richer in oxygen than a slow lowland river; dissolved oxygen in a pond rises during the day as plants photosynthesise and falls at night as everything respires; a storm can wash in sediment and nutrients within hours. Single readings can therefore mislead, and monitoring programmes take repeated measurements at fixed sites and times.
Parameter | What it shows | How it is measured | Effect of pollution |
|---|---|---|---|
Dissolved oxygen (DO) | Oxygen available for aquatic animals and aerobic decomposers | Oxygen probe or meter (mg L⁻¹ or % saturation); Winkler titration | Falls with organic pollution, eutrophication and warming |
pH | Acidity or alkalinity | pH probe or indicator paper | Lowered by acid mine drainage and acid deposition; raised or lowered by some industrial effluents |
Temperature | Controls oxygen solubility and metabolic rates | Thermometer or probe (°C) | Raised by cooling water from power stations and run-off from hot surfaces |
Turbidity | Cloudiness caused by suspended particles | Secchi disc depth (m) or turbidity meter | Raised by soil erosion, sewage and algal blooms |
Nitrates and phosphates | Nutrient levels | Colorimetric test kits or meters (mg L⁻¹) | Raised by fertilisers, manure, sewage and detergents |
Specific metals | Toxic elements such as lead, mercury, cadmium and arsenic | Laboratory analysis | Raised by mining, industry and some natural rocks |
Total suspended solids (TSS) | Mass of particles that can be filtered out | Filter a known volume, dry and weigh the filter (mg L⁻¹) | Raised by erosion, construction and sewage |
Dissolved oxygen is the single most useful measure of the health of most freshwater ecosystems, because almost all fish and invertebrates need it. Cold water holds more oxygen than warm water, so a reading is often expressed as a percentage of the maximum the water could hold at that temperature (percentage saturation). Clean, well-mixed water is usually close to 100% saturated.
High turbidity reduces light for photosynthesis by rooted plants and phytoplankton, clogs the gills of fish and the feeding structures of filter feeders, and covers gravel beds where fish lay their eggs. Suspended particles also absorb heat and carry attached pollutants such as phosphate and metals.
A Secchi disc is a flat disc, usually 20–30 cm across and painted in black and white quarters, attached to a marked line. It is lowered slowly into the water until it just disappears from view, then raised until it just reappears; the average of the two depths is the Secchi depth. Clear water gives a large Secchi depth; turbid water, or water full of phytoplankton, gives a small one.
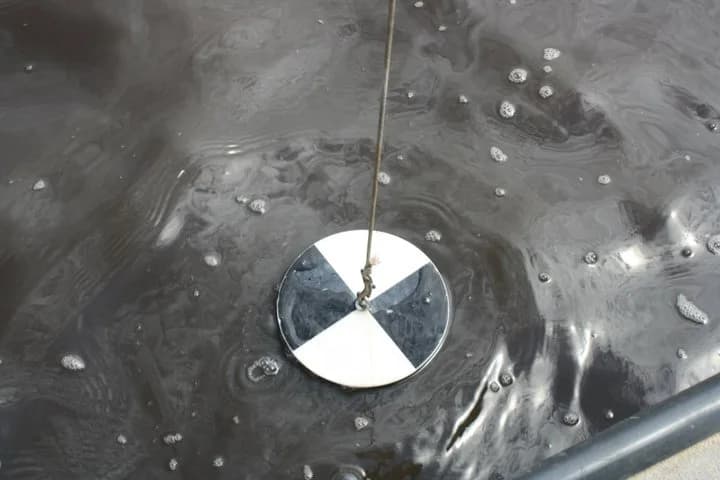
The method needs only cheap equipment, so it is widely used in schools and citizen science. Its results depend on the observer’s eyesight, the angle of the sun, glare from the surface and whether the reading is taken in shade, so the same person should take readings at the same time of day, on the shaded side of the boat, without sunglasses.
Because each parameter tells only part of the story, scientists often combine several of them into a single number on a common scale, a water quality index (WQI). An index allows rivers to be ranked, changes over time to be tracked and results to be explained to the public and to decision-makers. The way such an index is built, and its limitations, are developed in the HL material on water quality indices.
Monitoring informs management. Regular data show whether a river meets its legal standards, warn of sudden pollution incidents, help identify the source of a problem by comparing readings upstream and downstream of a suspected outfall, and show whether a clean-up has worked.
Organic pollution, from sewage, manure, food-processing waste, paper mills or dead algae, does not usually poison aquatic life directly. The damage comes from the decomposers that feed on it. Bacteria and fungi break down the organic matter by aerobic respiration, using dissolved oxygen as they do so. The more organic matter there is, the more oxygen they consume.
If decomposers remove oxygen faster than it is replaced by diffusion from the air and by photosynthesis, the dissolved oxygen concentration falls. Sensitive animals such as trout and mayfly nymphs die or move away, and only species tolerant of low oxygen survive. The amount of oxygen decomposers need is therefore an indirect measure of how much organic matter the water contains.
BOD is sometimes called biological oxygen demand; both names mean the same measurement. It is an indirect measure because it records the oxygen used, not the organic matter itself.
Two identical samples are taken from the same place at the same time, filling the bottles completely so that no air bubbles are trapped.
The dissolved oxygen in the first sample is measured immediately.
The second bottle is sealed and kept in the dark at 20 °C for five days. Darkness stops any algae in the sample photosynthesising and adding oxygen; the fixed temperature keeps the rate of decomposition comparable between samples.
After five days the dissolved oxygen in the second sample is measured.
The BOD is the difference between the two readings.
Very polluted samples can run out of oxygen before day 5, which would make the BOD look smaller than it really is. Laboratories therefore dilute such samples with clean, oxygen-saturated water and multiply the result by the dilution factor.
When organic waste enters a river at a point source, dissolved oxygen and BOD change in a predictable way downstream. The pattern is called the oxygen sag curve, after the dip (“sag”) in dissolved oxygen below the outfall.
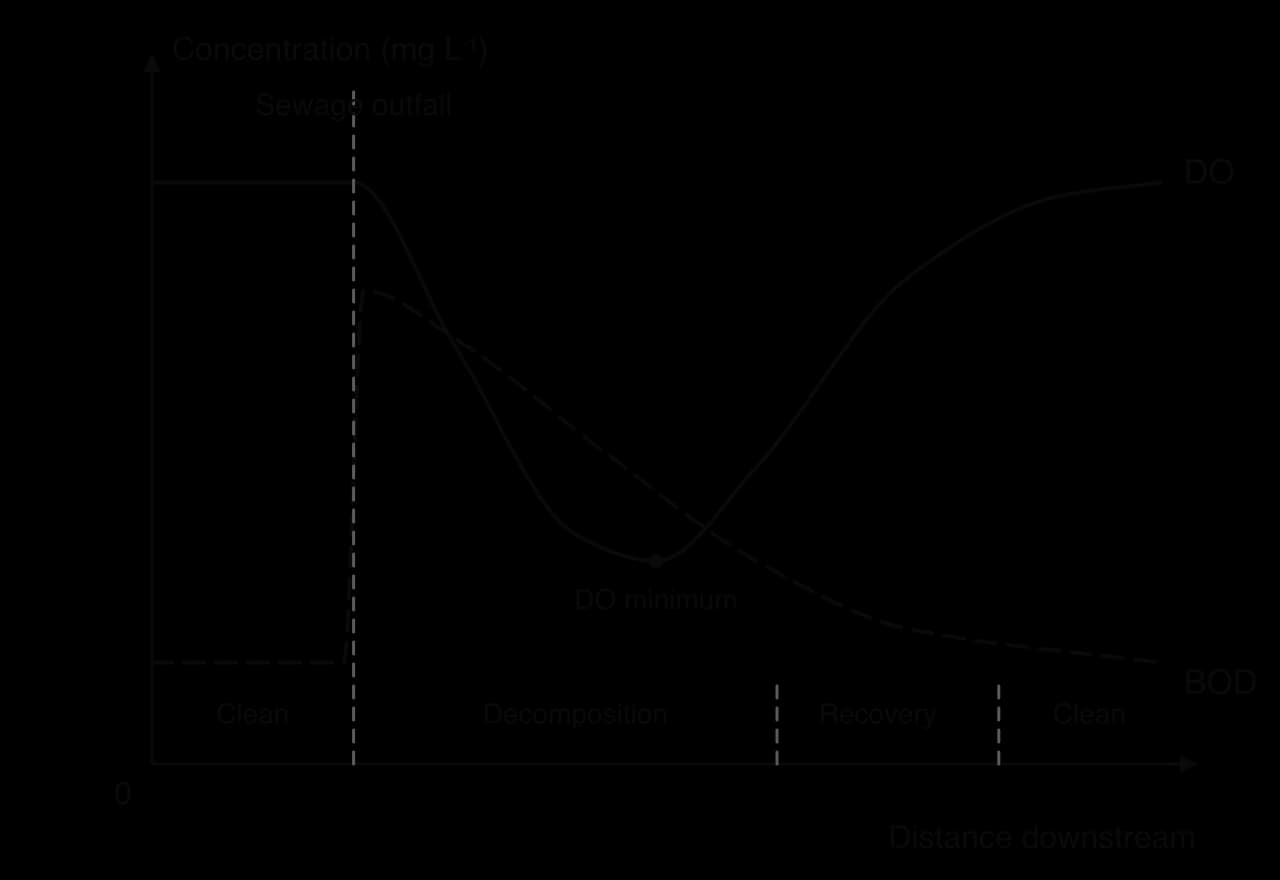
Upstream (clean zone): low BOD and high DO; a diverse community including oxygen-sensitive species.
At and just below the outfall (decomposition zone): BOD jumps; decomposers multiply; DO falls rapidly, reaching its lowest point some distance downstream. Turbidity rises, and only tolerant species such as sludge worms and bloodworms survive in large numbers.
Recovery zone: with less organic matter left, oxygen use slows; diffusion from the air and photosynthesis by algae replace oxygen faster than it is used, so DO rises again. Nutrients released by decomposition may cause algal growth.
Downstream (clean zone): DO and BOD return to near their upstream levels and sensitive species reappear.
The length of the sag depends on how much waste enters, the temperature (warm water holds less oxygen and speeds up decomposition) and how quickly the river is re-aerated. A fast, turbulent upland stream recovers within a short distance; a slow, deep lowland river may stay low in oxygen for many kilometres.
Plants and phytoplankton need light, carbon dioxide, water and mineral nutrients to grow. In many lakes, rivers and coastal seas, one nutrient is in short supply and holds back growth: it is the limiting factor. In most freshwater lakes the limiting nutrient is usually phosphate; in many estuaries and coastal seas it is more often nitrate. When people add the limiting nutrient, phytoplankton can suddenly grow far faster than before.
Eutrophication can happen naturally and slowly, as a lake gradually fills with sediment and nutrients over thousands of years. The problem today is cultural or human-caused eutrophication, which can transform a lake in a few years. Its human sources are:
Agricultural fertilisers containing nitrate and phosphate, washed off fields in run-off or leached through soil into groundwater and streams.
Animal manure from intensive livestock farms, spread on land or leaking from storage.
Sewage, which is rich in both nitrogen and phosphorus, released untreated or after treatment that does not remove nutrients.
Detergents containing phosphates, which were added to laundry and dishwasher products to soften water.
Nitrogen oxides from vehicles and power stations, which are deposited from the air into lakes and seas.
An algal bloom is a rapid increase in the population of phytoplankton that colours the water green, brown or red. A bloom happens only if growth was previously limited by a shortage of nitrate or phosphate. Adding nitrate to a lake whose phytoplankton are short of phosphate has little effect, which is why reducing phosphate alone has restored many lakes.
Nitrate (NO₃⁻) is the main form in which plants take up nitrogen. It is highly soluble and is not held by soil particles, so it is easily washed out of soil into streams and groundwater. Phosphate (PO₄³⁻) is the form in which phosphorus is taken up by plants. Unlike nitrate, it binds tightly to soil particles, so most phosphate reaches water attached to eroded soil or in sewage and manure. Phosphate stored in lake sediments can later be released back into the water, which is why eutrophic lakes can take decades to recover.
The nutrients themselves are not toxic at the concentrations found in most eutrophic water. The damage comes from a chain of effects that the extra growth sets off:
Nutrient input. Nitrates and phosphates enter the water.
Excessive phytoplankton growth. The limiting nutrient is no longer short, so phytoplankton multiply into an algal bloom, turning the water green and cloudy.
Shading. The bloom blocks light, so rooted plants (macrophytes) on the bottom cannot photosynthesise and die.
Death. Phytoplankton live only days or weeks, so huge numbers die and sink, along with the dead rooted plants.
High rates of decomposition. Aerobic decomposers multiply and break down the dead organic matter, and the BOD rises.
Rapid oxygen consumption. Decomposers use dissolved oxygen faster than it can be replaced, especially in deep or still water where little oxygen mixes down from the surface.
Hypoxia or anoxia. Oxygen falls to very low levels, or to zero.
Death of oxygen-dependent life. Fish, shellfish and many invertebrates suffocate. Anaerobic bacteria take over, producing hydrogen sulfide and methane, which smell and are toxic.
Anoxia is the complete absence of dissolved oxygen. In anoxic water only anaerobic microorganisms survive, and chemical changes in the sediment release stored phosphate and toxic hydrogen sulfide into the water.
Eutrophication can be drawn as a systems diagram, with storages (nutrients in the water, phytoplankton, dead organic matter, dissolved oxygen, fish and invertebrates) linked by flows (uptake, death, decomposition, respiration). The key feature is a positive feedback loop, which amplifies a change rather than reducing it.
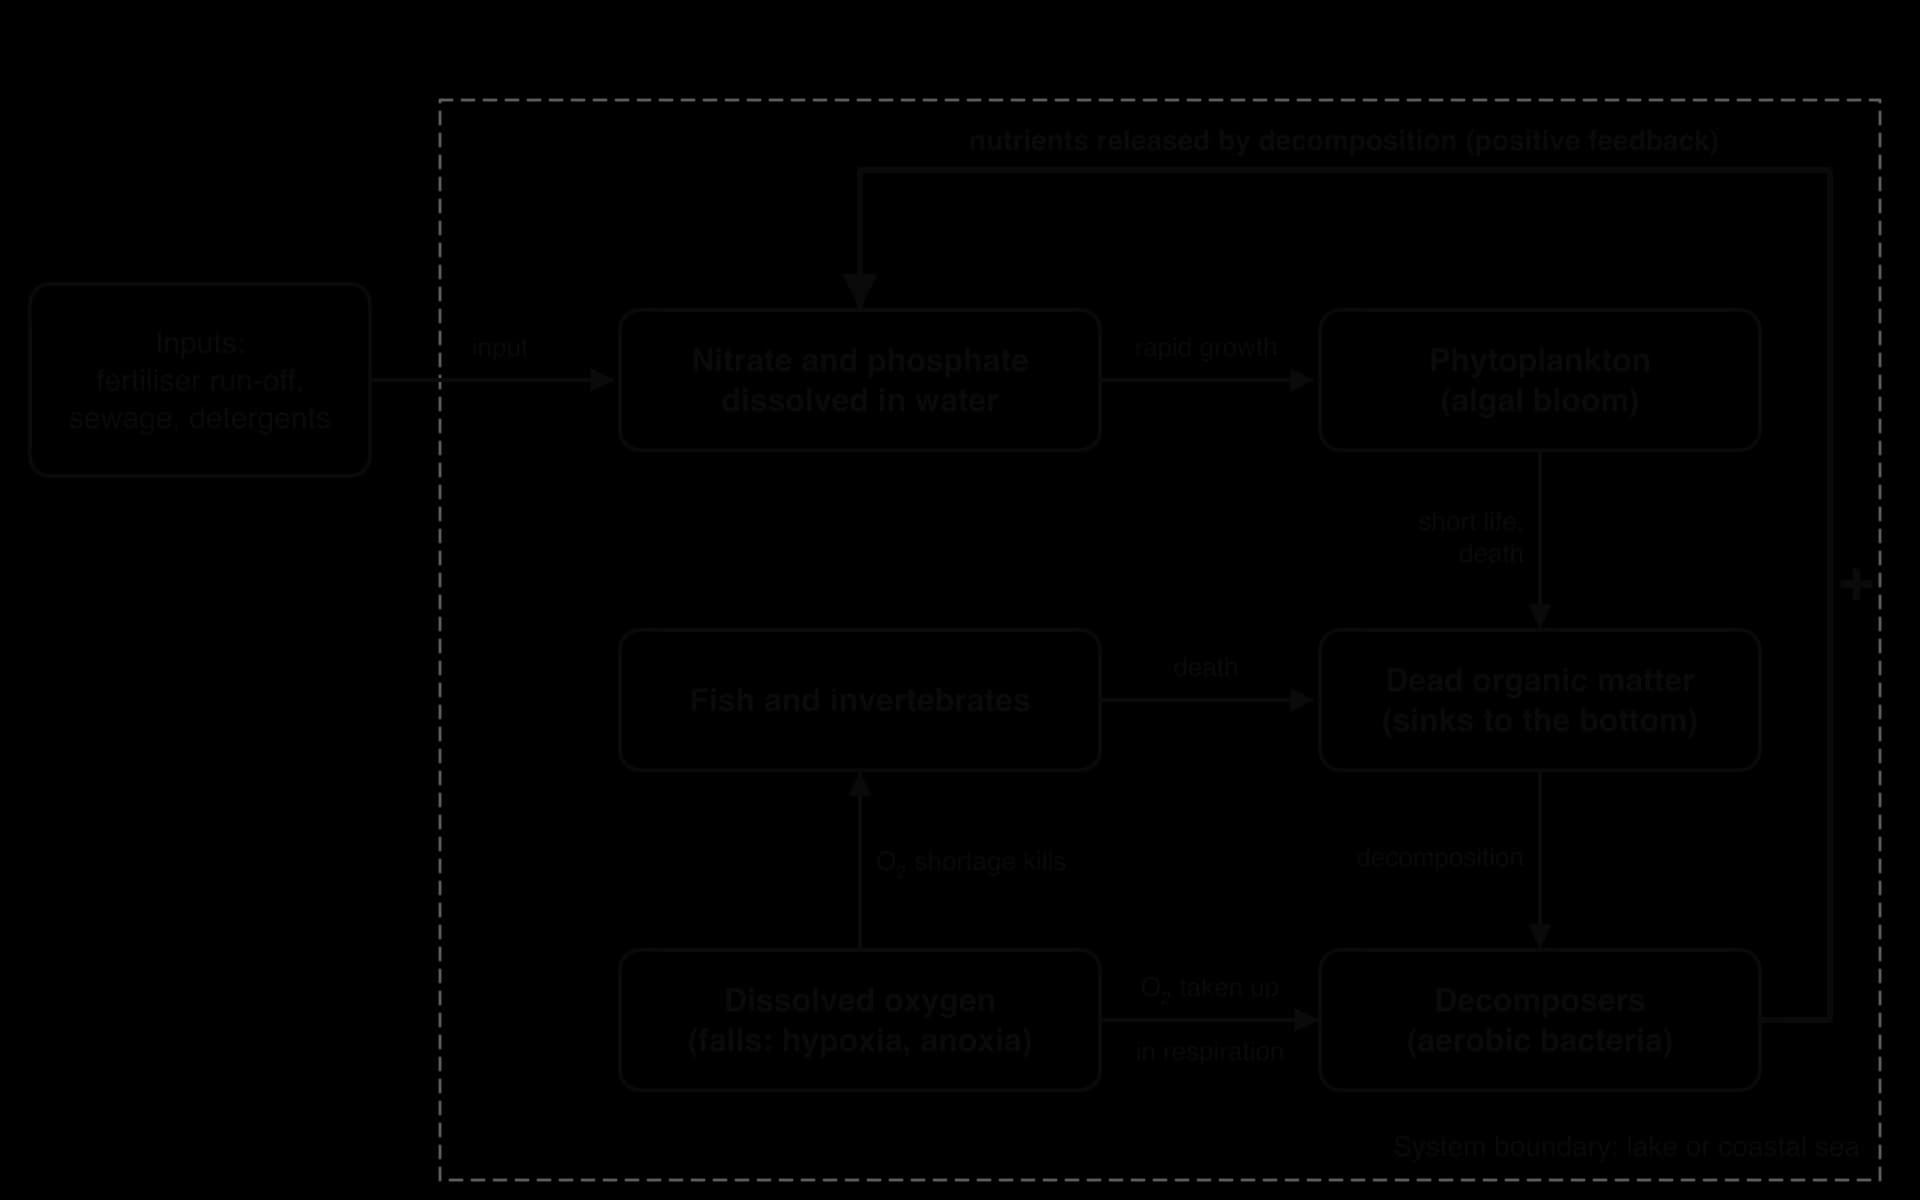
More nutrients lead to more phytoplankton and, through shading and low oxygen, more deaths. More deaths mean more dead organic matter and more decomposition. Decomposition releases the nutrients that were locked in the dead organisms back into the water, and under anoxic conditions the sediment also releases stored phosphate. This adds to the nutrient supply, so the cycle speeds up even if no more fertiliser arrives from outside.
Positive feedback can push a lake past a tipping point. Many shallow lakes have two alternative stable states: a clear-water state dominated by rooted plants, which hold the sediment in place and take up nutrients, and a turbid state dominated by phytoplankton. Once the rooted plants have died, the lake can stay turbid even after nutrient inputs are cut back, because nutrients keep being recycled from the sediment and no plants remain to stabilise it. This kind of regime shift explains why prevention is much cheaper than restoration.
 YouTube
Ecosystem services are the benefits people obtain from ecosystems. Eutrophication damages several of them at once, which is why its costs reach far beyond the ecosystem itself.
Ecosystem service | How eutrophication affects it | Example of who loses |
|---|---|---|
Fisheries (provisioning) | Fish kills; loss of spawning grounds in low-oxygen water; shift to less valuable, more tolerant species | Commercial and small-scale fishers; communities that depend on fish for protein |
Drinking water (provisioning) | Algae clog filters; taste and odour problems; some blooms release toxins; nitrate itself is harmful in high concentrations | Water companies and the households who pay for extra treatment |
Recreation (cultural) | Beaches closed by scum and toxins; swimming, boating and angling become unpleasant or unsafe | Tourism businesses, local residents |
Aesthetics (cultural) | Green, smelly water and rotting algae on shores | Property owners, people who value the place for its beauty |
Health (regulating) | Toxic blooms can sicken people, pets and livestock; poor water quality favours some disease-carrying organisms | People who drink, swim in or eat food from the water |
Biodiversity and nutrient cycling (supporting) | Loss of sensitive species, seagrass beds and bottom-living animals; less capacity to absorb further nutrients | Future generations; everyone who depends on a resilient ecosystem |
Many of these losses have a market price, such as reduced fish catches or water treatment costs, while others, such as the loss of a clear lake that people value for its beauty, are real but harder to measure. Because the people who lose services are often not the farmers or cities that release the nutrients, eutrophication is a classic case of costs passed on to others.
Any pollution problem can be broken into a sequence of three stages: a human activity produces a pollutant, the pollutant is released into the environment, and it has a long-term impact on ecosystems and people. Management can act at each stage. This gives the three-level pollution management model, which applies to eutrophication, plastics, oil, air pollution, acid deposition and solid waste alike.
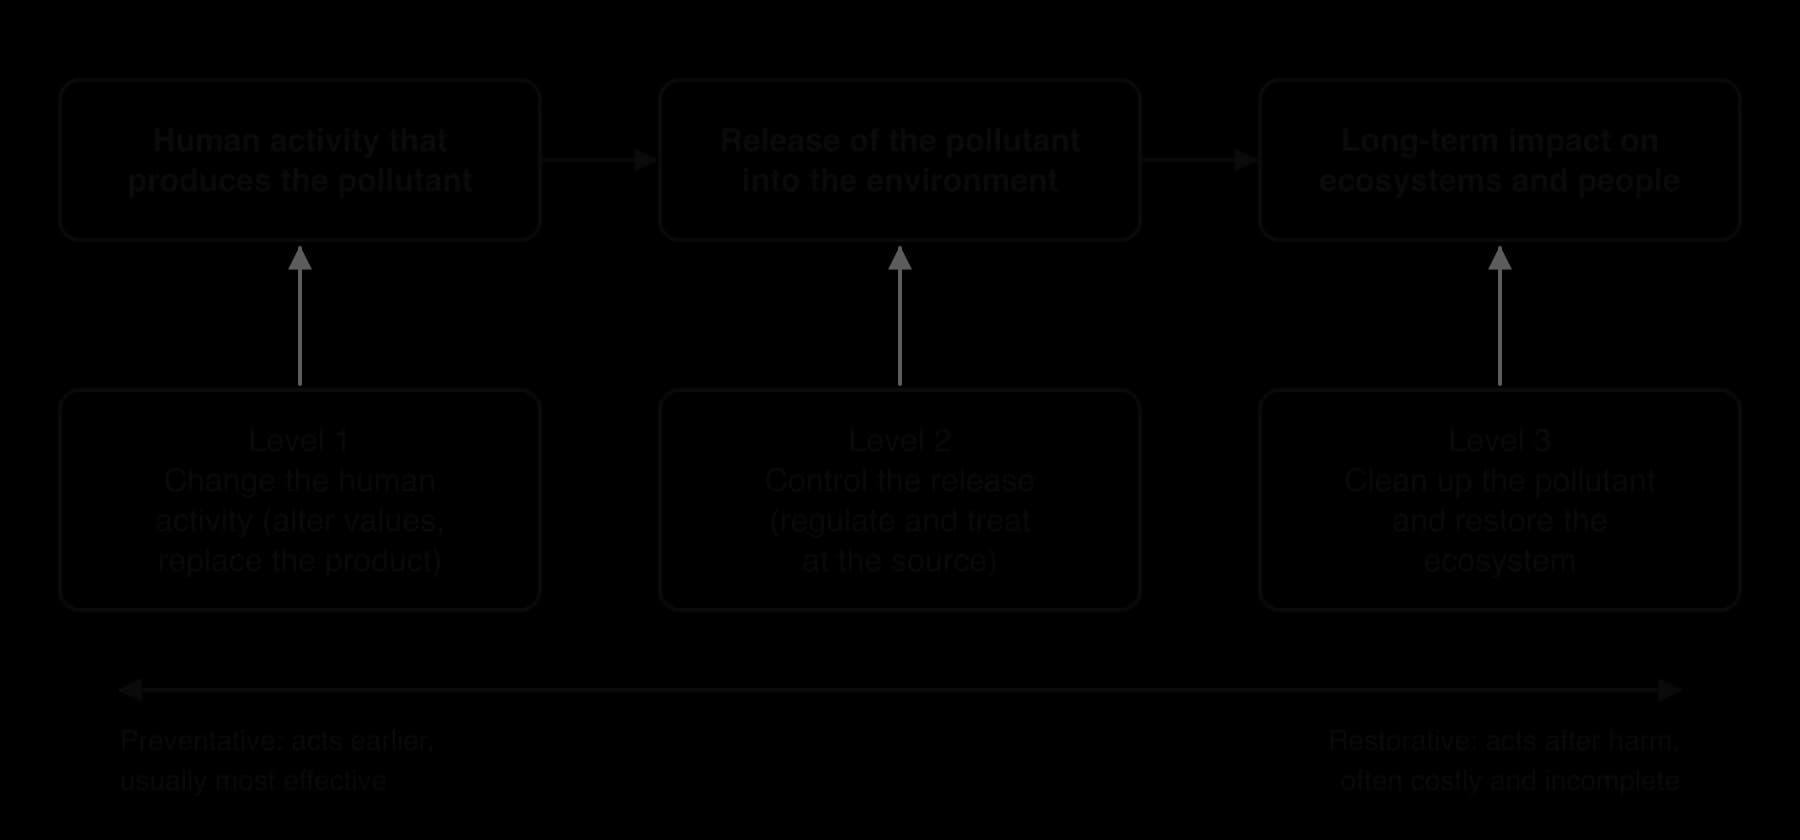
Level 1: change the human activity that produces the pollutant. This means altering values, behaviour or technology so that less of the pollutant is made: changing consumer choices, replacing a product with a less harmful one, or changing farming systems. It is preventative and tackles the root cause.
Level 2: control the release of the pollutant. The activity continues, but laws, standards, taxes and technology reduce how much of the pollutant escapes into the environment: treatment at the end of the pipe, emission limits, buffer zones. It is also preventative, but it treats a symptom of the activity rather than the activity itself.
Level 3: clean up the pollutant and restore the ecosystem. Once the pollutant is in the environment, it is removed, neutralised or contained, and damaged habitats and populations are restored. It is restorative.
Level | Strategy | Strengths | Limitations |
|---|---|---|---|
1: Change the activity | Replace phosphate detergents with phosphate-free ones; apply fertiliser more precisely or use organic farming; eat less meat so fewer nutrients are needed for animal feed; ban or limit fertiliser use near water | Tackles the cause; cheap once adopted; benefits several services at once | Needs changes in behaviour and farming practice; may lower yields or raise food prices; slow to show results |
2: Control the release | Tertiary wastewater treatment that removes nitrate and phosphate; buffer strips of vegetation along rivers; constructed wetlands; regulations on when and how much manure can be spread; taxes on fertiliser | Effective for point sources; can be enforced by law; proven technology | Expensive to build and run; hard to apply to diffuse farm run-off; does not remove nutrients already stored in sediments |
3: Remove and restore | Dredge nutrient-rich mud from lakes; pump oxygen into deep water; add chemicals that lock phosphate into sediment; harvest algae; reintroduce rooted plants and fish (biomanipulation) | Can produce rapid improvement in a small lake; restores habitats and services | Costly; treats symptoms, so the problem returns if inputs continue; can disturb the ecosystem; impractical for large seas |
Biomanipulation is a level 3 method that uses food webs to clear water. Removing fish that eat zooplankton (and stir up mud) allows zooplankton populations to grow and graze down phytoplankton; adding predatory fish and replanting rooted plants then helps the clear-water state stabilise. It has worked in many small Dutch and Danish lakes, but usually only where nutrient inputs had already been cut.
The model works for any pollutant, which makes it a useful tool for comparing strategies:
Pollutant | Level 1 | Level 2 | Level 3 |
|---|---|---|---|
Marine plastic | Bans and charges on single-use plastics; reusable packaging | Better waste collection; river barriers; extended producer responsibility | Beach clean-ups; ocean clean-up barriers |
Oil | Use less oil (renewable energy, efficient transport) | Double-hulled tankers; safety rules for drilling; blowout preventers | Booms, skimmers, dispersants, controlled burning; cleaning birds and shores |
Sewage | Water-saving toilets; keeping wet wipes, fats and medicines out of drains | Sewage treatment; separate storm and sewage pipes to stop overflows | Disinfecting contaminated water; restoring river habitats |
Acid deposition | Switch from coal to renewable energy | Scrubbers on power station chimneys; catalytic converters | Adding lime to acidified lakes and soils |
Like any model, the three-level model simplifies reality. Its strengths are that it applies to every kind of pollution, it shows clearly that prevention acts earlier than cure, and it helps decision-makers compare options and combine them. Its limitations are worth knowing as well:
Real strategies do not always fit neatly into one level: a fertiliser tax both changes farming practice (level 1) and reduces run-off (level 2).
It does not show cost, time lags or who pays and who benefits, which often decide what is actually done.
It treats the pollution process as a simple chain, while real systems include feedback, such as phosphate released from sediments, that can keep a problem going after inputs stop.
It does not show that pollution often crosses borders, so the level at which action is possible may depend on international agreement.
Which level a society prefers depends partly on its environmental value systems.
Perspective | Typical view of water pollution | Preferred strategies |
|---|---|---|
Ecocentric | Rivers and seas have value in themselves; pollution reflects overconsumption | Level 1: less intensive farming, lower consumption, the precautionary principle |
Anthropocentric | Water must be managed for people’s long-term benefit; costs and benefits should be weighed | Mixture of levels: regulation, taxes on polluters, protecting ecosystem services |
Technocentric | Technology can solve pollution while economic activity continues | Levels 2 and 3: advanced treatment plants, precision agriculture, clean-up technology |
Different groups also bear different costs. Farmers may lose income if fertiliser use is restricted, while fishers and tourism businesses gain. Cities pay for sewage treatment through water bills, while downstream communities, often poorer and with less political influence, receive the pollution if treatment is not built. These questions of fairness link water pollution to environmental justice.
The Baltic Sea in northern Europe is a shallow, almost enclosed arm of the Atlantic, with an average depth of about 55 m. It is bordered by nine countries (Denmark, Estonia, Finland, Germany, Latvia, Lithuania, Poland, Russia and Sweden), and its drainage basin, about four times the area of the sea, extends into five more. It is the world’s largest body of brackish water: rivers supply fresh water at the surface, while denser salt water enters only through the narrow Danish straits.
This structure makes the sea especially vulnerable to eutrophication. The fresher surface water floats on top of the saltier deep water, separated by a halocline, a layer where salinity changes sharply. The halocline acts as a lid that stops oxygen from the surface mixing down. Water in the deep basins is renewed only by occasional large inflows of oxygen-rich salt water from the North Sea, and the sea’s water as a whole takes about 25 years to be replaced.
The deep Baltic has had periods of low oxygen naturally, for example between about 8,000 and 4,000 years ago. Hypoxia returned around 1900 and spread through the 20th century as nutrient loads grew with the use of synthetic fertilisers, intensive livestock farming, the growth of cities and the burning of fossil fuels. Over the 40 years to 2009, bottom waters with less than 2 mg L⁻¹ of oxygen covered on average about 49,000 km² of the sea floor, an area larger than Denmark, and the extent has exceeded 60,000 km² in recent years.
The main nutrient sources today are:
Rivers, which carry about three-quarters of the nitrogen and most of the phosphorus. Agriculture is the largest single source, with smaller amounts from sewage works and scattered rural homes.
The atmosphere, which supplies about a fifth of the nitrogen, as nitrogen oxides from vehicles, ships and power stations and as ammonia from livestock are deposited on the sea.
Direct point sources on the coast, such as sewage works and factories, which now supply only a few per cent of the total because most have been fitted with treatment.
Impacts follow the eutrophication sequence. Summer blooms of cyanobacteria cover large areas of the central Baltic, deposit scum on beaches and can be toxic. Dead plankton sink below the halocline, where decomposers use up the oxygen. In the anoxic bottom waters, hydrogen sulfide forms and bottom-living animals die over tens of thousands of square kilometres.
The deep water also shows the positive feedback in action. When bottom water becomes anoxic, the sediment releases stored phosphate into the water. This “internal loading” fertilises further blooms, which sink and decompose, keeping the bottom anoxic. Phosphorus released from the sediments can be as important as new inputs from the land, which is a major reason why recovery is slow.
The fishery that depended on these deep basins has suffered most. Eastern Baltic cod need water that is both salty and well oxygenated for their eggs to survive, and these conditions are now rare, found mainly in the Bornholm Basin. Combined with years of overfishing, the loss of spawning habitat left the eastern Baltic cod stock so small that commercial fishing for it has been prohibited since 2019.
Sources: Wikipedia, “Baltic Sea”, “Baltic Sea hypoxia”, “Dead zone (ecology)” and “Atlantic cod” (2026); HELCOM, “Inputs of nutrients to the sub-basins” indicator (2025).
The Helsinki Commission (HELCOM) sets a maximum allowable input (MAI) of nitrogen and of phosphorus for each part of the sea: the largest load that would still allow it to reach a good environmental state. For the sea as a whole, the limits are about 792,000 tonnes of nitrogen and 21,700 tonnes of phosphorus a year. In 2023 the actual inputs were about 840,000 tonnes of nitrogen and 23,000 tonnes of phosphorus (after correcting for that year’s river flow).
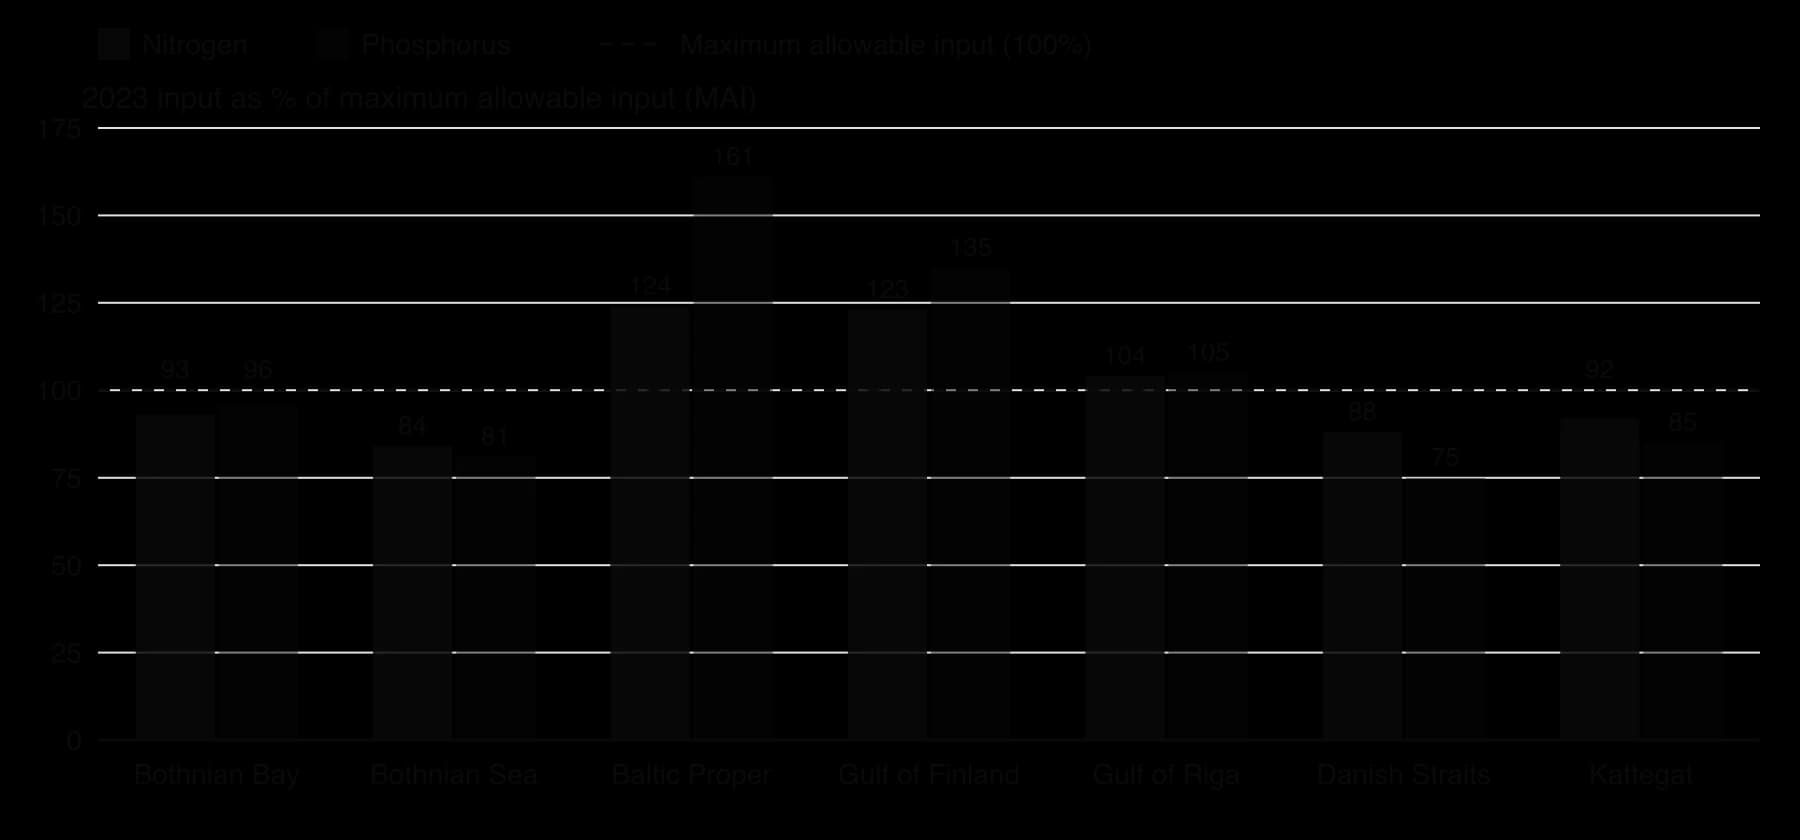
Compared with the reference period 1997–2003, total phosphorus inputs to the Baltic fell by about 33% and nitrogen by about 11%. The largest cuts were in phosphorus to the Gulf of Finland (48%) and the Baltic Proper (35%), mostly from better sewage treatment. Nitrogen inputs to the Gulf of Finland and the Gulf of Riga showed no significant change.
Sub-basin | Change in nitrogen since 1997–2003 | Change in phosphorus since 1997–2003 | Both limits met in 2023? |
|---|---|---|---|
Bothnian Bay | −18% | −17% | Yes |
Bothnian Sea | −26% | −24% | Yes |
Baltic Proper | −9.3% | −35% | No (N 124%, P 161% of MAI) |
Gulf of Finland | No significant change | −48% | No (N 123%, P 135% of MAI) |
Gulf of Riga | No significant change | −33% | No for N; P uncertain |
Danish Straits | −23% | −22% | Yes |
Kattegat | −28% | −20% | Yes |
Whole Baltic Sea | −11% | −33% | No (N 111%, P 117% of MAI) |
Sources: HELCOM, “Inputs of nutrients to the sub-basins” core indicator (2025), normalised inputs.
The Baltic countries began cooperating early. The Helsinki Convention on protecting the Baltic marine environment was first signed in 1974 by all the coastal states, and HELCOM was set up to carry it out. In 2007 the member states adopted the Baltic Sea Action Plan, which divided the agreed nutrient cuts among the countries; the plan and its nutrient reduction scheme were revised in 2013 and 2021.
Level | Measures in the Baltic | Who acts |
|---|---|---|
1: Change the activity | Phosphate-free detergents; lower and better-timed fertiliser use; reduced livestock density in some areas; cleaner energy and shipping to cut nitrogen oxides | Farmers, consumers, national governments, the EU |
2: Control the release | New and upgraded sewage works with phosphorus and nitrogen removal, especially in Poland, the Baltic states and around St Petersburg; rules on manure storage and spreading; buffer zones and wetlands to trap run-off | Cities, water companies, international lenders, farmers |
3: Remove and restore | Experiments with pumping oxygen into deep basins and binding phosphate in sediments; restoring coastal wetlands; fishing bans to protect cod | Researchers, governments, the EU |
Most of the progress so far has come from level 2 action at point sources, which is the easiest to target. Cutting diffuse agricultural losses has proved much harder, because it requires changes on many thousands of farms in several countries with different farming systems and incomes. An international committee concluded that large-scale engineering cannot re-oxygenate the dead zones without disrupting the ecosystem, so cutting nutrient inputs remains the main long-term strategy.
Signs of success. Phosphorus inputs have fallen by a third, and the northern basins, Danish straits and Kattegat now meet both limits. HELCOM is often cited as a model of regional cooperation, involving EU members and Russia for most of its history.
Signs of failure. The sea as a whole still exceeds both limits; the oxygen debt in the deep Baltic Proper has continued to increase since the 1990s; cyanobacteria blooms recur each summer; and the eastern cod stock has collapsed.
Time lags. Phosphorus stored in sediments and the slow renewal of the water mean the sea may take decades to respond even when inputs fall, so short-term evaluation can understate success.
Climate change. Warmer water holds less oxygen, speeds up decomposition, lengthens the bloom season and probably strengthens stratification, all of which work against nutrient cuts.
Perspectives differ. Nordic governments, whose waters improved first, argue for faster action by countries with larger agricultural loads. Farmers in Poland and the Baltic states argue that their fertiliser use per hectare has historically been lower than in western Europe and that cuts threaten rural incomes. Fishers have lost a livelihood; coastal tourism suffers from summer scums. An ecocentric view would stress reducing the scale of intensive livestock farming, a technocentric view would favour precision agriculture and engineering of the deep basins, and an anthropocentric view would weigh the cost of measures against the value of restored fisheries and recreation.
The Baltic Sea shows every stage of eutrophication: nutrient inputs from several sources, algal blooms, decomposition, hypoxia and the death of oxygen-dependent life, with a positive feedback from sediment phosphorus that makes the system slow to recover. It shows how eutrophication destroys ecosystem services, from the cod fishery to beach tourism. It also shows the three-level model in practice. Level 2 controls on point sources have worked best and fastest, while the diffuse farm run-off that remains can be reduced only by level 1 changes in how food is produced, and level 3 engineering cannot replace prevention.
Sources: HELCOM indicators “Inputs of nutrients” and “Oxygen” (2025); HELCOM nutrient reduction scheme (2025); Wikipedia, “Baltic Sea hypoxia” and “Atlantic cod” (2026).
Water pollutants differ in how they cause harm, how long they last and how far they travel. Grouping them by type helps to predict their effects and to choose the right management.
Type of pollutant | Examples | How it causes harm |
|---|---|---|
Organic matter | Sewage, manure, food and paper-mill waste | Decomposition uses dissolved oxygen (high BOD), causing hypoxia |
Dissolved substances | Nitrate, phosphate, heavy metals, tributyltin, pharmaceuticals | Eutrophication; direct toxicity; disruption of hormones |
Persistent biomagnified chemicals | PCBs, DDT, methylmercury | Build up in fatty tissue and become more concentrated up food chains |
Plastics | Bags, bottles, fishing gear, microplastics | Entanglement, ingestion, transport of toxins |
Heat energy | Cooling water from power stations and factories | Lowers oxygen solubility; raises metabolic rates; thermal shock |
An endocrine disruptor is a chemical that interferes with the hormone (endocrine) system of animals, even at very low concentrations. Because hormones control growth, development and reproduction, endocrine disruptors can damage populations without killing individuals outright.
Tributyltin (TBT) is a compound of tin that was used for about 40 years in anti-fouling paints on ship hulls, to stop barnacles and algae growing on them. It leached slowly from the paint into the water, especially in harbours and marinas. In the dog whelk (Nucella lapillus), a small marine snail, TBT causes imposex: females develop male sex organs, which can block egg release and make them sterile. Dog whelk populations declined near ports, and the species became a widely used indicator of TBT contamination.
TBT binds to sediments, where it can persist and be released for up to 30 years, even though it breaks down within a week or two in open seawater. The International Maritime Organization’s International Convention on the Control of Harmful Anti-fouling Systems on Ships led to a worldwide ban on applying organotin paints from 2003, with a full ban in force from 2008. This is a level 1 strategy, replacing a harmful product, combined with international law.
Sources: Wikipedia, “Tributyltin” (2026).
Polychlorinated biphenyls (PCBs) were valued for their stability and used as insulating fluids in electrical transformers and capacitors, and in paints, sealants and carbonless copy paper. That same stability makes them persistent organic pollutants: they break down extremely slowly, dissolve in fat rather than water, and bind to organic matter in mud. Once in a river or sea, they settle into the sediment and are released slowly for decades, so they keep entering food chains long after the original discharge has stopped.
PCB production was banned in the United States in the late 1970s and worldwide under the Stockholm Convention, adopted in 2001, yet PCBs still leak from old transformers, building sealants and landfills, and from contaminated sediments. On the Hudson River in New York State, discharges from General Electric factories contaminated about 200 miles (320 km) of river, which became a Superfund site; the company was ordered to dredge millions of cubic metres of mud. Because the pollutant is already spread through the sediment, level 3 clean-up is slow, costly and stirs up some of the PCBs it is meant to remove, which is why level 1 bans matter most.
Their persistence is also why PCB levels in some European orcas remain high decades after the bans. Methylmercury, which poisoned the people of Minamata in Japan, is another persistent pollutant of this kind.
Sources: Wikipedia, “Polychlorinated biphenyl” and “Hudson River” (2026).
Thermal pollution is the degradation of water quality by a change in its temperature, usually a rise caused by the release of cooling water. Power stations and many industries take water from rivers, lakes or the sea to cool their equipment and return it several degrees warmer. In the United States, power stations produce about 75–80% of thermal pollution. Run-off from hot roads and roofs and the release of cold water from the bottom of reservoirs also change river temperatures.
Warm water holds less dissolved oxygen, while higher temperatures raise the metabolic rates of fish and invertebrates, so they need more oxygen just when less is available.
Sudden changes in temperature, for example when a plant starts up or shuts down, can kill organisms adapted to a narrow range (thermal shock).
Warm-water and invasive species can replace native ones, and warmer water favours algal blooms.
Management at level 2 uses cooling towers and cooling ponds, which release the heat to the air before the water is returned, and closed-loop systems that reuse cooling water. Level 1 options include using waste heat for district heating (cogeneration) or switching to energy sources that need less cooling water, such as wind and solar power.
Sources: Wikipedia, “Thermal pollution” (2026).
Most algal blooms harm ecosystems indirectly, by causing oxygen depletion when they die. A harmful algal bloom (HAB) is one that also harms people or animals directly, usually because the organisms produce toxins, or because they grow so densely that they clog the gills of fish. HABs can be formed by cyanobacteria, by single-celled protists such as dinoflagellates and diatoms, and by some algae. Only a small number of species produce potentially fatal toxins, but their blooms can be very large.
Toxins move through food webs and water supplies. Shellfish filter large volumes of water and concentrate toxins without being harmed themselves, so people who eat them can be poisoned. Animals drinking from the shores of lakes, including dogs and cattle, are also at risk. Nutrient enrichment, warm water and calm conditions all favour HABs, so they have become more frequent where eutrophication and warming occur together.
Cyanobacteria are photosynthetic bacteria, often called blue-green algae, that dominate many freshwater HABs. Several species produce cyanotoxins. The most common are microcystins, made mainly by Microcystis aeruginosa, which damage the liver and cause vomiting, diarrhoea and abdominal pain if swallowed.
Lake Erie, shared by the United States and Canada, is the shallowest of the Great Lakes, and its western basin averages only about 7.6–9.1 m deep. After phosphate controls under the 1972 Great Lakes Water Quality Agreement, the lake recovered, but blooms of Microcystis returned from the mid-1990s, fed mainly by phosphorus from farmland draining through the Maumee River. In August 2014 microcystin from a bloom near the water intake of Toledo, Ohio, led the city to advise about 500,000 people not to use their tap water for drinking or cooking.
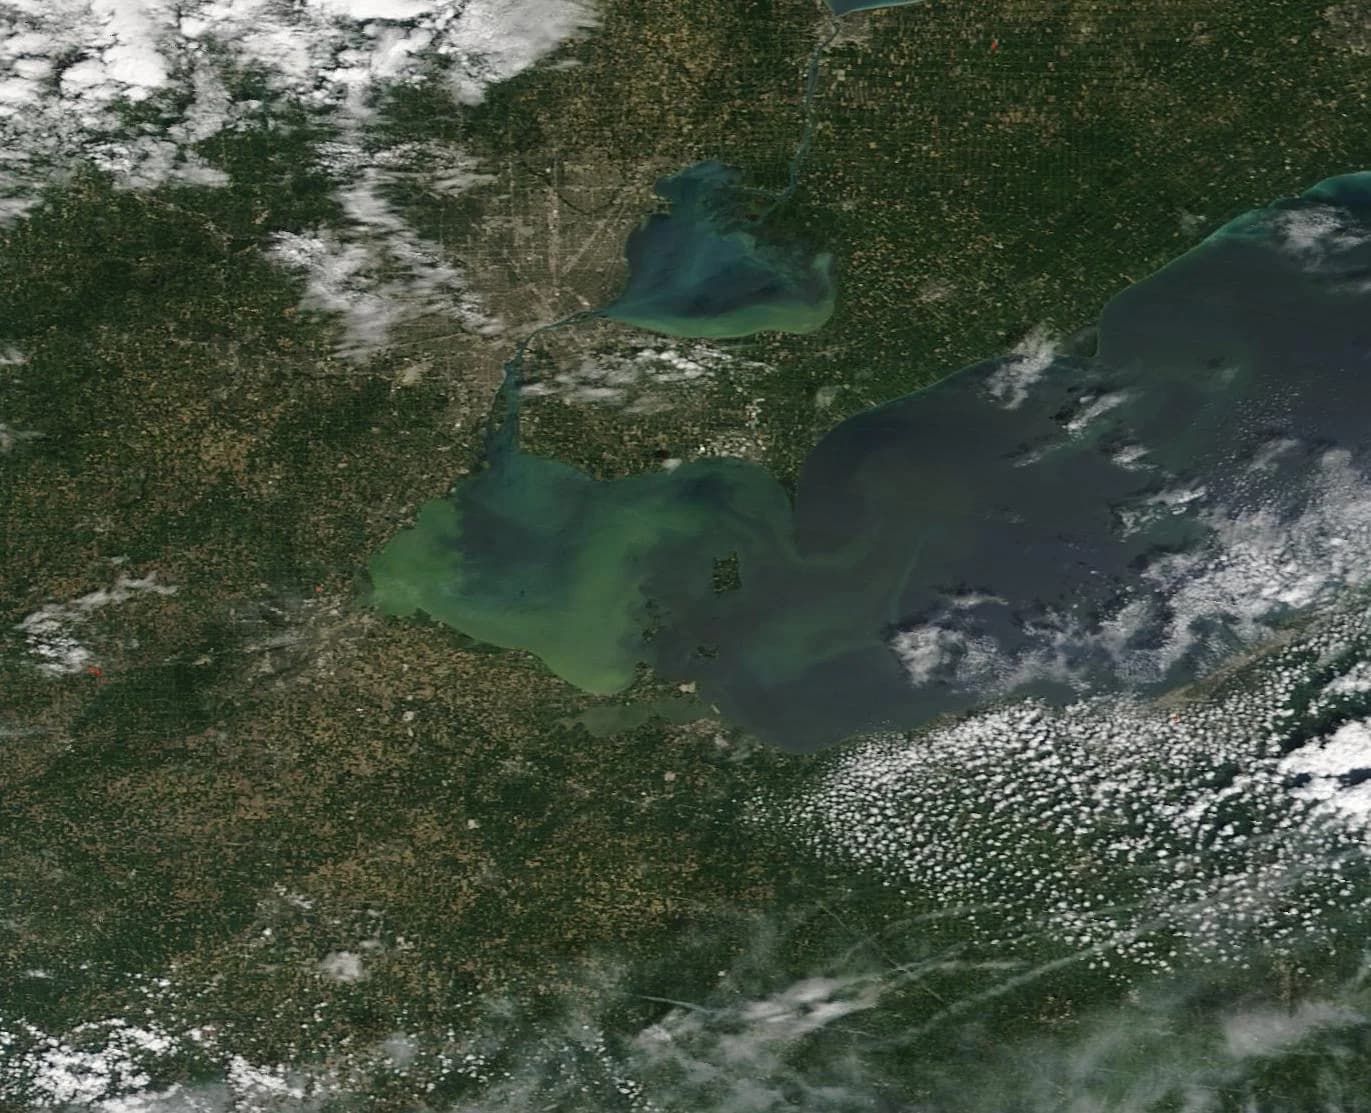
Sources: Wikipedia, “Lake Erie” and “Microcystin” (2026).
In coastal seas, many HABs are formed by dinoflagellates, single-celled protists with two flagella. Some produce powerful neurotoxins. When their density is very high they can discolour the water reddish-brown, which is why these blooms are often called red tides, although not all red tides are toxic and not all toxic blooms are red.
Off the west coast of Florida, red tides are caused by Karenia brevis, which produces brevetoxins. These kill fish, accumulate in shellfish and cause neurotoxic shellfish poisoning in people, and when waves break the cells, the toxins become airborne and irritate the eyes and lungs of people on the beach.
A red tide that began in October 2017 was Florida’s longest in more than a decade, lasting into early 2019. It was linked to a record 589 sea turtle deaths, 213 manatee deaths and 127 dolphin strandings, as well as massive fish kills, and it hit coastal tourism hard. Blooms of K. brevis form offshore naturally, but scientists suspect that nutrients from coastal run-off and rivers can feed and prolong them once they reach the coast.
Sources: Wikipedia, “Karenia brevis” (2026); Florida Fish and Wildlife Conservation Commission figures reported by EcoWatch (2019).
A dead zone is an area of water, usually in the deeper layers of a coastal sea or large lake, where dissolved oxygen is so low that most fish and bottom-living animals die or leave. Hypoxia is usually defined as 2 mg L⁻¹ of oxygen or less; below about 0.5 mg L⁻¹, mass mortality occurs. Mobile animals such as fish swim away if they can, while shellfish, worms and other bottom-living animals die.
The number of known dead zones grew from 146 in a 2004 United Nations Environment Programme report to 405 in a 2008 study. Some of this increase reflects better monitoring, but most coastal dead zones are linked to rising nutrient inputs from agriculture and sewage.
Dead zones form where four factors combine, and each of them is increasing:
Eutrophication. Nutrients from fertilisers, manure and the air feed blooms whose decomposition consumes oxygen. Global fertiliser use and livestock numbers continue to rise.
Sewage disposal. Untreated or partly treated sewage adds both organic matter (raising BOD directly) and nutrients. Fast-growing coastal cities often lack treatment.
Stratification. When water forms layers of different temperature or salinity, a thermocline or halocline stops oxygen-rich surface water from mixing down into the bottom layer. Fresh water from rivers floating on salt water strengthens stratification.
Global warming. Warmer water holds less oxygen, decomposers work faster, surface water is warmed more than deep water so stratification lasts longer, and the bloom season is extended.
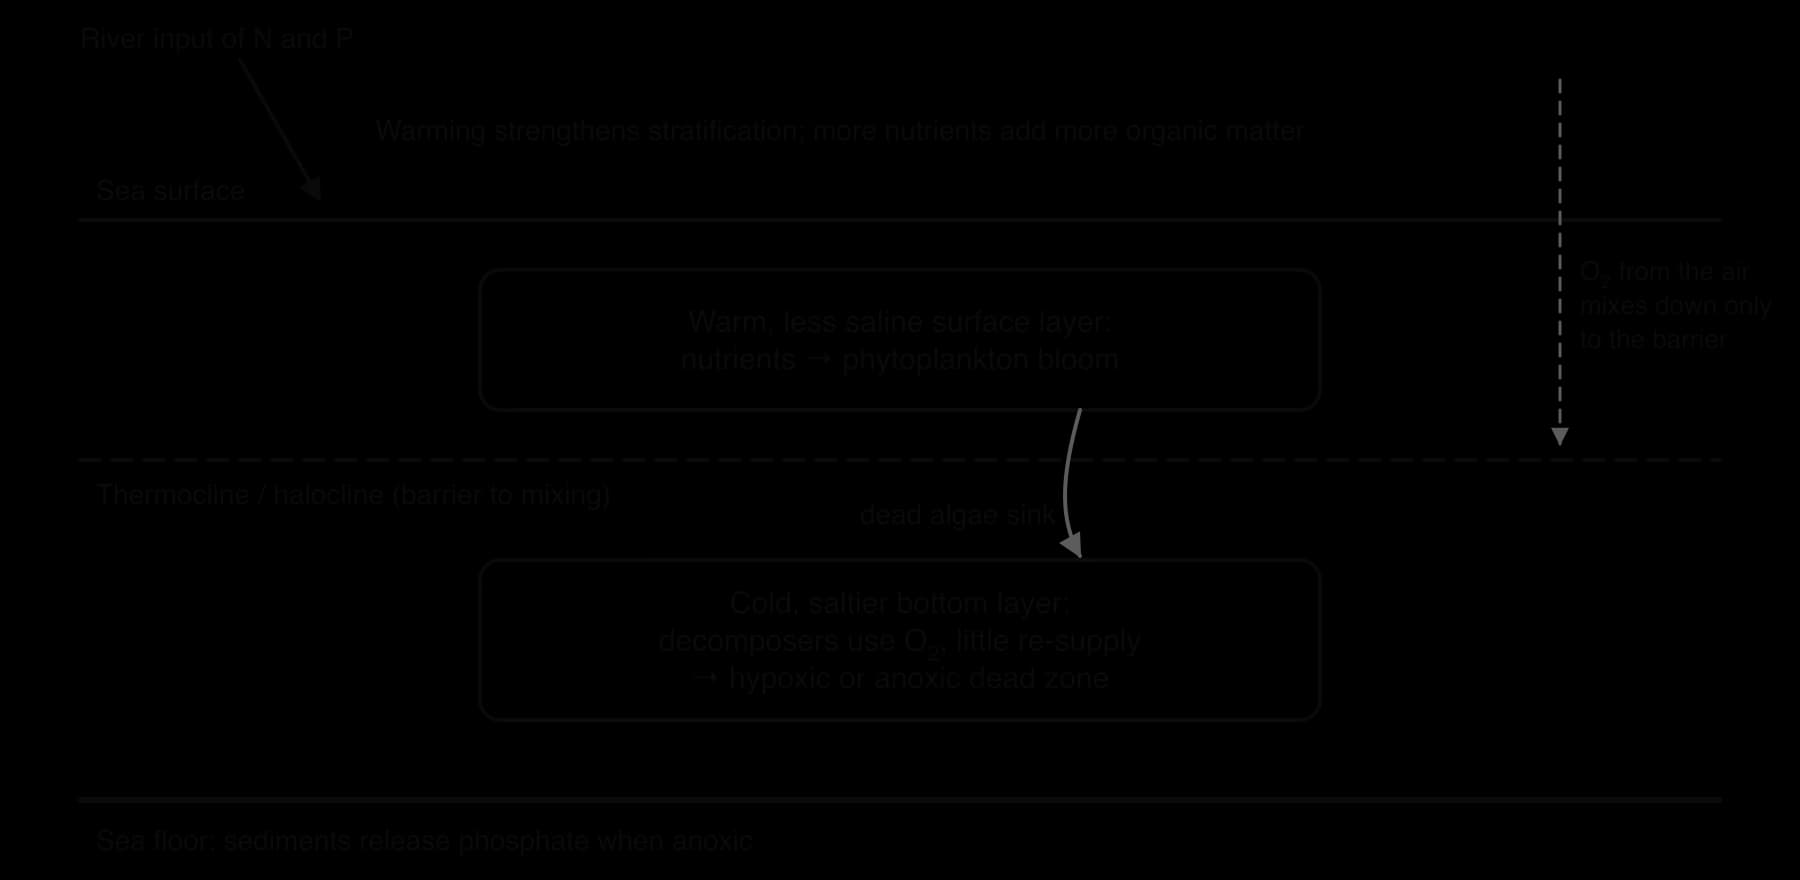
These factors reinforce one another, which is why dead zones link water pollution to climate change. A warmer, more stratified sea responds more strongly to the same nutrient load, so meeting nutrient targets becomes harder as the climate warms.
Every summer, a dead zone forms on the continental shelf off Louisiana and Texas. The Mississippi–Atchafalaya river system drains about 40% of the land area of the contiguous United States, including the farmland of the Corn Belt, and delivers large loads of nitrate to the Gulf. Fresh river water floats over the salty Gulf water, and blooms fed by the nitrate sink and decompose in the bottom layer.
The dead zone has been mapped every summer since 1985. Its record size was about 22,730 km² in 2017; the smallest, about 39 km², was in 1988, a drought year when the river carried little water and few nutrients. In 2025 it measured about 11,400 km² (4,402 square miles), and its five-year average was about 12,300 km² (4,755 square miles). A federal and state task force aims to cut the five-year average to below about 4,900 km² (1,900 square miles) by 2035, but progress has been slow because most of the nitrate comes from diffuse farm run-off across many states.
Sources: NOAA and LUMCON 2025 hypoxia survey, via gulfhypoxia.net (2025); Wikipedia, “Dead zone (ecology)” (2026).
Sewage treatment removes solids, organic matter, nutrients and pathogens from wastewater so that the effluent can be released safely into rivers or the sea. It is the main level 2 strategy for both organic pollution and eutrophication. Each of its three stages removes a different kind of pollutant, so the quality of the effluent depends on how many stages a works has.
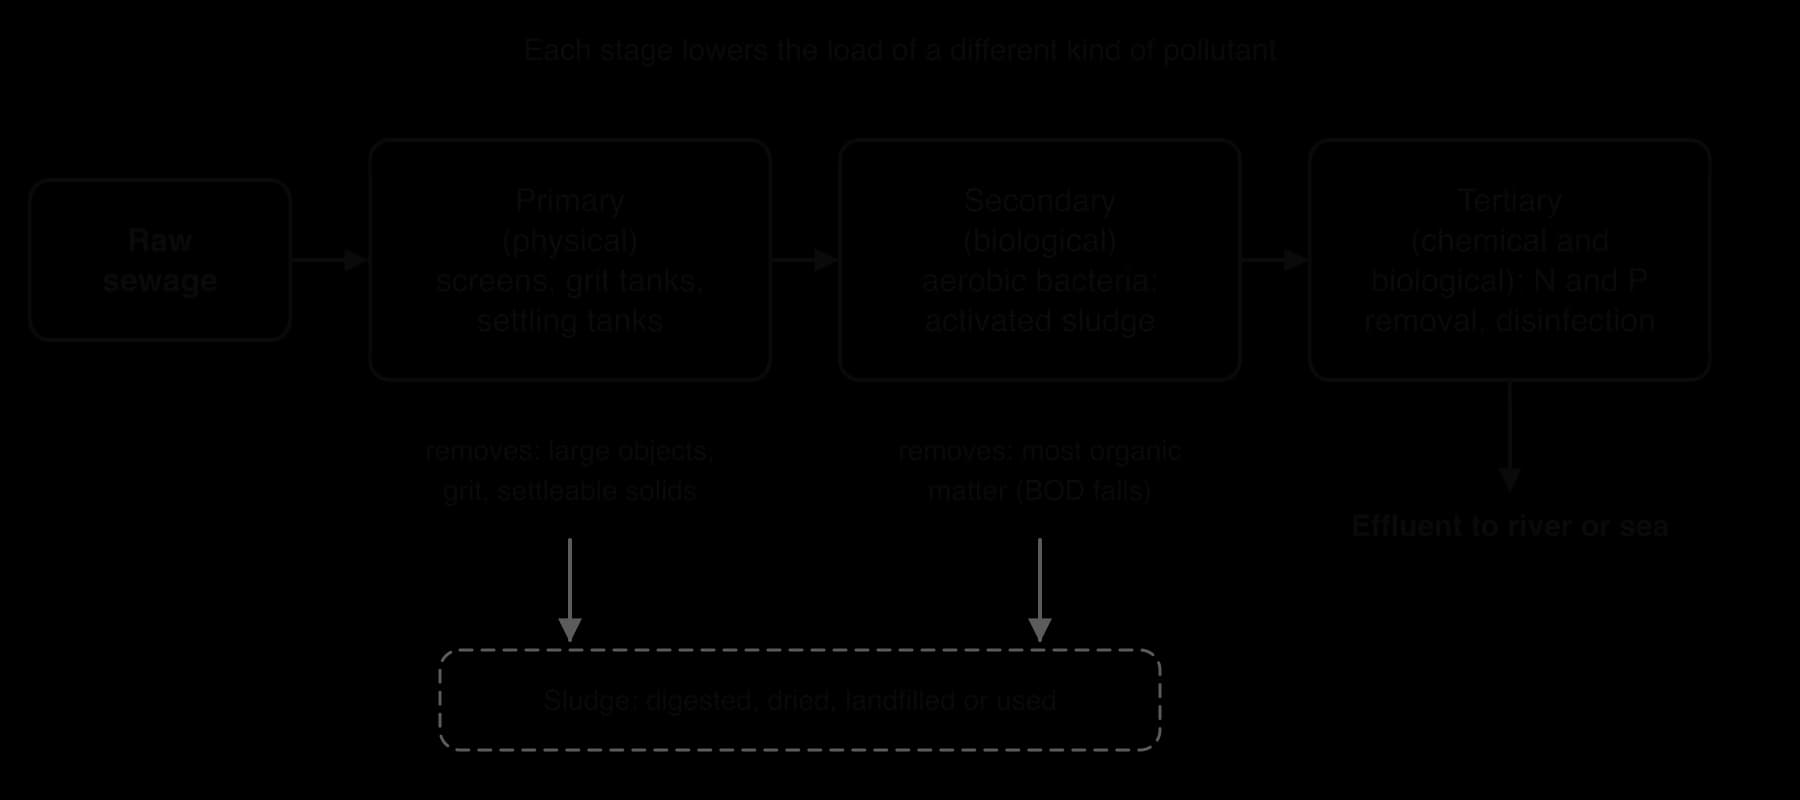
Primary treatment is physical. Screens remove large objects such as rags, plastics and sticks; grit channels let sand and gravel settle; and large settling tanks hold the sewage still for several hours, so that suspended solids sink as sludge and grease floats to the surface to be skimmed off. Primary treatment removes a large share of the suspended solids and some of the BOD, but dissolved organic matter, nutrients and most pathogens pass through.
Secondary treatment is biological. The liquid from primary treatment is mixed with large populations of aerobic bacteria and protists, which use the dissolved organic matter as food and respire it to carbon dioxide and water. In the activated sludge process, air is bubbled through tanks to supply the oxygen the microorganisms need; in trickling filters, sewage is sprayed over beds of stones coated with a film of microorganisms. The microorganisms are then settled out, and some are returned to the tanks to keep the process going. Secondary treatment removes most of the remaining organic matter, so it greatly lowers the BOD.
Tertiary treatment is chemical and biological. Phosphate is removed by adding iron or aluminium salts, which react with it to form solids that settle out, or by bacteria that store phosphate in their cells. Nitrate is removed by denitrification, in which bacteria in oxygen-free tanks convert it to nitrogen gas. Finally, the effluent may be disinfected with ultraviolet light, chlorine or ozone to kill pathogens, and in some places filtered further so that it can be reused.
The sludge removed in the first two stages is itself a large waste stream. It is usually digested by anaerobic bacteria, which produce methane that can be burned to generate energy, and then dried and spread on farmland, burned or landfilled. Sludge from areas with industrial waste can contain heavy metals, which limits its use as fertiliser.
 YouTube
In 2024, about 56% of the world’s household wastewater was safely treated. The share varies enormously between regions, and most untreated sewage is released in places where people have the least capacity to deal with its effects.
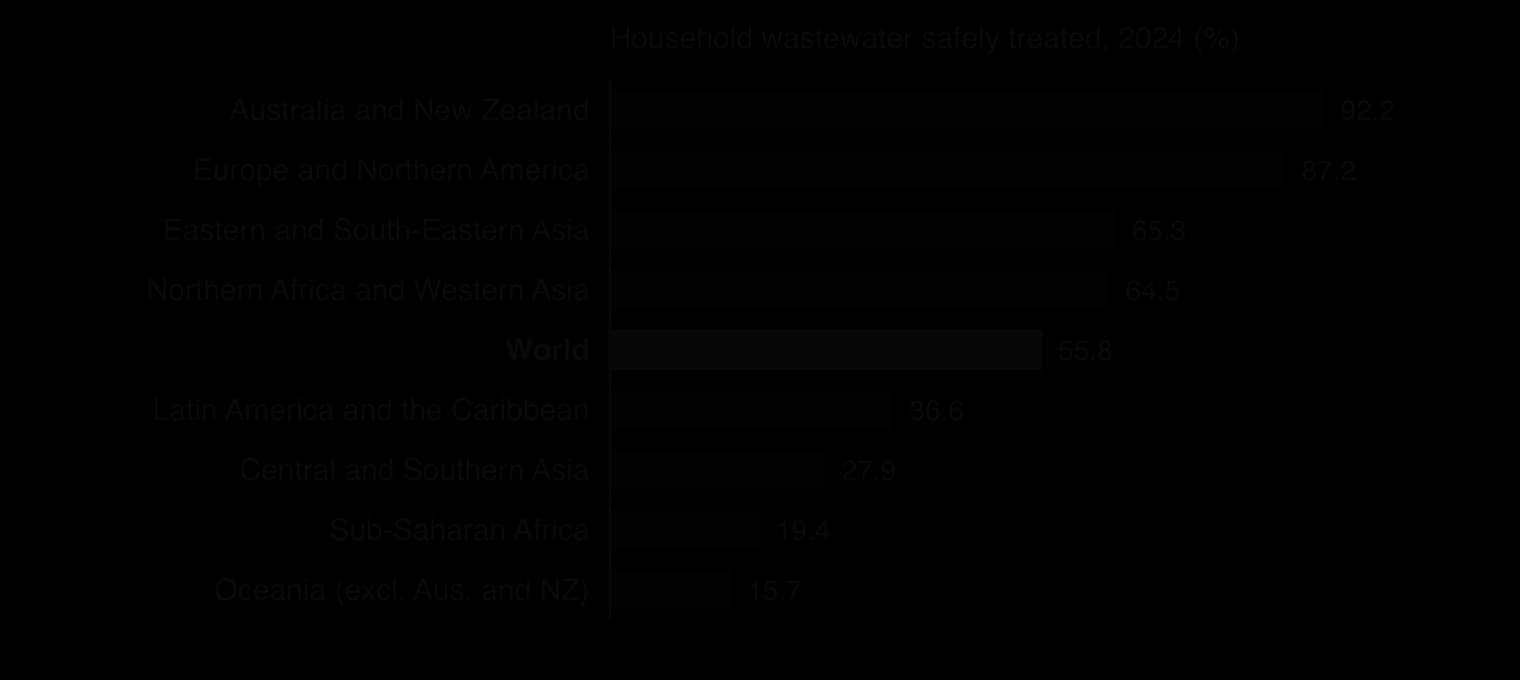
Sources: UN-Water SDG 6 data portal, indicator 6.3.1 (2025).
Several obstacles make equitable treatment hard to achieve:
Cost. Sewers and treatment works are expensive to build, and tertiary treatment is costly to run because it uses chemicals and energy. Poorer cities cannot easily raise the money through water charges.
Rapid urban growth. Informal settlements often grow faster than sewer networks and have no legal connection to them; many households use pit latrines or septic tanks.
Energy and skills. Aeration and pumping need a reliable electricity supply, and plants need trained staff and spare parts. Many plants built with aid money have stopped working for lack of maintenance.
Who benefits. The benefits of treatment are felt downstream, while the costs fall on the city that builds the plant, which reduces the incentive to pay.
Lower-cost options include constructed wetlands and waste stabilisation ponds, which use natural processes and sunlight, and decentralised systems for individual neighbourhoods. Sustainable Development Goal 6 aims to halve the proportion of untreated wastewater by 2030, which links sewage treatment directly to environmental justice and to the right to health.
Chemical tests give a snapshot of water quality at the moment of sampling, and they detect only the substances that are tested for. A pollution incident that passed a week earlier, or a pollutant nobody thought to measure, can be missed entirely. The animals living in a stream, by contrast, have been exposed to its water for weeks or months, so the community present reflects the conditions over that whole period.
Freshwater invertebrates large enough to be seen without a microscope (macroinvertebrates) are especially useful, because they are common, easy to sample with a net, live in one place for most of their lives and differ greatly in their tolerance of low oxygen.
Group | Examples | Why |
|---|---|---|
Intolerant of pollution (indicate clean water) | Stonefly nymphs, mayfly nymphs, many caddisfly larvae | Need high dissolved oxygen; take oxygen in through gills or the body surface; often live in fast, cool, well-oxygenated riffles |
Moderately tolerant | Freshwater shrimp (Gammarus), water hoglouse (Asellus) | Survive moderate organic pollution and somewhat reduced oxygen |
Tolerant of pollution (indicate polluted water) | Tubifex sludge worms, red chironomid larvae (bloodworms), rat-tailed maggots | Haemoglobin stores oxygen (sludge worms, bloodworms) or a breathing tube reaches the surface air (rat-tailed maggot); thrive in organic mud with little competition |
The presence of an intolerant species is strong evidence of clean water, because it could not survive otherwise. The presence of a tolerant species on its own says less, because tolerant species can also live in clean water; what indicates pollution is their abundance together with the absence of intolerant species. Lichens on trees play the same role for air pollution.
A biotic index turns a sample of organisms into a single number that indicates water quality. It combines the pollution tolerance of the organisms found, their diversity (how many different groups are present) and, in some indices, their relative abundance.
The Trent biotic index was published by F. S. Woodiwiss in 1964 for the rivers of the Trent River Authority in the English Midlands. Invertebrates are collected by kick sampling and sorted into groups. The index then uses two pieces of information: the most pollution-sensitive key group present (from stonefly nymphs down to sludge worms) and the total number of groups found. Scores run from 10 (very clean) to 0 (grossly polluted).
Key organisms present (most sensitive first) | 0–1 groups | 2–5 groups | 6–10 groups | 11–15 groups | 16+ groups |
|---|---|---|---|---|---|
Stonefly nymphs: more than one species | – | 7 | 8 | 9 | 10 |
Stonefly nymphs: one species | – | 6 | 7 | 8 | 9 |
Mayfly nymphs: more than one species | – | 6 | 7 | 8 | 9 |
Mayfly nymphs: one species | – | 5 | 6 | 7 | 8 |
Caddisfly larvae: more than one species | – | 5 | 6 | 7 | 8 |
Caddisfly larvae: one species | 4 | 4 | 5 | 6 | 7 |
Gammarus (all the above absent) | 3 | 4 | 5 | 6 | 7 |
Asellus (all the above absent) | 2 | 3 | 4 | 5 | 6 |
Sludge worms and/or red chironomid larvae (all the above absent) | 1 | 2 | 3 | 4 | – |
None of the above; only organisms not needing dissolved oxygen, such as rat-tailed maggots | 0 | 1 | 2 | – | – |
In the original table, the mayfly nymph Baetis rhodani, which tolerates more pollution than other mayflies, is not counted in the mayfly rows; it is counted with the caddisfly larvae.
Sources: Woodiwiss (1964), as reproduced in Birk, “Biomonitoring and Bioassessment”, in _Riverine Ecosystem Management (Springer, 2018), Table 19.1._
Biotic indices are cheap, need little equipment and integrate conditions over time, and the organisms used are widespread. Their limitations are that identification takes skill, results depend on the habitat sampled (a riffle has different animals from a pool, whatever the water quality), they show that a problem exists without identifying which pollutant causes it, and the Trent index was designed for organic pollution in English rivers, so it is less reliable for toxic pollutants or other regions. Reviews have also found it insensitive to mild and moderate pollution. In practice, biotic indices are used alongside chemical tests rather than instead of them.
A water quality index (WQI) combines the results of several physical, chemical and biological tests into a single number. Each test result is first converted into a quality value (Q-value) on a scale of 0 to 100, using a published curve for that test; for example, dissolved oxygen close to 100% saturation gets a high Q-value, while very high or very low pH gets a low one. Each Q-value is then multiplied by a weighting factor that reflects how important that test is to overall water quality, and the weighted values are added together.
Vernier’s water quality index, used widely in schools, is based on the nine-test index devised by the US National Sanitation Foundation in 1970: dissolved oxygen, faecal coliform bacteria, pH, BOD, temperature change, total phosphate, nitrate, turbidity and total solids. A simplified four-test version is used where only basic probes are available. The closer the total is to 100, the better the water quality.
A WQI is easy to communicate and allows sites and years to be compared on one scale. Its weaknesses come from the same simplification. Averaging can hide one serious problem behind several good results, the choice of tests and weights reflects judgements about what matters, and a single sample taken just after heavy rain may not represent normal conditions, so indices are best interpreted alongside historical data.
The World Health Organization (WHO) publishes the Guidelines for Drinking-water Quality, which give guideline values for microbes, chemicals and radioactive substances. Examples include 50 mg L⁻¹ for nitrate, 10 µg L⁻¹ for lead and 1.5 mg L⁻¹ for fluoride. The guideline for arsenic is 10 µg L⁻¹, set as provisional because arsenic is hard to remove; an estimated 140 million people in at least 70 countries drink water above this level, mostly from naturally contaminated groundwater.
The WHO guidelines are not law in themselves. They are intended as the basis for national regulation, and where a value is hard to meet, countries may set higher interim limits while they work towards it. National or local governments turn them into statutory standards, which are legally binding: water suppliers must test regularly, report results and treat water that fails. Standards for effluent set the maximum concentrations of pollutants that a factory or sewage works may discharge, and permits are issued on that basis.
Feature | WHO guideline values | Statutory national standards |
|---|---|---|
Who sets them | An international health agency | National or local governments |
Legal force | Advisory; a basis for regulation | Binding; can be enforced with fines and closure |
Flexibility | Same science-based values worldwide | Adapted to local conditions, costs and priorities; may be stricter or weaker |
Limitation | Cannot be enforced | Only as strong as monitoring and enforcement |
Before a major project such as a factory, mine or bottling plant is approved, an environmental impact assessment (EIA) predicts its effects on water quality, including how much water it will withdraw and what it will discharge. Water standards provide the benchmarks against which those effects are judged, and permits can require monitoring after the project opens. International investors and multinational companies may also commit to standards in contracts and business agreements, sometimes stricter than local law.
These commitments matter most where local regulation is weak. At Plachimada in the Palakkad district of Kerala, India, a Coca-Cola bottling plant began operating in 2000 and used about 500,000 litres of groundwater a day. About six months after it opened, villagers reported that their wells were polluted. The company gave sludge from the plant to farmers as free fertiliser, and laboratory tests on samples collected by a BBC journalist found high levels of cadmium and lead.
Mostly Adivasi (Indigenous) villagers began a blockade of the factory in April 2002, the local village council (panchayat) revoked the plant’s licence in 2003, and the factory was shut in March 2004. A committee set up by the state government later estimated the damage at ₹216 crore (about US$28 million), but no compensation had been paid by 2018.
Sources: Wikipedia, “Plachimada Coca-Cola struggle” (2026); WHO arsenic fact sheet and Wikipedia, “Guidelines for Drinking-water Quality” (2026).
The case raises the questions that run through the HL lenses: whether the law protected local people (environmental law), who should pay for the damage under the polluter pays principle (environmental economics), and whether a company has a duty to communities beyond what the law requires (environmental ethics).
Governments and companies are not the only actors. Individuals and citizen groups influence water pollution in several ways:
Changing consumption and waste disposal. Choosing phosphate-free detergents, using less fertiliser on gardens, keeping fats, wipes and medicines out of drains, and buying food from lower-input farms all reduce pollution at level 1.
Peaceful protest. Blockades, marches and media campaigns draw attention to polluters, as at Plachimada.
Data collection and research. Citizen science volunteers monitor rivers with test kits, Secchi discs and invertebrate surveys, producing data where official monitoring is thin and providing evidence for complaints.
Legal action. Citizen groups form legal teams and take governments or companies to court for failing to enforce or obey the law.
Lobbying lawmakers. Petitions, campaigns and meetings with politicians push for stronger laws and funding.
The River Wye, which flows from Wales into England and forms part of the border between them, shows several of these at once. The growth of intensive poultry farming in its catchment (more than 110 registered poultry units in Powys alone by 2020, each with over 40,000 birds) has been linked to excess phosphate from manure; one study found that 60–70% of the phosphate in the river comes from agriculture. Algal blooms now occur several times a year. In March 2023 the charity River Action brought a High Court claim against the Environment Agency for failing to act on agricultural pollution in the Wye.
Sources: Wikipedia, “River Wye” (2026).
Citizen action has clear strengths: it is local, cheap, can move faster than governments and gives people a sense of agency. Its limits are also real. Volunteer data can be less precise than laboratory data unless methods are standardised; legal action is slow and expensive; and consumer choices cannot by themselves change how whole catchments are farmed. Citizen action works best when it feeds evidence and pressure into the formal systems of law and regulation.
Water pollution appears in every part of the assessment. Paper 1 often gives data from an unfamiliar lake, river or coast and asks you to calculate, interpret and evaluate; Paper 2 Section A asks short questions on definitions, BOD, eutrophication and management; Section B essays ask you to evaluate management strategies with named examples and perspectives. HL questions can draw on sewage treatment, indicator species, indices, dead zones, standards and the HL lenses.
Calculation questions award a mark for the answer with its unit; “explain” parts need a chain of cause and effect.
HL short-answer items often test the processes behind a management method.
Resource (hypothetical data). A lake in a farming area was monitored each August. The management measures introduced after 2010 are shown in the Notes column.
Year | Total phosphate (µg L⁻¹) | Secchi depth (m) | Bottom-water DO (mg L⁻¹) | Notes |
|---|---|---|---|---|
2006 | 22 | 3.1 | 6.8 | |
2010 | 61 | 1.2 | 1.9 | Fish kill reported |
2014 | 48 | 1.5 | 2.4 | Phosphate detergents banned in 2012 |
2018 | 35 | 2.0 | 3.9 | Sewage works upgraded with phosphate removal in 2016 |
Water pollution is the addition of substances or energy faster than water bodies can make them harmless; sources are sewage, agricultural run-off, industrial effluent, urban run-off, solid waste and oil spills.
Point sources release pollution from one identifiable place and are easier to control than diffuse non-point sources such as farm run-off.
Plastics accumulate in oceanic gyres and fragment into microplastics, which carry adsorbed toxins into food chains; prevention must accompany clean-up.
Water quality is measured through DO, pH, temperature, turbidity (Secchi disc), nutrients, metals and suspended solids; monitoring guides management.
BOD is the oxygen used by decomposers in five days at 20 °C, an indirect measure of organic pollution; DO sags below an organic outfall and recovers downstream.
Eutrophication follows nutrient enrichment: algal bloom, death, decomposition, hypoxia or anoxia and death of aquatic life, with positive feedback from released nutrients.
Eutrophication damages fisheries, drinking water, recreation, aesthetics and health.
The three-level model manages pollution by changing the activity, controlling release, or cleaning up and restoring; earlier levels prevent more damage.
Pollutants include organic matter, endocrine disruptors such as TBT, persistent PCBs, plastics and heat; toxic HABs and dead zones are spreading with warming and stratification. (HL)
Sewage is treated in primary (physical), secondary (biological) and tertiary (chemical and biological) stages, but treatment remains unequal worldwide. (HL)
Indicator species, biotic indices such as the Trent index, and weighted WQIs assess water quality; WHO guidelines, statutory standards and citizen action help control pollution. (HL)
I can outline the main sources of water pollution and distinguish point from non-point sources.
I can describe a detailed example of water pollution, including its sources, impacts and management.
I can explain how plastics accumulate in gyres and how microplastics carry toxins into food chains.
I can describe how key water quality parameters are measured, including with a Secchi disc.
I can define BOD, calculate it and sketch an oxygen sag curve.
I can explain the sequence of eutrophication and draw a systems diagram with its positive feedback loop.
I can discuss how eutrophication affects ecosystem services.
I can evaluate pollution management using the three-level model, with examples.
I can outline a range of pollutants, toxic algal blooms and the causes of dead zones. (HL)
I can outline the three stages of sewage treatment and the challenges of equitable treatment. (HL)
I can calculate a Trent biotic index and a WQI and interpret them. (HL)
I can evaluate the roles of standards and citizen action in reducing water pollution. (HL)