4.6 Balance of payments · IB Economics | Augment Education
4.6 Balance of payments
Explain how the balance of payments records a country’s transactions with the world, calculate its accounts, and (HL) analyse links to the exchange rate, persistent deficits and surpluses, and the J-curve.
IB Economics
Part of 4 The global economy
SL and HL
Key terms introduced here
Each is in the Economics glossary, with every other term in the subject.
A record of all economic transactions between the residents of a country and the rest of the world over a period of time, usually a year; it is made up of the current, capital and financial accounts.
The value of a country’s exports of services, such as tourism, transport, banking and insurance, minus the value of its imports of services over a period of time.
The part of the balance of payments that records capital transfers, such as debt forgiveness, and the buying and selling of non-produced, non-financial assets, such as brand names or land for embassies.
A transaction recorded with a plus sign in the balance of payments because it brings money into the country, such as export revenue or an inflow of foreign investment.
The part of the balance of payments that records trade in goods, trade in services, income flows and current transfers between a country’s residents and the rest of the world.
The situation where the debits on the current account (payments for imports, income paid abroad and transfers sent abroad) are greater than its credits over a period of time.
Define the balance of payments and distinguish between credit and debit items.
Describe the components of the current account, the capital account and the financial account.
Calculate the balance on each account, and missing items, from a set of balance of payments data.
Explain why the balance of payments always sums to zero, so that a deficit on one account is matched by surpluses on the others.
Explain, using an exchange rate diagram, the links between the current account, the financial account and the exchange rate (HL).
Evaluate the implications of a persistent current account deficit and of a persistent current account surplus (HL).
Evaluate expenditure-switching, expenditure-reducing and supply-side policies as ways to correct a persistent current account deficit (HL).
Explain the Marshall–Lerner condition and draw a J-curve to show the effect of a depreciation on the current account over time (HL).
Introduction
The balance of payments is the record of every economic transaction between a country’s residents and the rest of the world. It shows how a country earns foreign currency, how it spends it, and how it pays for any gap between the two, so it is one of the main measures of how an economy fits into the global economy.
The balance of payments is the clearest picture of interdependence: one country’s spending on imports is another country’s export revenue, and one country’s borrowing is another’s lending. Persistent imbalances also raise questions of sustainability, because a country can borrow from abroad only for as long as lenders are willing, and of intervention, when governments act to correct them.
Questions on 4.6
110 exam-style questions on this subtopic, written in the style of the IB papers. The first has its markscheme open. Counted on
Question 1 · ECON-0040540 marks
Read the extracts and answer the questions that follow.
Text A — Overview of Selvara
[1] Selvara is a low-income, landlocked economy in East Africa with a population of 38 million. About 60 % of workers are employed in agriculture, mostly on small family farms. Raw cotton lint is its largest export, followed by sesame seeds and livestock. Its currency is the Selvaran shilling (SVS).
[2] Real gross domestic product (GDP) growth slowed from 5.6 % in 2023 to 3.1 % in 2024, mainly because of lower cotton export earnings. Inflation rose sharply as the shilling depreciated and the prices of imported fuel and fertilizer increased, an example of cost-push inflation.
[3] Selvara's current account has been in deficit for many years (Table 2). The deficit is financed by foreign aid, loans and some foreign direct investment in telecommunications and banking. Remittances from Selvarans working abroad are an important source of income for rural households.
[4] Income inequality is rising. The Gini coefficient rose from 0.38 in 2014 to 0.44 in 2024, as incomes in the capital grew faster than incomes in rural areas.
Table 1: Selected economic data for Selvara, 2023–2024
Indicator
2023
2024
Real GDP growth (annual %)
5.6
3.1
Inflation (annual % change in consumer price index)
4.0
9.6
Unemployment (% of labour force)
7.2
7.9
Exchange rate (SVS per US$)
Try a quick-fire question
One of 65 short multiple-choice questions on 4.6. Pick an answer to see why it's right or wrong.
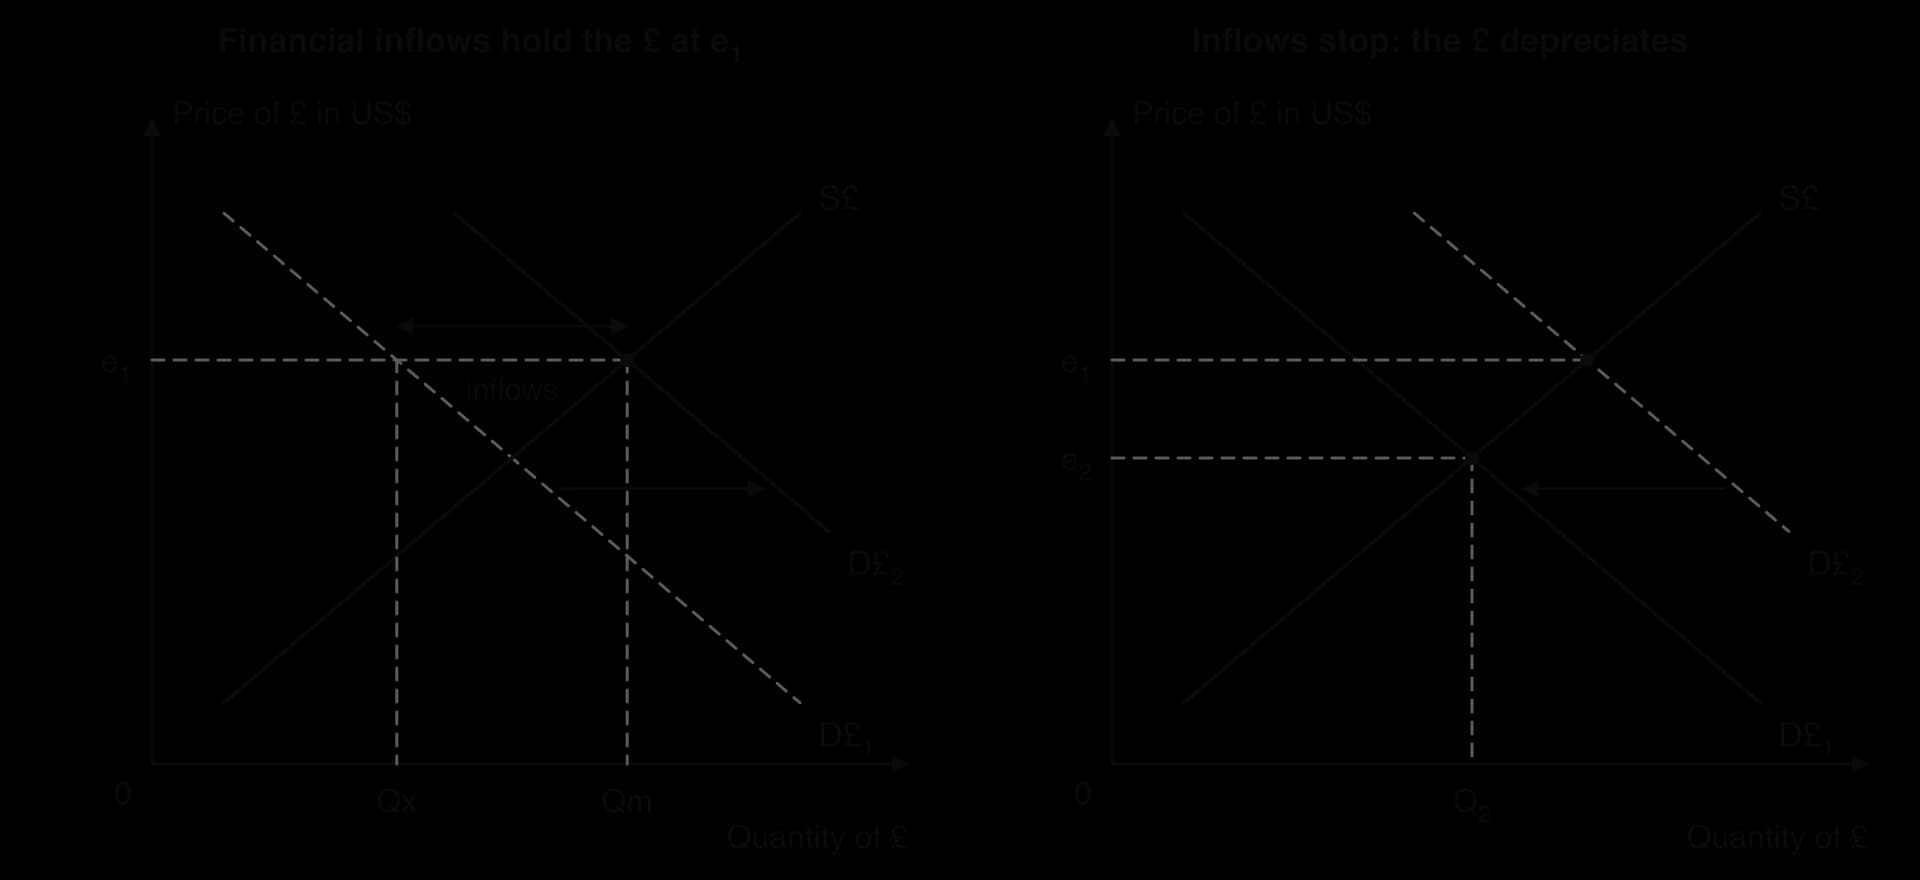
The diagram shows the market for pounds. D£₁ is demand from current account credits; financial inflows have shifted demand to D£₂ at e₁. Foreign investors suddenly stop buying UK assets. What happens to the pound?
Flashcards for 4.6
The official deck for this part of the syllabus.
4.6 Balance of payments · front
What is the balance of payments?
4.6 Balance of payments · front
Which term describes: a record of all economic transactions between the residents of a country and the rest of the world over a period of time?
4.6 Balance of payments265 cards
Carry on with 4.6 in Augment
With a free account, Augment remembers where you stopped and what you have practiced.
The situation where the credits on the current account (export revenue, income received from abroad and transfers received) are greater than its debits over a period of time.
Payments between countries for which nothing is received in return and that are not for investment, such as workers’ remittances, foreign aid for consumption and contributions to international organisations.
A transaction recorded with a minus sign in the balance of payments because money leaves the country, such as spending on imports or investment abroad by residents.
Policies that aim to reduce a current account deficit by lowering total spending in the economy, including spending on imports, through contractionary fiscal or monetary policy.
Policies that aim to switch spending by domestic residents and foreigners away from imports and towards domestically produced goods and services, such as protectionism or a lower exchange rate.
The part of the balance of payments that records flows of investment into and out of a country: foreign direct investment, portfolio investment, other loans, official borrowing and changes in reserve assets.
The current account item that records income earned by residents from abroad (wages, interest, profits and dividends) minus income paid to non-residents.
The pattern in which a current account balance first worsens after a depreciation or devaluation, because demand for exports and imports is price inelastic in the short run, and then improves as demand becomes more elastic.
The condition that a depreciation or devaluation improves the current account balance only if the sum of the price elasticities of demand for exports and imports is greater than one.
A balancing item in the balance of payments that corrects for mistakes and missing records, so that the current, capital and financial accounts sum to zero.
The value of the foreign assets owned by a country’s residents minus the value of the domestic assets owned by foreigners, measured at a point in time.
Loans that a government or central bank takes from foreign governments or international institutions, such as the IMF, recorded in the financial account.
Foreign currencies, gold and other foreign assets held by a country’s central bank, which it can use to pay for imports, repay foreign debt or intervene in the foreign exchange market.
A state-owned investment fund that invests a country’s surplus revenue, often from exports of oil or other commodities, in foreign and domestic financial assets.
Scope: At SL and HL, the balance of payments covers credit and debit items, the components of the current, capital and financial accounts, why the accounts sum to zero, and calculating balance of payments items from data. HL adds the links between the current and financial accounts and the exchange rate (with a diagram), the implications of persistent current account deficits and surpluses, policies to correct a deficit and their effectiveness, and the Marshall–Lerner condition with the J-curve.
What the balance of payments records
A country’s residents are its households, firms and government, together with organisations based in the country. Every time a resident buys from, sells to, lends to, borrows from or gives money to a non-resident, the transaction is recorded in the balance of payments. A British tourist paying for a hotel in Spain, a Japanese car maker building a factory in the UK and a Nepalese worker in Qatar sending money home are all balance of payments transactions, for the countries involved.
The balance of payments measures flows over a period of time, not stocks at a point in time. It records how much a country exported this year, not the total value of everything it has ever exported, and how much foreign investment arrived this year, not the total stock of foreign-owned assets.
Credit items and debit items
Every transaction is entered either as a credit or as a debit. The simplest way to classify it is to follow the money. If the transaction brings money into the country from abroad, it is a credit and has a plus sign. If money leaves the country, it is a debit and has a minus sign.
Exports are credits, because foreigners pay residents for goods and services. Imports are debits, because residents pay foreigners. The same logic applies to income, transfers and investment: money arriving is a credit, money leaving is a debit.
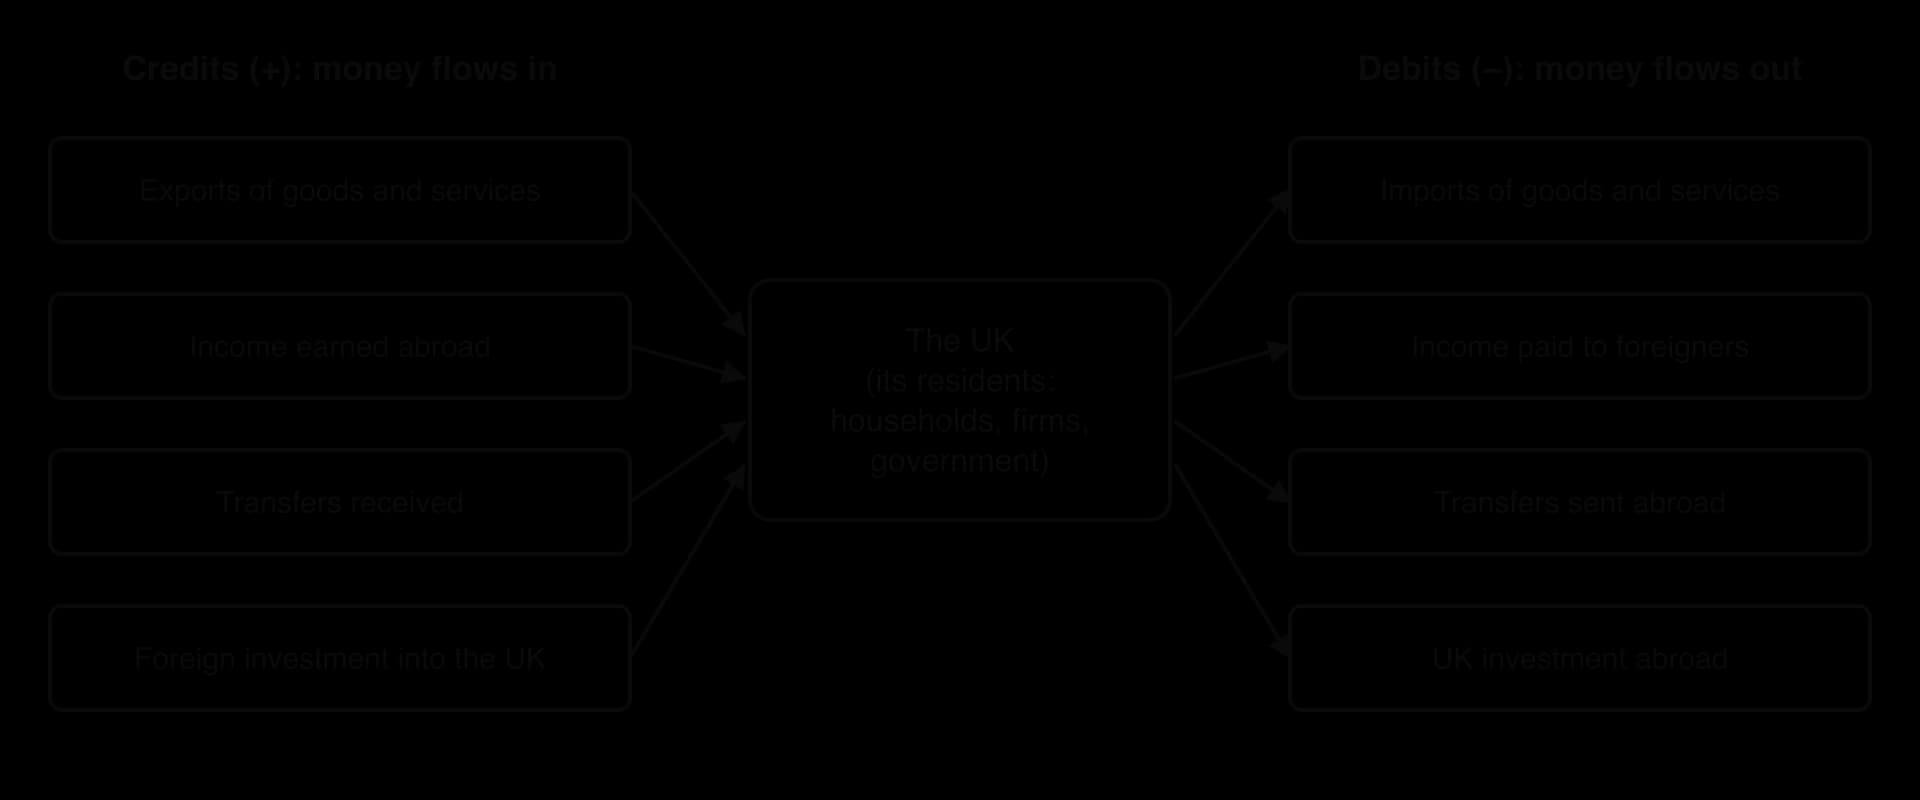
Credits on the left bring money into the country; debits on the right send it out. Investment is classified the same way: foreign money arriving to buy UK assets is a credit, UK money leaving to buy foreign assets is a debit.
The diagram uses the UK as the example. A German firm buying machinery from a UK manufacturer pays the UK firm, so the export is a credit for the UK. A UK resident buying shares in a US company sends money to the United States, so the purchase is a debit for the UK, even though the resident now owns a foreign asset.
Transaction (from the UK’s point of view)
Money flows
Entry
A French tourist stays in a London hotel
In
Credit (+): export of a service
A UK supermarket buys bananas from Ecuador
Out
Debit (−): import of a good
A UK bank receives interest on a loan to a firm in Brazil
In
Credit (+): income
A Polish worker in the UK sends money to family in Poland
Out
Debit (−): current transfer
A Japanese firm builds a factory in the UK
In
Credit (+): foreign direct investment
A UK pension fund buys US government bonds
Out
Debit (−): portfolio investment
Surpluses and deficits on an account
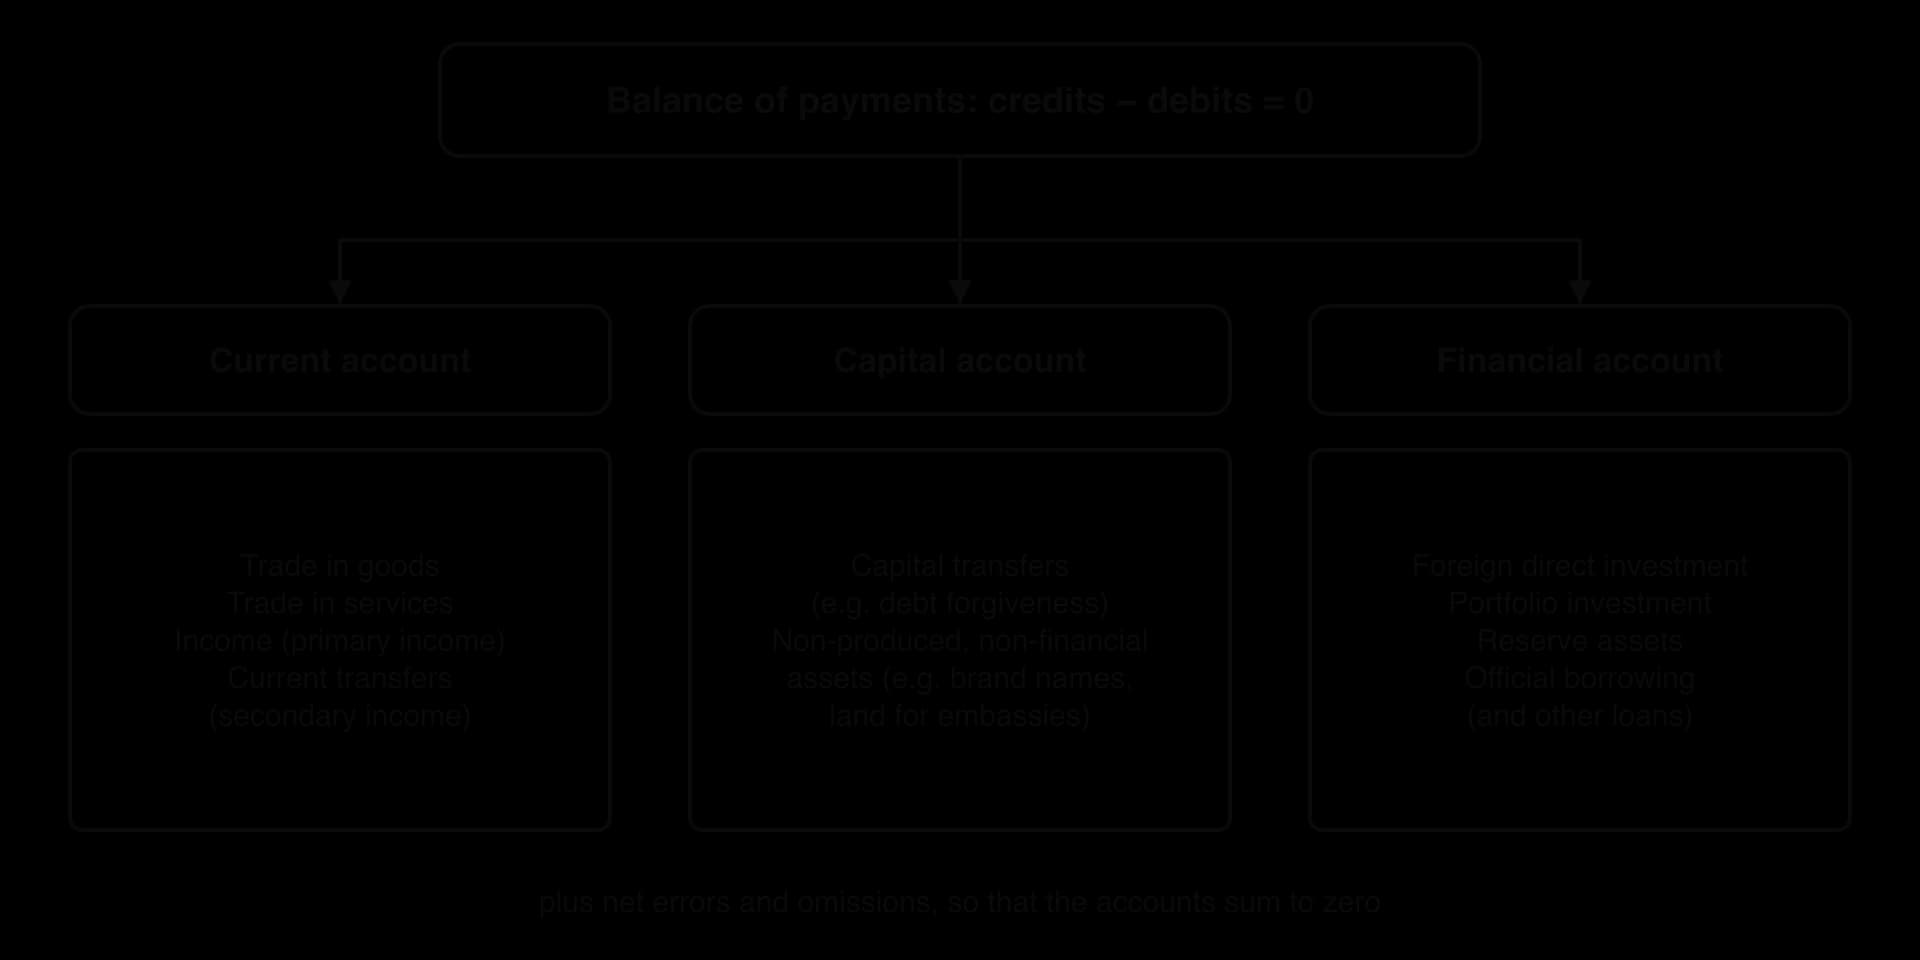
The balance of payments is divided into three accounts: the current account, the capital account and the financial account. For each account, the balance is the total of its credits minus the total of its debits.
If credits are greater than debits, the account is in surplus (a positive balance).
If debits are greater than credits, the account is in deficit (a negative balance).
If credits equal debits, the account is in balance.
The same idea applies to the parts of each account. A country can have a deficit on its trade in goods and a surplus on its trade in services at the same time, as the UK and the United States both do. What matters for analysis is the size of each balance, usually measured as a percentage of GDP so that countries of different sizes can be compared.
The three accounts and their main components. Together with net errors and omissions, the balances on the three accounts always sum to zero.
The current account
The current account records the flows that are part of a country’s income and spending in the current period: trade in goods and services, income earned on work and investment, and one-way transfers. It is the account that receives the most attention, because it shows whether a country earns more from the rest of the world than it spends there.
Balance of trade in goods
Goods are physical products: oil, cars, smartphones, wheat, clothing. The balance of trade in goods compares the revenue from exports of goods with the spending on imports of goods. It is sometimes called the visible trade balance, because goods can be seen and counted as they cross the border.
For most countries this is the largest item in the current account. The United States, the UK and India have large deficits on trade in goods; Germany, China and oil exporters such as Saudi Arabia and Norway usually have large surpluses.
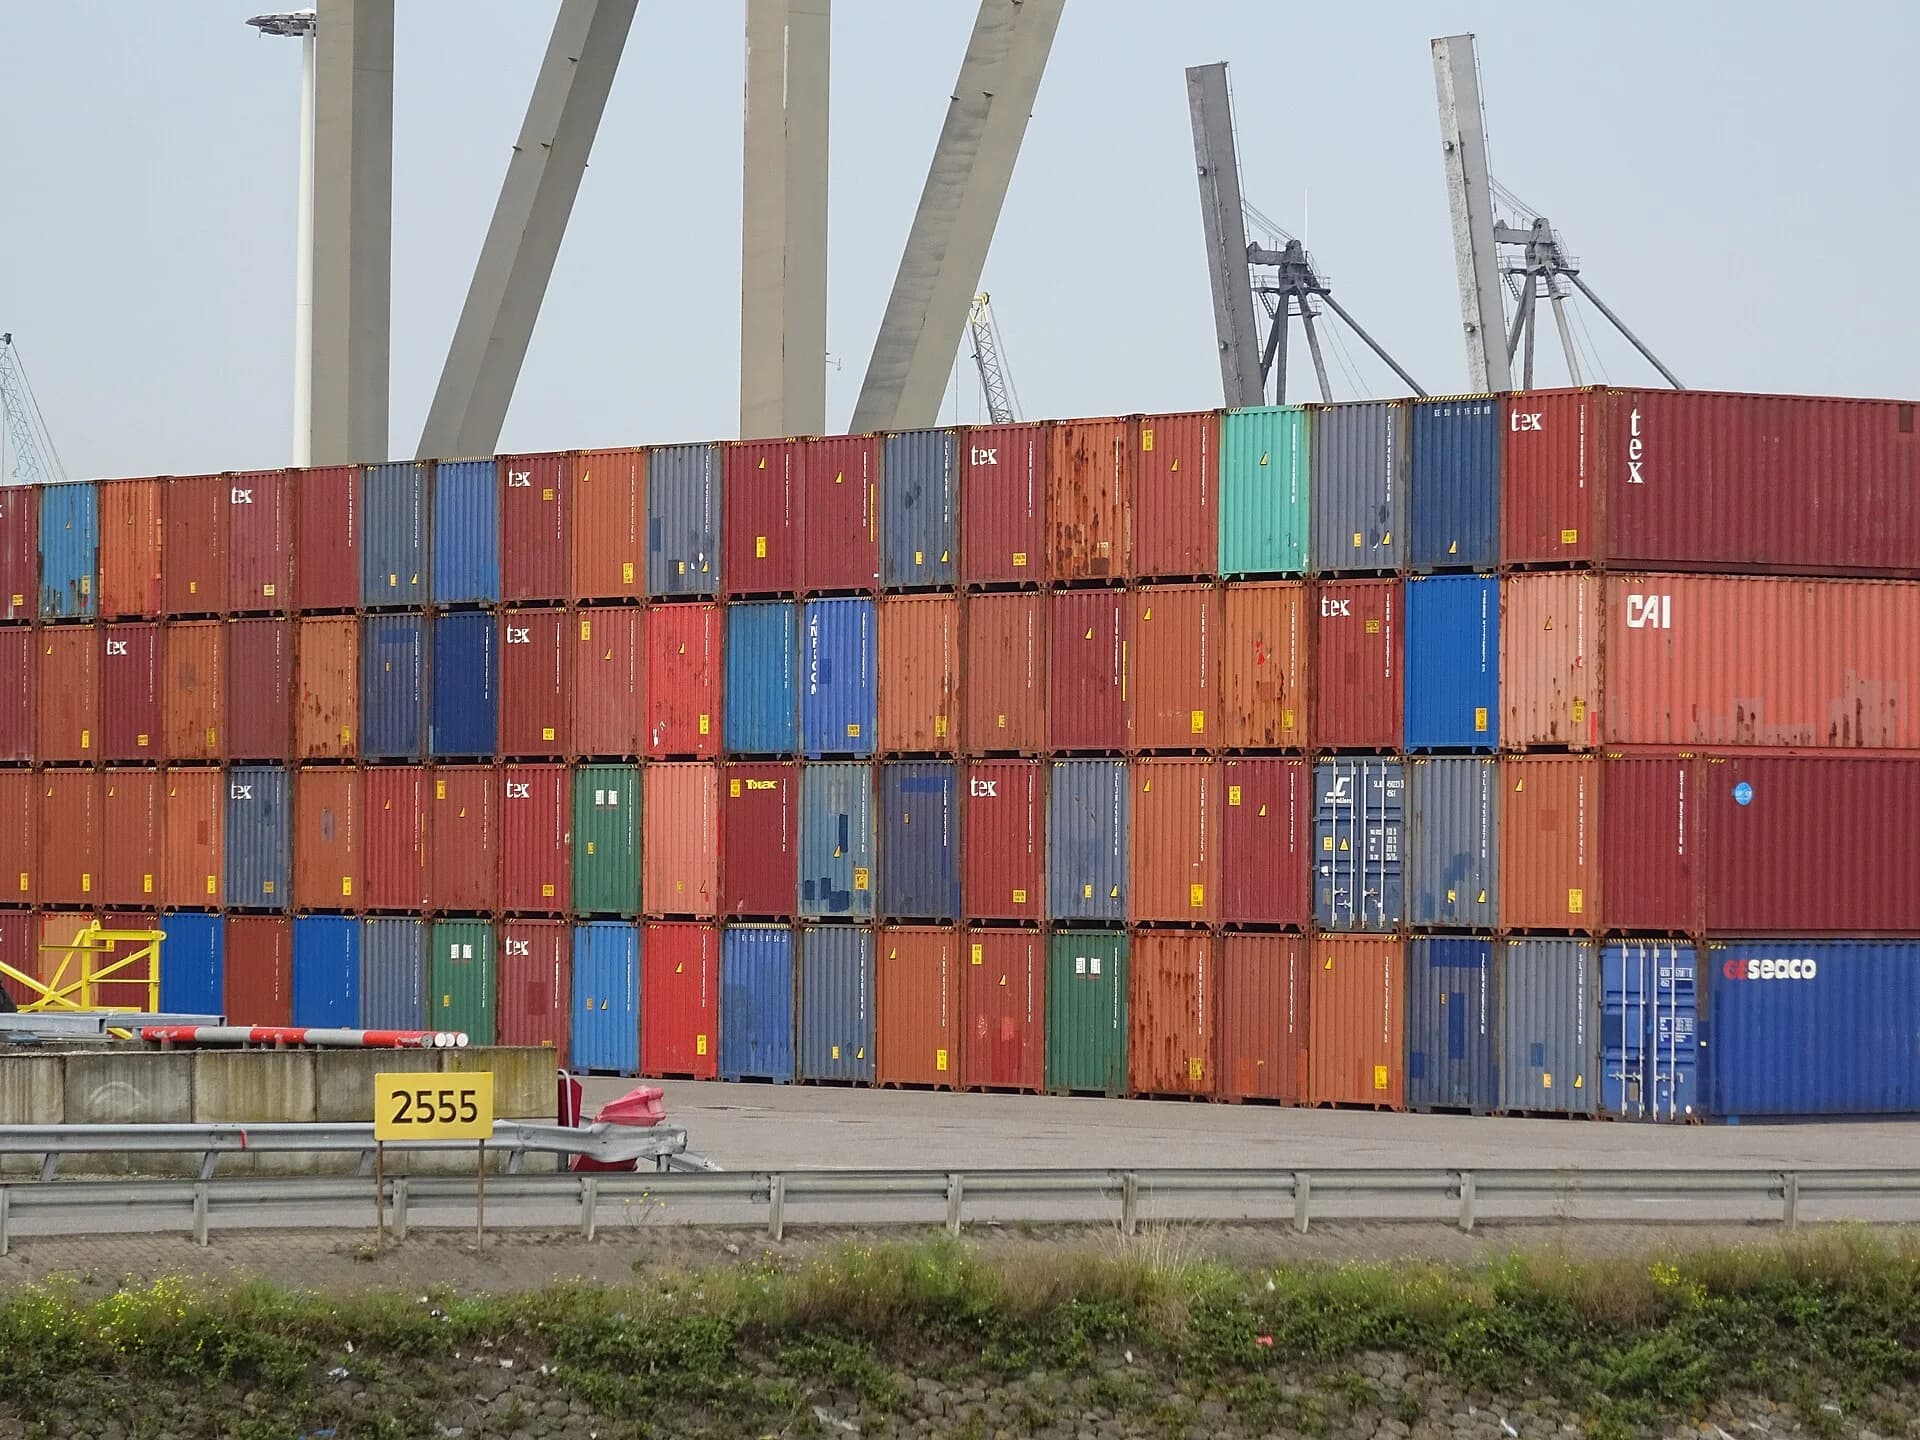
Containers stacked at the Port of Rotterdam, Europe’s largest port. Most traded goods travel in containers like these, and their value forms the balance of trade in goods. Photo: AgainErick, CC BY-SA 4.0, via Wikimedia Commons.
Balance of trade in services
Services are intangible: tourism, transport and shipping, banking, insurance, education, consulting, software and the use of intellectual property. The balance of trade in services compares exports of services with imports of services. It is sometimes called the invisible trade balance.
Classifying services follows the same rule as goods. When a Chinese student pays fees to a university in Australia, Australia exports an education service, even though the student travels to Australia to receive it. When an Indian software firm writes code for a client in Germany, India exports a service. India’s exports of services reached about US$412 billion in 2025, almost half of which were computer and information services.
Sources: World Bank, World Development Indicators, BX.GSR.NFSV.CD and BX.GSR.CCIS.CD (2026).
Income (primary income)
Residents also earn income from abroad by working there for short periods or by owning foreign assets. The income item records wages paid to workers across borders and investment income: interest on loans and bonds, profits of foreign subsidiaries and dividends on shares. In official statistics it is called primary income.
Income flows depend on what each country owns abroad. When a US company owns a factory in Mexico, the profits it sends back to the United States are an income credit for the US and an income debit for Mexico. Countries that have received large amounts of foreign investment over many years, such as many economically less developed countries, often have a deficit on the income account because profits and interest flow out to foreign owners.
Current transfers (secondary income)
Current transfers are one-way payments: money is given and nothing is received in return. In official statistics they are called secondary income. The largest are workers’ remittances, foreign aid for consumption (for example food aid or budget support), payments to and from international organisations, and pensions paid to people living abroad.
For some economies, transfers are very large. Personal remittances received in Nepal were equal to about 26% of GDP in 2023 and 2024, and about 32% in 2025. Without them, Nepal’s large deficit on trade in goods would leave a much larger current account deficit.
Sources: World Bank, World Development Indicators, BX.TRF.PWKR.DT.GD.ZS (2026).
The current account balance
The current account balance adds the four balances together. In symbols:
current account balance=(Xgoods−Mgoods)+(Xservices−Mservices)+net income+net current transfers
When the total is negative, the country has a current account deficit: it is spending more abroad, on imports, income payments and transfers, than it earns from abroad. When the total is positive, it has a current account surplus.
A current account deficit means that the country is using more goods and services than it produces, and paying for the difference by borrowing from abroad or selling assets to foreigners. A surplus means the reverse: the country produces more than it uses and lends the difference abroad, or buys foreign assets with it.
The trade balance in goods and services, exports minus imports, is the same quantity as net exports (X − M) in aggregate demand. A larger trade deficit therefore reduces aggregate demand, and a larger trade surplus adds to it. The income and transfer items are not part of aggregate demand, which is why the trade balance and the current account balance can move differently.
A current account calculation adds up the credits and debits item by item. The data for Country A are hypothetical, in US$ billion, for one year.
Item (Country A, hypothetical)
US$ bn
Exports of goods
420
Imports of goods
510
Exports of services
180
Imports of services
130
Income received from abroad
45
Income paid abroad
70
Current transfers received
15
Current transfers sent abroad
25
The capital account
The capital account is usually the smallest of the three accounts. It records two kinds of transaction, neither of which is part of current income or of normal investment flows.
Capital transfers: one-way transfers of ownership of capital or of money for investment. The main examples are debt forgiveness (when a creditor government cancels a loan, the debtor country records a capital transfer received), grants for capital projects such as a donor paying for a bridge or a hospital, and the assets that migrants bring with them when they move country.
Transactions in non-produced, non-financial assets: buying and selling assets that were not produced and are not financial. Examples are land bought by a foreign government for an embassy, rights to natural resources, and marketing assets such as brand names, trademarks and licences.
For most countries, the capital account balance is close to zero. It matters mainly for low-income countries that receive large debt relief or capital grants: when official creditors cancel debt, the amount appears as a large capital account credit for the debtor country in that year.
The financial account
The financial account records flows of investment and lending between countries: purchases and sales of financial assets such as shares, bonds and bank deposits, and investment in real assets such as factories. It shows how a country finances a current account deficit, or what it does with a current account surplus.
The rule of following the money still applies. When foreigners invest in the country, money flows in and the entry is a credit (+). When residents invest abroad, money flows out and the entry is a debit (−). A financial account surplus means that more investment and lending has come into the country than has gone out of it, so that, on balance, the country has borrowed from abroad or sold assets to foreigners.
Foreign direct investment
Foreign direct investment (FDI) is long-term investment by a firm in another country in which the investor gains a lasting interest and a significant degree of control, normally an ownership share of at least 10%. Building a new factory abroad, buying a foreign company or setting up a foreign subsidiary are all FDI.
A Japanese car maker building a plant in the UK is an FDI credit for the UK. A UK supermarket chain buying a retail chain in Poland is an FDI debit for the UK. FDI is usually stable: factories cannot be moved out of a country quickly, so FDI inflows are less likely than other flows to reverse suddenly.
Portfolio investment
Portfolio investment is the purchase of financial assets, mainly shares and bonds, without gaining control of the firm or government that issues them. A US investment fund buying shares in an Indian company, or a German pension fund buying UK government bonds, is portfolio investment.
Portfolio flows can move very quickly. Investors can sell shares or bonds in seconds and move the money elsewhere, so portfolio inflows can reverse when interest rates abroad rise or confidence falls. Short-term flows that move between countries in search of the highest return or in response to expected exchange rate changes are called hot money.
Reserve assets
A country’s central bank holds stocks of foreign currencies (mostly US dollars, euros and yen), gold and other foreign assets. These reserve assets can be used to pay for imports and foreign debt in an emergency, and to intervene in the foreign exchange market to influence the exchange rate.
Changes in reserves are recorded in the financial account with a sign that often confuses students. When the central bank adds to its reserves, it buys foreign assets, so money flows out of the country: the entry is a debit (−). When the central bank uses reserves, it sells foreign assets and brings money back into the country: the entry is a credit (+). A country running down its reserves to pay for a current account deficit therefore shows a positive reserve assets entry.
Official borrowing and other investment
Official borrowing is borrowing by the government or the central bank from foreign governments and international institutions, for example a loan from the International Monetary Fund (IMF) to a country in a balance of payments crisis. Like other borrowing from abroad, it is a credit, because money flows into the country. Repaying it is a debit.
Official statistics also include a large item called other investment, which covers bank loans and deposits between countries and trade credit between firms. When a UK bank lends to a firm in South Africa, the loan is an outflow for the UK; when a foreign bank deposits money in a London bank, it is an inflow.
Sovereign wealth funds
Some governments that earn large surpluses from exports of oil and other commodities invest them abroad through a sovereign wealth fund. The purchases of foreign shares, bonds and property are financial account debits, because money flows out of the country.
Norway’s Government Pension Fund Global, built from the country’s oil and gas revenue, was worth about 21,300 billion kroner at the end of 2025. It invests only in international financial markets, so the oil revenue does not add directly to spending in the Norwegian economy. Norway’s current account surplus reached about 28% of GDP in 2022, when gas prices were very high, and the fund’s foreign purchases are the matching financial account outflow.
Sources: Wikipedia, “Government Pension Fund of Norway”, citing Norges Bank Investment Management (accessed 2026); IMF, World Economic Outlook database (October 2026).
Why the balance of payments always balances
However large a country’s current account deficit is, its balance of payments as a whole always sums to zero. This follows from how transactions are recorded: every international transaction has two sides, and both are recorded.
Suppose a UK firm imports US$10 million of machinery from the United States. The import is a current account debit of US$10 million. The UK firm must also pay for it. If it pays from a UK bank’s dollar deposits, the UK’s holdings of foreign assets fall by US$10 million, which is a financial account credit. If instead the US supplier accepts payment in pounds and keeps them in a London bank account, a US resident has acquired a UK asset, which is also a financial account credit. Either way, the debit on the current account is matched by an equal credit in the financial account.
The same logic holds for every transaction. A country can only buy more from the rest of the world than it sells if it pays for the difference, and it can only pay by borrowing from foreigners, selling assets to them or running down its reserves. All three are credits in the financial account.
current account+capital account+financial account+net errors and omissions=0
What the identity shows
The identity links the accounts directly. If the capital account balance is close to zero, a current account deficit must be matched by a financial account surplus of the same size. A country with a current account deficit is, in effect, a net borrower from the rest of the world, or a net seller of its assets to foreigners. A country with a current account surplus is a net lender, or a net buyer of foreign assets.
If the current account is in…
Then the capital and financial accounts are in…
What it means
Deficit
Surplus
The country borrows from abroad, sells assets to foreigners or runs down its reserves to pay for spending more than it earns.
Surplus
Deficit
The country lends abroad, buys foreign assets or adds to its reserves with the money it earns above what it spends.
Over time, these flows build up into stocks. A country that runs current account deficits for many years accumulates foreign liabilities: foreigners own more and more of its firms, bonds and property. The difference between the foreign assets a country’s residents own and the domestic assets that foreigners own is its net international investment position.
Net errors and omissions
In practice, the recorded accounts never sum exactly to zero. Statistical agencies collect data from customs records, surveys of firms, banks and tourism, and many transactions are missed, recorded late or valued differently by each side. Smuggling, unrecorded cash flows and errors in estimates all play a part.
Net errors and omissions is calculated as whatever figure makes the total exactly zero. It is often large: for the United States in the second quarter of 2026 it was about −US$125 billion, half the size of the current account deficit.
United States, 2nd quarter 2026 (US$ billion, seasonally adjusted)
Credits
Debits
Balance
Trade in goods
640.3
931.6
−291.3
Trade in services
326.9
235.4
+91.5
Income (primary income)
416.2
427.6
−11.4
Current transfers (secondary income)
61.0
95.8
−34.8
Current account
−246.0
Capital account
+1.2
Financial account (net inflow of investment and borrowing)
+369.7
Net errors and omissions (statistical discrepancy)
−124.9
Sum of the accounts
0.0
Sources: US Bureau of Economic Analysis, “U.S. International Transactions, 2nd Quarter 2026: Historical Comparisons” (24 September 2026). The BEA publishes the financial account as net borrowing of −369.7; its sign is reversed here so that a net inflow is a credit (+).
The US data show every part of the identity at work. The large deficit on trade in goods is partly offset by a surplus on services, but the current account is still US$246 billion in deficit in a single quarter, about 3.0% of US GDP. The United States paid for it with a net inflow of US$370 billion of foreign investment and lending into US assets, and the statistical discrepancy accounts for the rest.
YouTube
EconplusDal goes through the current, capital and financial accounts with examples of each item, and why the accounts balance. It uses UK terms; the structure is the same as the one used here.
The current account and the exchange rate (HL only)
Every credit in the current account creates demand for the domestic currency, and every debit creates a supply of it. When a US firm buys UK machinery, it must pay in pounds, so it buys pounds with dollars on the foreign exchange market. When a UK household buys a US holiday, it sells pounds to buy dollars. In a floating exchange rate system, the current account is therefore one of the main forces behind the demand for and supply of a currency.
Current account flow
Effect on the foreign exchange market for £
Exports of UK goods and services
Foreigners buy £: demand for £ (D£)
Income and transfers received by UK residents
Foreign currency converted into £: demand for £
Imports of goods and services into the UK
UK residents sell £ to buy foreign currency: supply of £ (S£)
Income and transfers paid abroad
UK residents sell £: supply of £
A current account deficit puts downward pressure on the currency
Consider an economy whose only international transactions are on the current account. The demand for pounds then comes from the credits (exports, income and transfers received) and the supply of pounds from the debits (imports, income and transfers paid). At the exchange rate where the two are equal, the current account balances.
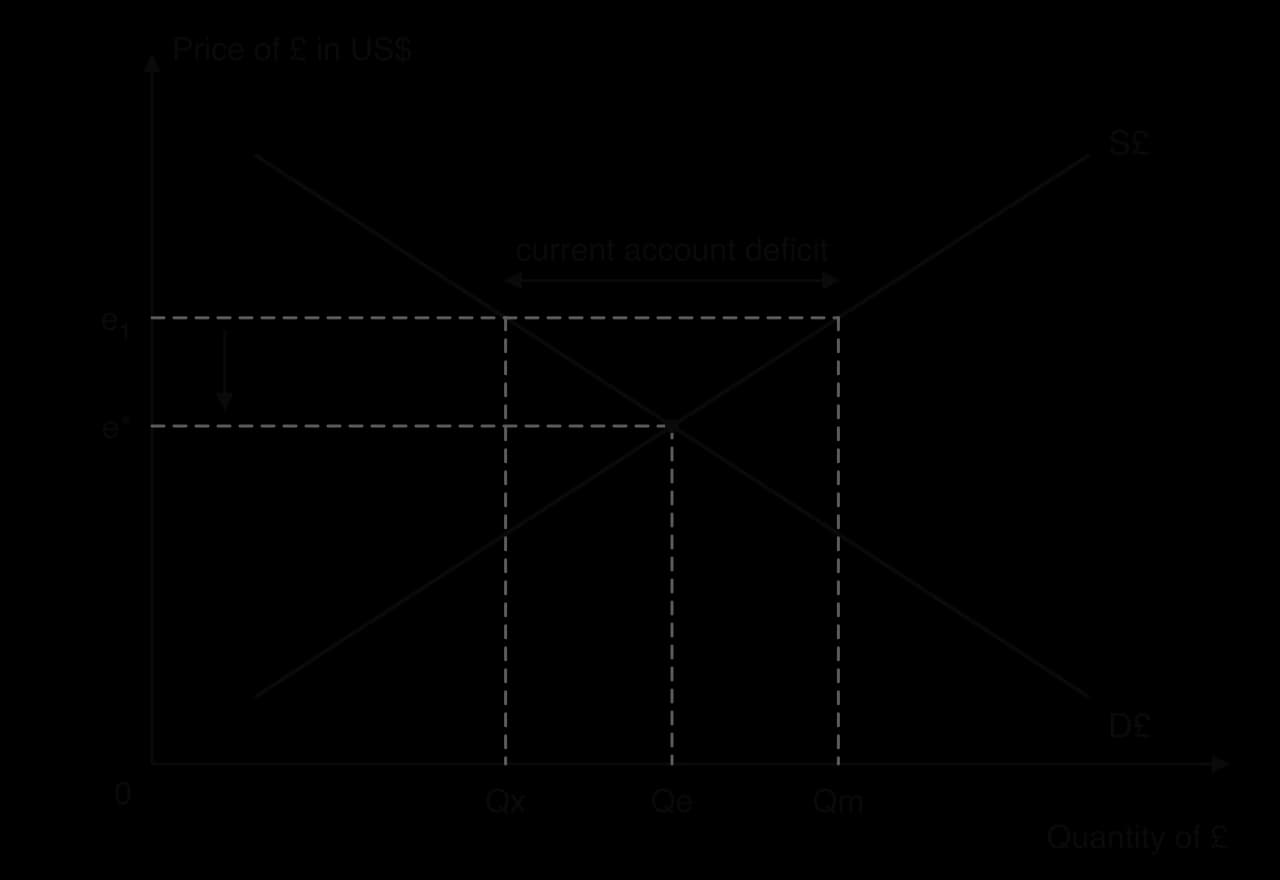
At e₁ the pounds supplied to pay for imports (Qm) exceed the pounds demanded for exports (Qx): the gap is the current account deficit. With only current account flows, the excess supply makes the pound depreciate towards e*.
In the diagram, the exchange rate e₁ is above the rate e* at which current account flows balance. At e₁, UK residents supply Qm pounds to pay for imports, while foreigners demand only Qx pounds for UK exports. The horizontal gap Qm − Qx is the current account deficit, measured in pounds. Because more pounds are being sold than bought, the pound depreciates towards e*.
The depreciation itself starts to correct the deficit. A cheaper pound makes UK exports cheaper for foreign buyers and imports dearer for UK buyers, so export volumes rise and import volumes fall. In this simple model a floating exchange rate is self-correcting: a current account deficit causes a depreciation, and the depreciation reduces the deficit. Whether the deficit actually shrinks depends on the price elasticities of demand for exports and imports, which is the subject of the Marshall–Lerner condition.
The reverse also holds. A current account surplus means that more of the currency is demanded than supplied at the current rate, so the currency tends to appreciate. The appreciation makes exports dearer and imports cheaper, which tends to reduce the surplus.
The exchange rate as a cause of current account changes
The link runs in both directions. A change in the exchange rate for any other reason, such as a rise in interest rates or speculation, changes the relative prices of exports and imports and so moves the current account. A currency that appreciates because of capital inflows makes exports less competitive and imports cheaper, which tends to widen a current account deficit. A currency that depreciates after a loss of confidence tends, after a time lag, to narrow it.
In a fixed exchange rate system, the self-correcting mechanism is blocked. A country with a current account deficit and a fixed rate faces excess supply of its currency at the fixed rate, and the central bank must buy its own currency with reserve assets to hold the rate. The deficit then appears as a fall in reserves (a positive reserve assets entry in the financial account) instead of as a depreciation. This can continue only as long as the reserves last.
The financial account and the exchange rate (HL only)
Financial account flows are now far larger than trade flows on the foreign exchange market. When foreign firms build factories in a country, when foreign investors buy its shares and bonds, or when foreign banks lend to it, they must first buy its currency. Financial account inflows therefore increase the demand for the currency, and outflows (residents investing abroad) increase its supply.
Higher interest rates attract portfolio inflows and hot money, which increase demand for the currency and cause it to appreciate.
Strong growth prospects or a good investment climate attract foreign direct investment, with the same effect.
A loss of confidence, a cut in the country’s credit rating or higher interest rates abroad cause investors to sell their assets and move the money out, increasing the supply of the currency and causing it to depreciate.
Central bank intervention is also a financial account flow: buying the domestic currency with reserves raises demand for it; selling it to add to reserves raises supply.
How financial inflows finance a current account deficit
The two accounts meet in the foreign exchange market. A country with a current account deficit supplies more of its currency for imports than foreigners demand for its exports. If foreign investors want to buy its assets, their demand for the currency fills the gap, and the exchange rate need not fall.
Left: financial inflows add to demand for pounds (D£₁ to D£₂), so the pound stays at e₁ despite a current account deficit of Qm − Qx. Right: when the inflows stop, demand falls back to D£₁ and the pound depreciates to e₂.
In the left-hand panel, D£₁ shows the demand for pounds from current account credits alone. At e₁, it falls short of the supply of pounds by the current account deficit. Financial inflows add to demand, shifting it to D£₂, which meets the supply curve at e₁. The financial account surplus is exactly the size of the current account deficit, which is the balance of payments identity seen in the currency market.
The right-hand panel shows the risk. If foreign investors stop buying the country’s assets, for example because its debt looks less safe or because interest rates rise elsewhere, demand for the currency falls back to D£₁ and the currency depreciates sharply to e₂. A country that relies on short-term portfolio inflows and hot money to finance a large deficit is exposed to this kind of sudden stop. FDI is less likely to leave quickly.
Strong inflows can widen the current account deficit
Financial inflows can also cause current account deficits. When large inflows make the currency appreciate, exports become less competitive and imports cheaper, so the current account worsens. The United States is the largest example. Foreign governments, central banks and investors want to hold US dollar assets, especially US government bonds, because they are safe and easy to sell. This demand keeps the dollar stronger than it would otherwise be and makes it easy for the United States to finance a current account deficit year after year: in the second quarter of 2026 alone, net financial inflows into the United States were about US$370 billion.
Sources: US Bureau of Economic Analysis (24 September 2026).
Persistent current account deficits (HL only)
A current account deficit in one year is not necessarily a problem. A country may import a large amount of machinery that will raise its exports later, or a temporary fall in an export price may push the account into deficit for a year or two. The concern is a deficit that is large and persistent, lasting for many years, because each year’s deficit must be financed by borrowing from abroad or selling assets to foreigners.
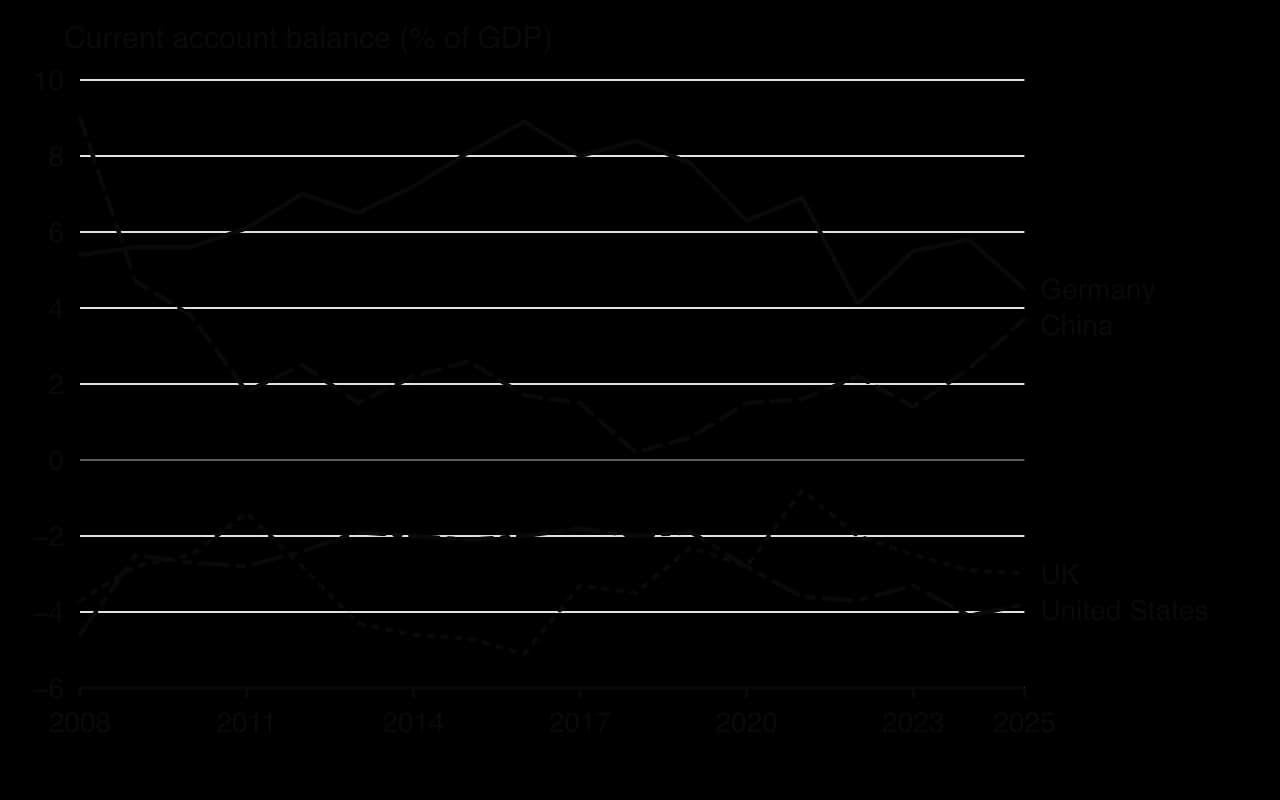
The UK and the US have had current account deficits in every year since 2008; Germany and China have had surpluses. Source: IMF, World Economic Outlook database (October 2026); 2025 values are partly estimated.
The chart shows two countries with persistent deficits and two with persistent surpluses. The UK’s deficit reached about 5% of GDP in 2016 and the US deficit about 4% of GDP in 2024. Germany’s surplus was above 6% of GDP in every year from 2011 to 2021, while China’s fell from 9% of GDP in 2008 to almost zero in 2018 and then rose again.
Why persistent deficits arise
Low competitiveness: high costs, low productivity growth or poor product quality reduce exports and raise imports. A low level of international competitiveness is a supply-side cause.
An overvalued currency: a fixed or managed exchange rate held above its market level makes exports dear and imports cheap.
Fast growth of domestic demand: when incomes rise quickly, spending on imports rises with them, while exports depend on growth abroad.
Low national saving relative to investment: if households and the government together save less than the country invests, the gap must be filled with saving from abroad, which is a current account deficit.
Dependence on imported essentials: an economy that imports most of its fuel, food or medicines faces a larger import bill whenever their world prices rise.
The current account and the saving–investment gap
National income accounting gives another way to see the current account. A country’s current account balance equals its national saving minus its domestic investment. A country that invests more than it saves must borrow the difference from abroad, so it runs a current account deficit; a country that saves more than it invests lends the difference abroad and runs a surplus.
This explains why policies aimed only at trade, such as tariffs, often leave the current account deficit almost unchanged. If a tariff does not change how much the country saves and invests, the current account balance cannot change much either: a smaller trade deficit in one product is offset by changes elsewhere, often through an appreciation of the currency that makes other exports less competitive.
Implications of a persistent current account deficit
The effects of a persistent deficit are interlinked: the need for financial inflows connects the deficit to the exchange rate, interest rates, debt and the scope for other policies.
Exchange rates
A persistent deficit means that the country continuously supplies more of its currency for imports than is demanded for its exports. Unless financial inflows fill the gap, the currency tends to depreciate. A depreciation raises the price of imported goods and inputs, which can cause cost-push inflation and lowers the purchasing power of households. With a fixed or managed rate, the central bank must run down reserves to hold the rate, which cannot continue for ever.
Interest rates
To attract the financial inflows that finance the deficit, and to stop the currency from depreciating too fast, the central bank may have to keep interest rates higher than it otherwise would. Higher interest rates make borrowing more expensive for firms and households, which reduces consumption and investment and can slow growth.
Foreign ownership of domestic assets
A deficit financed by FDI and by sales of shares and property means that more and more of the country’s firms, land and buildings pass into foreign ownership. Foreign ownership can bring capital, technology and jobs, but the profits on the assets then flow abroad as income debits, which adds to future current account deficits. Some governments also worry about foreign control of strategic industries such as energy, ports and telecommunications.
Debt
A deficit financed by borrowing increases the country’s foreign debt. The interest on that debt is paid abroad, which again worsens the income balance in later years. If the debt is in a foreign currency, such as US dollars, a depreciation of the domestic currency increases the burden of repaying it, because more domestic currency is needed to buy each dollar. This is one of the main dangers for economically less developed countries, which often cannot borrow abroad in their own currency.
Credit ratings
Credit rating agencies judge how likely a government is to repay its debt. Persistent deficits, rising foreign debt and falling reserves can lead to a downgrade. A lower rating raises the interest rate the country must pay on new borrowing, and it can make some investors unwilling to lend at all, which makes the deficit harder to finance and can turn a slow problem into a crisis.
Demand management
A persistent deficit limits the choice of macroeconomic policy. A government that wants to reduce unemployment with expansionary fiscal or monetary policy knows that higher incomes will raise spending on imports and widen the deficit, and that lower interest rates may cause the currency to fall and inflows to leave. The need to keep foreign lenders confident may force contractionary policy at a time when the domestic economy needs the opposite.
Economic growth
The effect on economic growth depends on what the deficit pays for. If the country is importing capital goods and receiving FDI that raises productive capacity, the deficit can support faster long-run growth and the debts can be repaid from higher future output. If it is paying for consumption, and if the policies needed to finance it (high interest rates, then a forced contraction) slow the economy, a persistent deficit lowers growth. The trade deficit also reduces aggregate demand through lower net exports.
How serious is a persistent deficit?
Whether a persistent deficit is a problem depends on several factors, and a strong evaluation weighs them for the specific country.
Factor
Less worrying
More worrying
Size
Small, around 1–2% of GDP
Large, above about 4–5% of GDP for many years
What it pays for
Imports of capital goods that raise future exports and output
Consumption, or imports of essentials with no rise in productive capacity
How it is financed
Long-term FDI
Short-term portfolio flows, hot money and foreign-currency loans
Currency of the debt
Domestic currency (as for the US and the UK)
Foreign currency (as for many less developed countries)
Reserves
Large reserves compared with import bills and debt payments
Reserves covering only a few weeks of imports
Confidence
Stable institutions, a high credit rating, a reserve currency
Weak public finances, falling credit rating, political instability
The United States shows how much the financing matters. It has had a current account deficit in almost every year since the early 1980s, and its net international investment position was about −US$22 trillion in mid-2026. Yet because its debts are in dollars and the dollar is the world’s main reserve currency, foreign investors keep lending, and the deficit has not caused a crisis. A low-income country with the same deficit as a share of GDP, borrowing in dollars, would face a very different risk, as the case of Sri Lanka shows.
Sources: US Bureau of Economic Analysis (2026).
Correcting a persistent current account deficit (HL only)
A government that decides a deficit must be reduced has three groups of policies. Expenditure-switching policies change what people buy; expenditure-reducing policies change how much they buy; supply-side policies change how competitive the economy’s producers are.
Expenditure-switching policies
Expenditure-switching policies aim to switch spending, by both residents and foreigners, away from foreign goods and towards domestically produced goods and services.
A lower exchange rate. A devaluation of a fixed currency, or a depreciation of a floating or managed one encouraged by lower interest rates or by the central bank selling its currency, makes exports cheaper abroad and imports dearer at home.
Trade protection. Tariffs and quotas raise the price or limit the quantity of imports; subsidies to domestic producers help them compete with imports and sell abroad.
Both work through relative prices. A 10% depreciation lowers the foreign-currency price of exports and raises the domestic-currency price of imports, so both foreign and domestic buyers switch towards the country’s goods. A tariff raises the price of imports only, so it switches domestic spending but does nothing directly for exports.
Evaluating expenditure switching
Elasticities. A depreciation improves the current account only if demand for exports and imports is sufficiently price elastic (the Marshall–Lerner condition), and in the short run it often makes the deficit worse (the J-curve).
Inflation. Dearer imports raise the cost of living and of imported raw materials and components. If wages then rise, domestic costs rise and the competitive gain from the depreciation is gradually lost.
Retaliation and rules. Tariffs and quotas break World Trade Organization commitments unless they are justified under its rules, and trading partners may respond with retaliation, cutting the country’s exports.
Efficiency. Protection shields inefficient domestic firms from competition, raises prices for consumers and, in the long run, can make the economy less competitive, which works against the aim of the policy.
Limited effect on the overall balance. If saving and investment do not change, a smaller deficit on protected goods tends to be offset elsewhere. The US tariffs introduced from 2025 have not removed the US current account deficit: it was about US$1,177 billion (3.8% of GDP) in 2025, close to its 2024 level, and the quarterly goods deficit reached US$456 billion in the first quarter of 2025, as many firms brought imports forward before the tariffs took effect.
Sources: IMF, World Economic Outlook database (October 2026); US Bureau of Economic Analysis (2026).
Expenditure-reducing policies
Expenditure-reducing policies aim to reduce the deficit by lowering total spending in the economy, part of which is spending on imports.
Higher income taxes reduce disposable income, and higher interest rates raise the cost of borrowing, so households and firms spend less. Because part of every extra unit of spending goes on imports, lower spending means fewer imports. Lower demand also reduces inflationary pressure, which helps the competitiveness of exports over time.
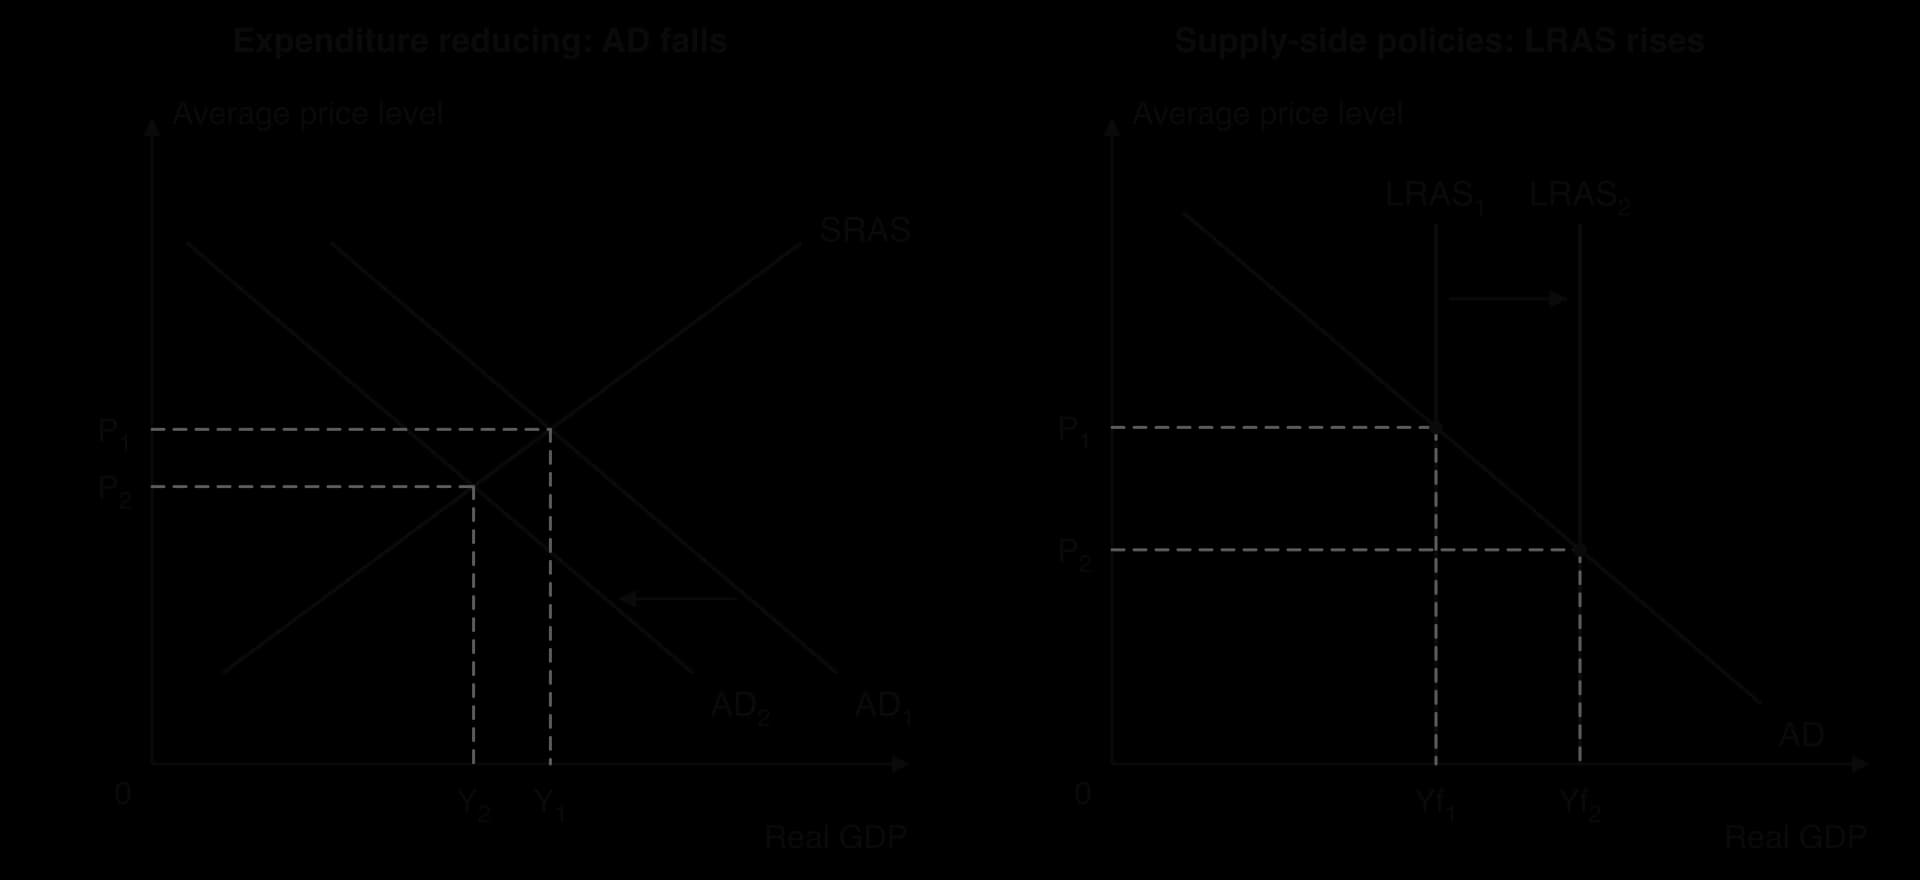
Left: expenditure reducing shifts AD from AD₁ to AD₂, lowering real GDP to Y₂ and the price level to P₂, so spending on imports falls. Right: supply-side policies shift LRAS right, raising potential output and lowering costs and prices, which makes exports more competitive.
In the left-hand panel, contractionary policy shifts aggregate demand from AD₁ to AD₂. Real GDP falls from Y₁ to Y₂ and the average price level from P₁ to P₂. Imports fall because incomes are lower, and the lower price level makes domestic goods slightly more competitive.
Evaluating expenditure reducing
The cost is lower output and jobs. The policy works mainly by making residents poorer: real GDP falls and cyclical unemployment rises. It conflicts directly with the objectives of growth and low unemployment.
Only a small share of the cut falls on imports. If the marginal propensity to import is 0.2, total spending must fall by five units to reduce imports by one unit.
Higher interest rates can work against the aim. Higher rates attract financial inflows and cause the currency to appreciate, which makes exports dearer and imports cheaper.
It may be unavoidable. When a country can no longer borrow abroad, spending must fall to match what it earns, whether or not the government chooses the policy. Expenditure reducing is often a condition of IMF loans for this reason.
Supply-side policies
Supply-side policies aim to raise the productive capacity and international competitiveness of the economy, so that its firms can sell more abroad and compete better with imports. Examples are spending on education, training and infrastructure, support for research and development, and market-based reforms such as deregulation and policies that increase labour market flexibility.
In the right-hand panel of the diagram, supply-side policies shift LRAS from LRAS₁ to LRAS₂. Potential output rises and the average price level falls from P₁ to P₂. Higher productivity lowers unit costs, so exports become cheaper and better, and more of domestic demand can be met by domestic firms.
Evaluating supply-side policies
They address the cause when the deficit comes from low competitiveness, and they raise growth at the same time, so they avoid the trade-offs of the other two approaches.
Long time lags. Education, infrastructure and research take years, often decades, to raise productivity. They cannot deal with a deficit that needs financing now.
Uncertain effect. Higher productivity may raise incomes and so spending on imports as well as exports, and success depends on what other countries do.
Costs. Interventionist supply-side policies require government spending, which may be hard to fund for a country already short of foreign currency; market-based ones can raise inequality.
Which method works best?
Method
Main strengths
Main limitations
Time frame
Expenditure switching: depreciation or devaluation
Improves competitiveness of all exports at once; no direct budget cost
Retaliation, WTO rules, higher prices, less efficient firms; little effect on overall balance
Short run
Expenditure reducing
Reliable fall in imports; lowers inflation
Lower growth and higher unemployment; can raise the exchange rate
Short run
Supply-side policies
Tackle low competitiveness; raise long-run growth
Long time lags; uncertain; may need public spending
Long run
In practice, governments combine them. A typical package for a country in crisis is a devaluation (to switch spending), contractionary fiscal and monetary policy (to reduce spending and stop the devaluation from causing high inflation), and supply-side reforms (to make the improvement last). The best mix depends on the cause of the deficit: a deficit caused by an overvalued currency calls for a lower exchange rate, one caused by excess demand for expenditure reducing, and one caused by low productivity for supply-side policies.
The Marshall–Lerner condition and the J-curve (HL only)
A depreciation has two effects on the trade balance that pull in opposite directions. The volume effect is favourable: exports become cheaper for foreigners, so more are sold, and imports become dearer at home, so fewer are bought. The price effect is unfavourable: each unit of imports now costs more in domestic currency, so even an unchanged quantity of imports costs more. Whether the trade balance improves depends on which effect is larger, which depends on the price elasticity of demand for exports and for imports.
The Marshall–Lerner condition
If demand for exports and imports is price inelastic, quantities change little when prices change. Foreigners buy only a few more exports, residents buy only slightly fewer imports, and the higher domestic-currency price of the imports they still buy outweighs the gains. The trade balance gets worse. If demand is elastic enough that the two elasticities add up to more than one, the volume effect outweighs the price effect and the trade balance improves.
The PEDs are used as absolute values (without their minus signs). Strictly, the condition in this simple form applies when trade starts in balance and supply is perfectly elastic, but it is the standard test used for any depreciation.
The J-curve
Demand for exports and imports is usually less elastic in the short run than in the long run. Immediately after a depreciation, firms and households keep buying under existing contracts, take time to find new suppliers, and keep their habits; foreign buyers may not yet know that the country’s goods have become cheaper; and exporters may not be able to raise output quickly. Over months and years, buyers switch, exporters expand capacity and new markets open, so the elasticities rise.
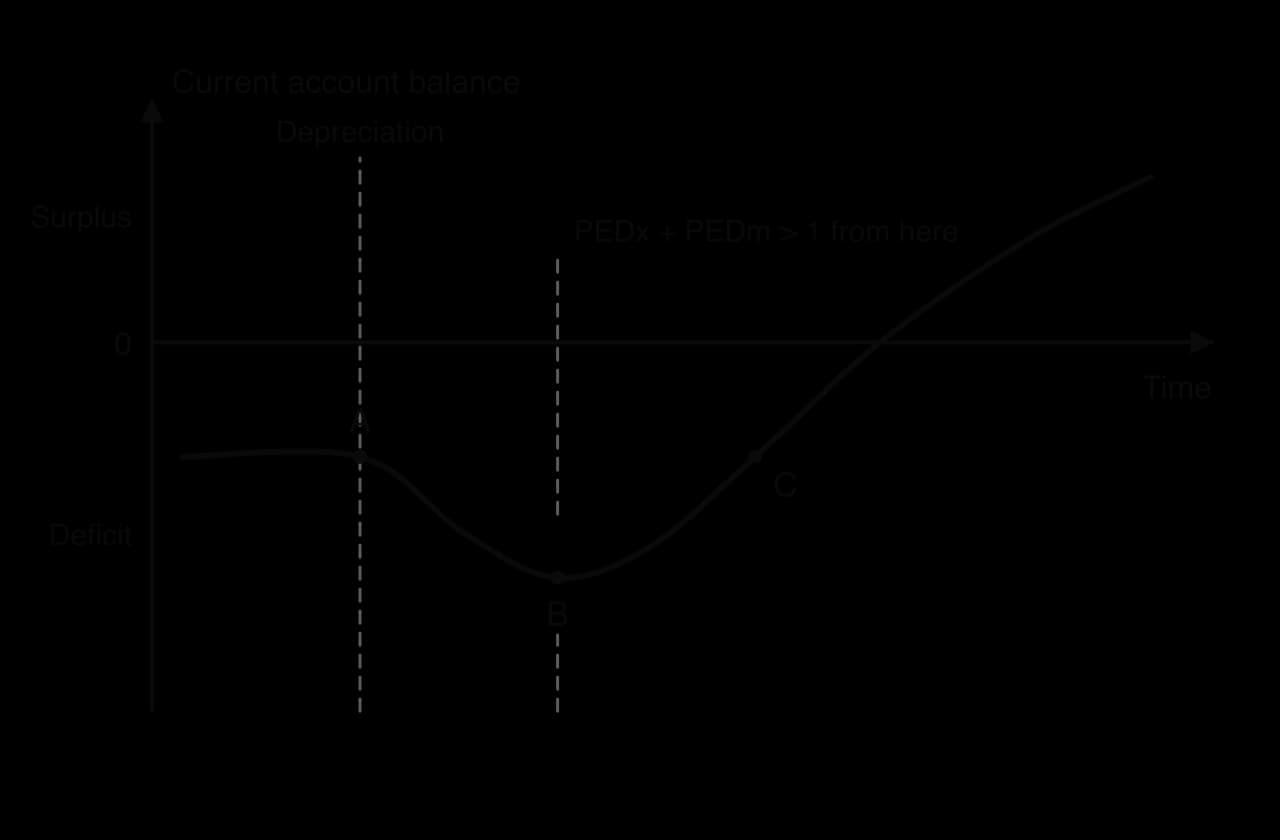
After the depreciation at A, the deficit first widens to B because PEDx + PEDm < 1 in the short run. From B the Marshall–Lerner condition holds, the balance improves, passes its starting level at C and can move into surplus.
The diagram shows the current account balance against time. Before the depreciation the country has a deficit. After the depreciation at A, the price effect dominates and the balance falls to B. As the elasticities rise and the sum of PEDs exceeds one, the volume effect dominates and the balance rises, passing its original level at C. The shape gives the J-curve its name.
YouTube
EconplusDal explains the Marshall–Lerner condition and the J-curve, including why price elasticities rise over time after a depreciation.
Evaluating the effect of a depreciation
The elasticities vary. Countries that export manufactures and services with close substitutes tend to face more elastic demand than countries that export a few primary commodities or that rely on imported fuel, food and medicines, whose demand is very price inelastic.
The improvement can be eroded by inflation. Dearer imports raise costs and wages; if domestic prices rise by as much as the currency fell, the competitive gain disappears.
Other things change. Growth abroad, commodity prices and income flows often move the current account more than the exchange rate does.
The UK after 2016 shows these limits. Sterling depreciated sharply after the referendum on leaving the EU in June 2016. The current account deficit narrowed from 5.1% of GDP in 2016 to 3.3% in 2017, but most of the change came from the income balance, not from trade. The trade deficit in goods and services fell only from US$51 billion to US$36 billion and then stayed at around 1.2% of GDP in 2017–2019, a modest improvement for a large depreciation.
Sources: IMF, World Economic Outlook database (October 2026); World Bank, World Development Indicators, BN.GSR.GNFS.CD, BN.GSR.FCTY.CD and NE.RSB.GNFS.ZS (2026).
Persistent current account surpluses (HL only)
A current account surplus might look like a sign of success, and a strong export sector often is. A large surplus that lasts for many years has costs too, both for the country and for its trading partners, whose deficits are the other side of it.
Why persistent surpluses arise
High national saving. Germany and China have high saving rates: households, firms and (in Germany) the government save much more than the country invests, and the extra saving is lent abroad.
Competitive export industries with strong demand for their products, such as German machinery and cars or Chinese electronics.
An undervalued currency, held below its market level by central bank intervention, or (for Germany) a shared currency, the euro, that is weaker than a German currency would be.
Exports of natural resources, as for Norway, Saudi Arabia and Qatar, especially when commodity prices are high.
In 2025, China’s current account surplus was estimated at about US$724 billion (3.7% of GDP), and Germany’s at about 4.5% of GDP, after a decade in which Germany’s surplus was often above 7%.
Sources: IMF, World Economic Outlook database (October 2026).
Implications of a persistent current account surplus
Domestic consumption and investment
A surplus means the country produces more than it uses: part of its output is sent abroad and the earnings are lent or invested there. Households consume less than they could, and less is invested at home than the country saves. Critics argue that German households and Chinese consumers have had lower living standards than their incomes allow, and that more domestic investment, in infrastructure in Germany or in public services in China, would raise economic well-being.
Exchange rates
A surplus creates excess demand for the currency, so in a floating system the currency tends to appreciate. If the central bank wants to keep the currency from rising, it must sell its own currency and buy foreign currency, adding to its reserves.
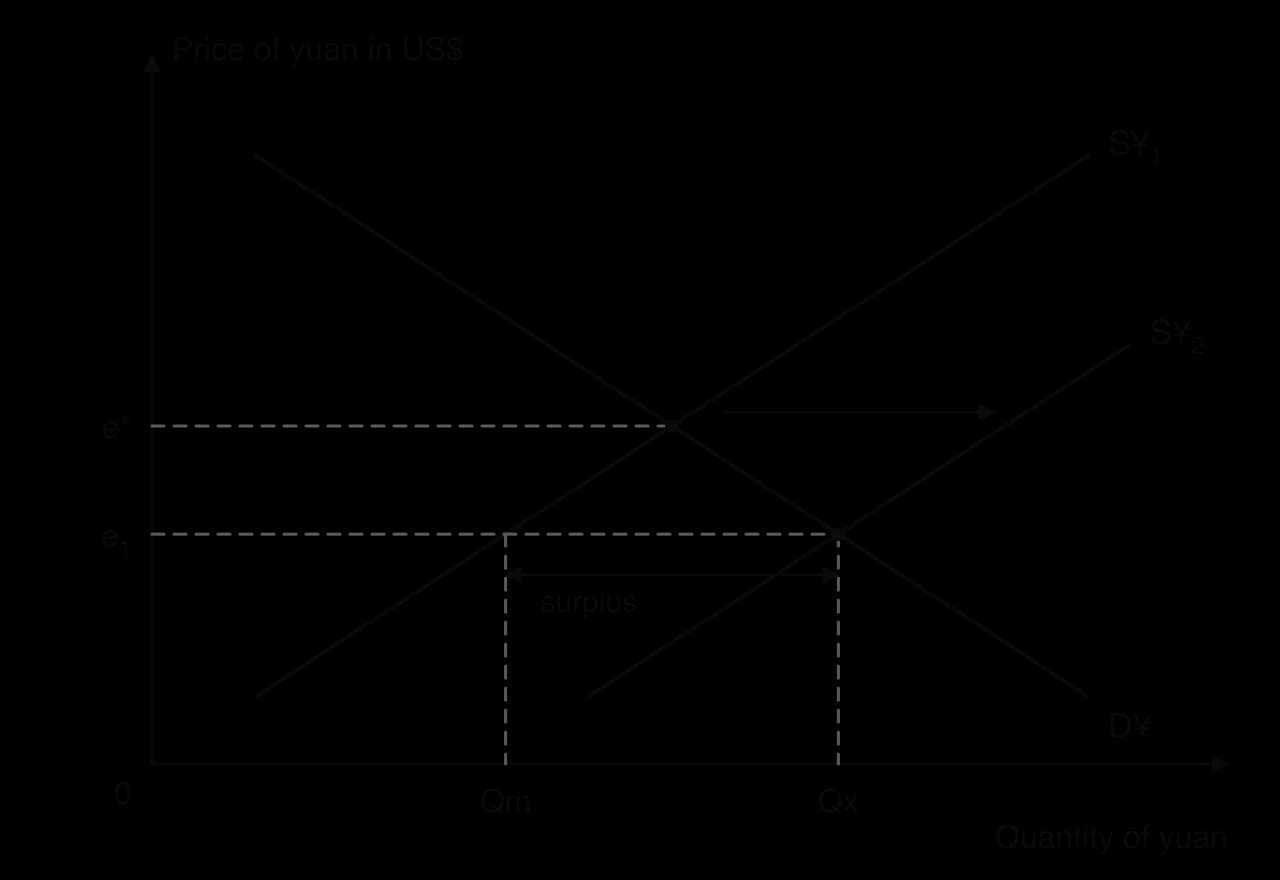
At e₁, demand for yuan from exports (Qx) exceeds supply for imports (Qm): a surplus. To stop the yuan appreciating to e*, the central bank sells yuan for dollars, shifting supply to S¥₂, and its reserves grow.
The diagram shows how a managed exchange rate keeps the currency undervalued. At e₁, export demand for the yuan exceeds the supply of yuan for imports. The People’s Bank of China can hold the rate at e₁ only by supplying the extra yuan itself, shown by the shift from S¥₁ to S¥₂, and buying foreign currency, which adds to its reserves. Trading partners, especially the United States, have often accused China of keeping the yuan undervalued in this way.
Inflation
Export demand is part of aggregate demand, so a large and growing surplus adds to AD and can cause demand-pull inflation if the economy is near full capacity. If the central bank prevents appreciation by creating its own currency to buy foreign currency, the money supply grows, which adds to the inflationary pressure. An appreciation, if it is allowed, has the opposite effect: cheaper imports lower inflation.
Employment
Export industries create jobs, and the surplus supports employment in manufacturing. The jobs depend on demand abroad, however. A recession in trading partners, new tariffs or an appreciation can cause large job losses, so an economy that relies on its surplus is exposed to shocks from outside.
Export competitiveness
If the surplus causes the currency to appreciate, exports become dearer for foreign buyers and imports cheaper at home, so export competitiveness falls over time. Firms then need to raise productivity or quality to keep their markets. Persistent surpluses also cause tension with trading partners: because the world’s current accounts sum to zero, one country’s surplus is another’s deficit, and countries with deficits may respond with tariffs and other protection, as the US–China trade conflict since 2018 shows.
Is a persistent surplus a problem?
For an economy with an ageing population, such as Germany, saving now and investing abroad can be a sensible way to provide for future pensions, and a surplus earned by an oil exporter can turn a depleting natural resource into a lasting stock of foreign assets, as Norway’s fund does. A surplus caused by weak domestic demand, an undervalued currency and low wages, on the other hand, holds down living standards at home and adds to imbalances abroad. As with deficits, the judgment depends on the cause and on what the country does with the surplus.
Key concepts in the balance of payments
Key concept
How it applies
Interdependence
Every current account deficit is matched by surpluses elsewhere in the world; one country’s borrowing is another’s lending.
Sustainability
A deficit can last only as long as foreign lenders are willing to finance it; a debt that grows faster than income is not sustainable.
Intervention
Governments and central banks use reserves, interest rates, tariffs and devaluations to change the exchange rate and the current account.
Change
Elasticities, and so the effect of a depreciation, change over time, which gives the J-curve its shape.
Economic well-being
A persistent surplus can mean lower consumption at home; a deficit crisis can cause shortages of imported essentials.
These concepts are closely linked. Change in the exchange rate is a form of adjustment, and when intervention blocks it, the pressure shows up elsewhere, in reserves, interest rates or debt.
Case study: Sri Lanka’s balance of payments crisis, 2019–2024
Sri Lanka ran a current account deficit in every year from 2012 to 2022, typically between 1.4% and 5.7% of GDP. Like many middle-income economies, it financed these deficits largely by borrowing abroad in US dollars, including through international sovereign bonds, and it managed its exchange rate against the dollar. Its foreign currency earnings came mainly from exports of clothing and tea, from tourism and from remittances sent by Sri Lankans working abroad.
What happened
Several shocks hit the current account and the financial account at once. Tourism receipts fell from US$5.6 billion in 2018 to US$4.7 billion in 2019, after the Easter Sunday bombings in April 2019, and then to US$1.1 billion in 2020 as COVID-19 closed borders. In late 2019 the government cut taxes sharply, reducing the VAT rate to 8% and the corporate tax rate from 28% to 24%, which widened the budget deficit.
Credit rating agencies downgraded Sri Lanka, which made it much harder and more expensive to borrow on international bond markets. In April 2021 the government banned imported chemical fertiliser; farm output fell and rice had to be imported before the ban was abandoned in November 2021.
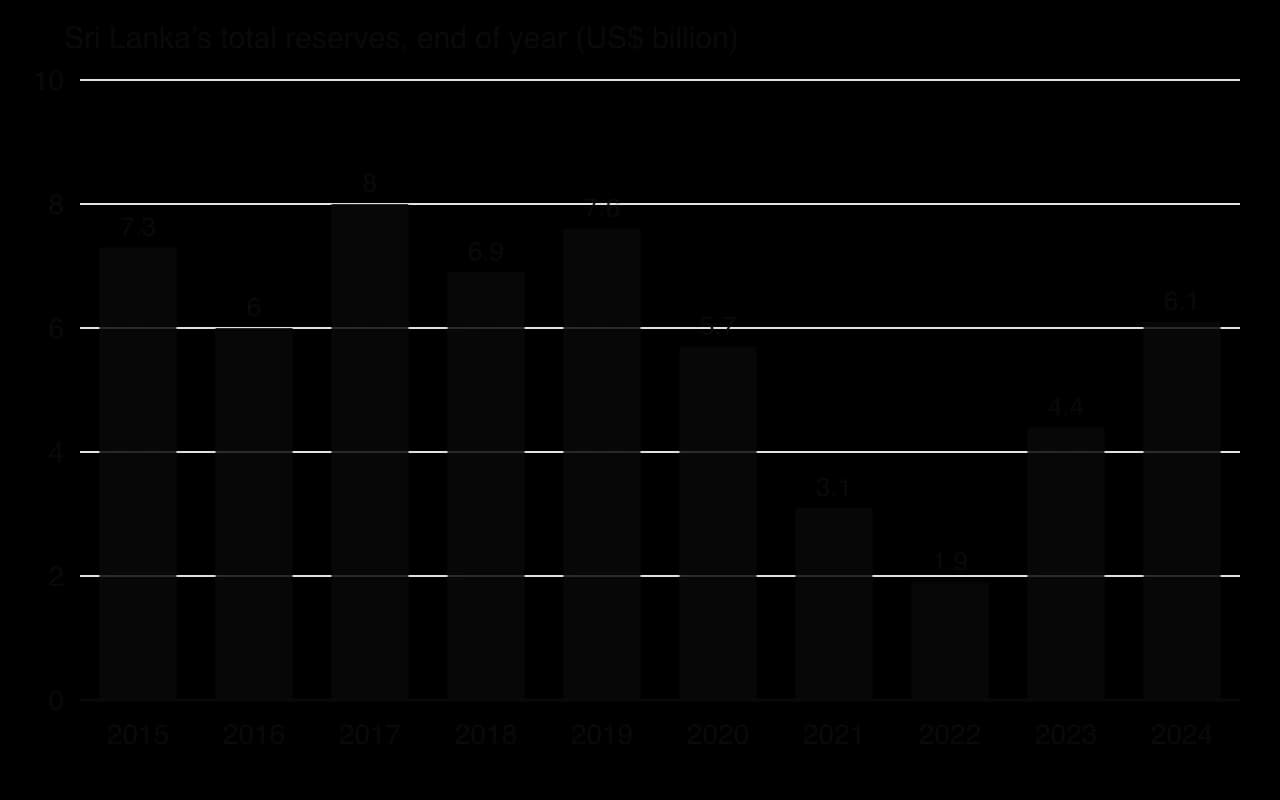
With export earnings down and foreign lending drying up, the central bank used its reserves to pay for imports and debt service and to hold the rupee at about 200 per dollar. Total reserves fell from US$7.6 billion at the end of 2019 to US$3.1 billion at the end of 2021.
Reserves fell from US$7.6 bn in 2019 to US$1.9 bn in 2022, too little to pay for a few months of imports, then recovered after the 2022 default and the 2023 IMF programme. Source: World Bank, WDI, FI.RES.TOTL.CD (IMF data), 2026.
The chart shows reserves being run down to defend the exchange rate and pay for imports, and rebuilt only after the crisis.
In March 2022 the central bank let the rupee fall: the official rate moved to about Rs 230 per dollar on 7 March and about Rs 355 by early April. On 12 April 2022 the government announced that it would suspend payments on its external debt of about US$51 billion. Fuel and medicines ran short, power cuts reached 15 hours a day, and mass protests led the president to resign in July 2022.
The table sets the reserves beside the other main indicators, showing how the currency, prices and output moved as the reserves ran out.
Sri Lanka
2019
2020
2021
2022
2023
2024
Current account balance (% of GDP)
−2.1
−1.4
−3.7
−2.0
+1.7
+1.2
Total reserves, end of year (US$ bn)
7.6
5.7
3.1
1.9
4.4
6.1
Exchange rate (rupees per US$, yearly average)
178.7
185.6
198.8
322.6
327.5
302.1
Inflation (consumer prices, %)
3.5
6.2
7.0
49.7
16.5
−0.4
Real GDP growth (%)
−0.2
−4.6
4.2
−7.3
−2.0
5.0
Sources: World Bank, World Development Indicators: BN.CAB.XOKA.GD.ZS, FI.RES.TOTL.CD, PA.NUS.FCRF, FP.CPI.TOTL.ZG, NY.GDP.MKTP.KD.ZG, ST.INT.RCPT.CD (2026).
What the theory explains
Sri Lanka shows the balance of payments identity under strain. A current account deficit must be matched by financial account inflows or by a fall in reserves. When the downgrades and the pandemic stopped new borrowing (a financial account sudden stop), the deficit could be financed only from reserves, so reserves fell year after year. Holding the rupee near 200 per dollar made the problem worse: it kept imports cheap and drained reserves faster, as in a fixed exchange rate under pressure.
When the reserves ran out, adjustment was forced. On yearly averages, a US dollar cost about 62% more rupees in 2022 than in 2021 (the rupee lost about 38% of its value), an expenditure-switching shock that the government no longer controlled. Because many of Sri Lanka’s imports were essentials such as fuel, food and medicines, demand for them was very price inelastic, so the depreciation raised their rupee cost sharply and fed straight into inflation of almost 50% in 2022. The current account deficit narrowed in 2022 largely because the country could not pay for imports, which is expenditure reducing at its most painful: real GDP fell by 7.3%.
Most of the implications of a persistent deficit appeared at the same time, as the table shows.
Implication of a persistent deficit
Sri Lanka, 2019–2022
Exchange rate
Held near 200 rupees per US$ until reserves ran out, then a fall to about 323 on the 2022 average
Debt
Dollar debt became much harder to repay as the rupee fell; external debt payments suspended in April 2022
Credit ratings
Downgrades closed off new borrowing on international bond markets before the default
Demand management
Policy was dictated by the crisis: imports were cut because they could not be paid for
Economic growth
Real GDP fell by 7.3% in 2022 and by 2.0% in 2023
In March 2023 the IMF approved a loan of about US$3 billion under an Extended Fund Facility, a form of official borrowing, with conditions that included large tax increases: the VAT rate, cut to 8% in 2019, was raised in steps to 18%. By 2023 the current account was in surplus, reserves had begun to recover and inflation fell, turning slightly negative in 2024; growth returned at about 5% in 2024 and 2025.
What the case shows, and its limits
The case shows that the danger of a current account deficit depends less on its size than on how it is financed. Sri Lanka’s deficits were not unusually large as a share of GDP, smaller than the UK’s in some years, yet they ended in default, because they were financed by foreign-currency borrowing, reserves were small and confidence was lost. The United States runs deficits of similar or larger size relative to GDP with no such risk, because it borrows in its own currency.
The case has limits as evidence. The crisis was also a fiscal crisis, driven by tax cuts and a large budget deficit, and a policy crisis, made worse by the fertiliser ban; the balance of payments was where these problems became visible.
Sri Lanka’s recovery also shows that adjustment can be quick once financing returns, though the cost fell heavily on households through inflation and lost incomes. The 2026 oil price shock is a new test: Brent crude averaged about US$71 a barrel in February 2026 and US$117 in April, and IMF projections published in October 2026 show Sri Lanka’s current account moving from a surplus of 1.6% of GDP in 2025 to a small deficit in 2026.
Sources: World Bank, WDI (2026); IMF, World Economic Outlook database (October 2026); Federal Reserve Bank of St Louis, FRED, MCOILBRENTEU (2026); Wikipedia, “Sri Lankan economic crisis (2019–present)”, citing the Central Bank of Sri Lanka and IMF (accessed 2026).
Exam practice
The balance of payments appears in every paper. Paper 2 often gives balance of payments data for a country and asks you to define an account [2] or calculate a balance or a missing item [2–3]. Paper 1 questions at SL ask you to explain the structure of the accounts and how they are linked; HL Paper 1 and Paper 3 add the exchange rate links, persistent deficits and surpluses, policies to correct a deficit and the Marshall–Lerner condition with the J-curve.
Data questions often give the capital and financial accounts as well and ask for a missing figure, as in the Country B example; the method is the identity, with an increase in reserve assets entered as a debit.
Paper 2 can also link balance of payments data to the SL exchange rate diagram, for example: “Using an exchange rate diagram, explain how a fall in tourism revenue could cause the rupee to depreciate [4].” The answer shows a leftward shift of the demand for rupees (fewer foreign tourists buying rupees), a lower exchange rate, and two or three sentences linking the shift to the text.
Paper 3 part (b) may then ask you to recommend a policy to reduce a persistent current account deficit [10]. A strong recommendation names one main policy, explains how it works with theory and the case’s data (the elasticities, the size of the deficit, inflation, unemployment), weighs its costs and an alternative, and ends with a clear recommendation, for example a managed depreciation with supply-side measures if the Marshall–Lerner condition holds and inflation is low.
Summary
The balance of payments records all transactions between a country’s residents and the rest of the world; money flowing in is a credit (+), money flowing out a debit (−).
The current account covers trade in goods, trade in services, income and current transfers; the capital account covers capital transfers and non-produced, non-financial assets; the financial account covers FDI, portfolio investment, reserve assets and official borrowing.
The balance of payments always sums to zero: a current account deficit is matched by a surplus on the capital and financial accounts, with net errors and omissions closing any gap.
HL: current account flows and financial account flows both drive the demand for and supply of a currency, so the accounts and the exchange rate affect each other.
HL: a persistent deficit can put pressure on the exchange rate, raise interest rates, increase foreign ownership and debt, lower credit ratings and constrain policy; how serious it is depends on its size, cause and financing.
HL: a deficit can be reduced by expenditure switching, expenditure reducing or supply-side policies, each with trade-offs and time lags.
HL: a depreciation improves the current account only if PEDx + PEDm > 1 (Marshall–Lerner), and usually worsens it first (the J-curve).
HL: a persistent surplus can hold down domestic consumption and investment, cause appreciation and inflationary pressure, support export jobs and create tension with trading partners.
Self-check
To do:
I can define the balance of payments and classify any transaction as a credit or a debit.
To do:
I can describe the components of the current, capital and financial accounts.
To do:
I can calculate the balance on each account and a missing item, such as net errors and omissions, from data.
To do:
I can explain why the balance of payments always sums to zero and why a current account deficit is matched by a surplus elsewhere.
To do:
I can draw and explain an exchange rate diagram linking the current account and financial account to the exchange rate (HL).
To do:
I can evaluate the implications of a persistent current account deficit and of a persistent surplus, using real examples (HL).
To do:
I can evaluate expenditure-switching, expenditure-reducing and supply-side policies to correct a deficit (HL).
To do:
I can state the Marshall–Lerner condition, use it in a calculation and draw the J-curve (HL).
108
126
Table 2: Selvara's current account, 2024 (US$ million)
Item
Value
Exports of goods
1200
Imports of goods
2870
Balance of trade in services
−380
Net primary income
−210
Net secondary income (including remittances)
1260
Current account balance
Text B — The cotton economy
[1] Around 900 000 farm households grow cotton, which provides about 40 % of Selvara's earnings from goods exports. Almost all of it is exported as raw lint to spinning mills in Asia.
[2] In 2024, large harvests in the major producing countries and the growing use of synthetic fibres by clothing makers pushed the world price of cotton lint down from US$1.90 to US$1.52 per kg. Selvara's cotton export volume rose from 300 million kg to 315 million kg.
[3] Cotton farmers' incomes fell, and many families withdrew their children from secondary school. The farmers' association says that, because demand for raw cotton is price inelastic, good harvests around the world hurt farmers.
[4] The government hopes to attract investors to build spinning mills and garment factories, so that more of the value of cotton is added in Selvara. However, electricity supply is unreliable, transport costs to the nearest seaport are high, and few workers have technical skills. Selvara's garments would compete with exports from well-established Asian producers. Selvara does, however, have duty-free access for garments to several high-income markets under preferential trade schemes, and wage costs are among the lowest in the region.
[5] Some farmers have started to grow organic cotton, which sells for a premium of about 25 % over conventional cotton, although yields are lower and certification is expensive.
Text C — A growing urban middle class
[1] In the capital, a growing middle class works in banking, telecommunications and government. In 2024 average urban household income rose by 7 % in real terms, while average rural household income fell by 3 %.
[2] Urban households are spending more on restaurant meals, private schooling, mobile data and travel, all of which have income elastic demand. Restaurant owners report that their prices are rising quickly because the number of restaurants has not kept up with demand.
[3] Demand for maize flour, the staple food of poorer households, has hardly changed in the cities. Several mobile banking firms have expanded into rural areas, making it cheaper for families to receive remittances.
[4] The government's new development plan aims to raise the share of manufacturing in GDP from 8 % to 15 % by 2035 and to connect every district town to the national electricity grid. Critics point out that spending on rural roads and agricultural extension services has been cut to pay for the plan.
(a)(i)
Define the term cost-push inflation indicated in bold in the text (Text A, paragraph 2).
[2]2 marks
Markscheme (a)(i)
Vague definition [1]: The idea that it is inflation caused by higher costs.
Accurate definition [2]: An understanding that it is a sustained increase in the average (general) price level caused by an increase in costs of production (such as wages or the prices of imported raw materials and energy), shown as a leftward shift of SRAS.
(a)(ii)
Define the term income elastic indicated in bold in the text (Text C, paragraph 2).
[2]2 marks
Markscheme (a)(ii)
Vague definition [1]: The idea that demand changes a lot when income changes.
Accurate definition [2]: An understanding that demand is income elastic when a change in income leads to a proportionately larger change in quantity demanded / YED is greater than 1.
(b)(i)
Using information from Text B, calculate the price elasticity of demand for Selvara's cotton exports (Text B, paragraph 2).
[2]2 marks
Markscheme (b)(i)
%ΔP=1.901.52−1.90×100=−20%
%ΔQd=300315−300×100=5%
PED=−205=−0.25
[1] for valid working, [1] for the correct answer. Accept −0.25 or 0.25.
An answer of 0.25 without working is sufficient for [1]. A response in which the formula is inverted should be awarded [0]. A response expressed as a percentage is a units error.
(b)(ii)
Using your answer to (b)(i), state whether Selvara's export revenue from cotton rose or fell in 2024.
[1]1 mark
Markscheme (b)(ii)
Fell, because demand is price inelastic (the percentage rise in quantity is smaller than the percentage fall in price) [1].
(Revenue fell from US$570 million to US$478.8 million.)
OFR applies. Working not required.
(b)(iii)
Using information from Table 2, calculate Selvara's current account balance in 2024.
[2]2 marks
Markscheme (b)(iii)
1200−2870−380−210+1260=−1000
Current account balance = −US$1000 million (a deficit of US$1 billion).
[1] for valid working, [1] for the correct answer, which must show a deficit/negative value.
An answer of −1000 without working is sufficient for [1]. Award [1] if one item is omitted or has the wrong sign but the working is otherwise correct.
(c)
Using an aggregate demand/aggregate supply (AD/AS) diagram, explain how higher prices of imported fuel and fertilizer contributed to higher inflation in Selvara (Text A, paragraph 2).
[4]4 marks
Markscheme (c)
Level 1 [1–2]: There is a correct diagram OR an accurate written response.
Level 2 [3–4]: There is a correct diagram AND an accurate written response.
For Level 2, responses should include:
Diagram: SRAS shifting left from SRAS1 to SRAS2, showing the average price level rising from P1 to P2 and real output falling from Y1 to Y2.
Explanation: the depreciation of the shilling (from SVS 108 to SVS 126 per US$) raised the shilling price of imported fuel and fertilizer; these are important inputs for farmers, transport and industry, so costs of production rose and SRAS fell; the result is a higher average price level (inflation rose from 4.0 % to 9.6 %) and lower real output.
Candidates who incorrectly label diagrams can be awarded a maximum of [3].
Vertical axis: average price level/price level/CPI; horizontal axis: real output/real GDP/real national income.
(d)
Using an exchange rate diagram, explain how the fall in the world price of cotton may have contributed to the depreciation of the Selvaran shilling (Text A, paragraph 2 and Text B, paragraph 2).
[4]4 marks
Markscheme (d)
Level 1 [1–2]: There is a correct diagram OR an accurate written response.
Level 2 [3–4]: There is a correct diagram AND an accurate written response.
For Level 2, responses should include:
Diagram: a foreign exchange market for SVS with demand for SVS shifting left from D1 to D2, showing the exchange rate (US$ per SVS) falling from ER1 to ER2.
Explanation: foreign buyers of cotton must buy shillings to pay Selvaran exporters (or exporters convert their US$ earnings into shillings); because demand for cotton is price inelastic, the lower world price reduced export revenue (part (b)(ii)), so fewer US dollars were converted into shillings; lower demand for the shilling caused it to depreciate.
Candidates who incorrectly label diagrams can be awarded a maximum of [3].
Vertical axis: exchange rate/price of SVS in US$/US$ per SVS; horizontal axis: quantity of SVS.
(e)
Using a demand and supply diagram, explain the effect of rising urban incomes on the price of restaurant meals in Selvara's capital (Text C, paragraphs 1 and 2).
[4]4 marks
Markscheme (e)
Level 1 [1–2]: There is a correct diagram OR an accurate written response.
Level 2 [3–4]: There is a correct diagram AND an accurate written response.
For Level 2, responses should include:
Diagram: a demand and supply diagram for restaurant meals with demand shifting right from D1 to D2 and a relatively steep (inelastic) supply curve, showing the price rising from P1 to P2 and quantity rising from Q1 to Q2.
Explanation: urban incomes rose by 7 %; restaurant meals have income elastic demand (YED > 1), so demand rises proportionately more than income; because the number of restaurants has not kept up (supply is relatively inelastic in the short run), the increase in demand leads mainly to a rise in price.
Candidates who incorrectly label diagrams can be awarded a maximum of [3].
Using a Lorenz curve diagram, explain how the changes in urban and rural incomes in 2024 are likely to affect income inequality in Selvara (Text A, paragraph 4 and Text C, paragraph 1).
[4]4 marks
Markscheme (f)
Level 1 [1–2]: There is a correct diagram OR an accurate written response.
Level 2 [3–4]: There is a correct diagram AND an accurate written response.
For Level 2, responses should include:
Diagram: a Lorenz curve diagram with the line of equality and the Lorenz curve moving further away from it (from L1 to L2), indicating a higher Gini coefficient.
Explanation: most low-income households live in rural areas and depend on cotton and other farming; rural incomes fell by 3 % (partly because cotton prices fell), while urban middle-class incomes rose by 7 %; the share of national income received by the poorest groups falls and the share of richer groups rises, so the Lorenz curve moves further from the line of equality and the Gini coefficient rises (as it did from 0.38 to 0.44).
Candidates who incorrectly label diagrams can be awarded a maximum of [3].
Vertical axis: cumulative % of income; horizontal axis: cumulative % of population (households).
(g)
Using information from the text/data and your knowledge of economics, discuss the view that Selvara should reduce its dependence on raw cotton exports in order to achieve economic growth and economic development.
[15]15 marks
Markscheme (g)
Discuss requires candidates to offer a considered and balanced review that includes a range of arguments, factors or hypotheses.
Answers may include:
Terminology: economic growth, economic development, primary commodity, diversification, PED, YED, price volatility, value added, comparative advantage, infrastructure, human capital, current account deficit.
Diagrams: demand and supply with inelastic demand showing a large price fall after a supply increase; exchange rate diagram (part (d)); AD/AS showing growth from investment; PPC shifting outward. N.B. Diagrams given in earlier parts and referred to here should be rewarded.
Theory: dependence on a primary commodity with low PED makes export earnings volatile; low YED for many commodities means demand grows slowly as world incomes rise; diversification and processing add value.
Arguments for reducing dependence:
cotton provides 40 % of goods export earnings (Text B, paragraph 1), and with PED of −0.25 a 20 % price fall cut export revenue by 16 % (part (b)), slowing growth from 5.6 % to 3.1 % (Table 1);
falling export earnings weakened the shilling (part (d)), raising import prices and inflation to 9.6 % (Text A, paragraph 2);
demand for cotton faces long-term competition from synthetic fibres (Text B, paragraph 2);
volatile farm incomes damage development: families withdrew children from school (Text B, paragraph 3), and rural incomes fell while urban incomes rose, widening inequality (Text C, paragraph 1);
processing cotton into yarn and garments would add value, create manufacturing jobs and reduce the current account deficit of US$1000 million (Table 2);
services with income elastic demand (Text C, paragraph 2) are growing and could provide alternative employment.
Arguments against / limitations:
Selvara may have a comparative advantage in cotton; 900 000 households depend on it (Text B, paragraph 1), and diversification takes time and may cause structural unemployment;
Question 2 · ECON-0045040 marks
Read the extracts and answer the questions that follow.
Text A — Overview of Matanga
[1] Matanga is a lower-middle-income economy in East Africa with a population of 31 million. Agriculture employs about 60 % of the workforce but produces only 22 % of GDP. Around 38 % of the population lives below the national poverty line.
[2] Real GDP grew by more than 5 % a year between 2022 and 2024. However, inflation rose to 11.6 % in 2024, driven mainly by higher prices of imported fuel and fertilizer. The Matangan shilling (MTS), which floats freely, depreciated sharply against the US dollar.
[3] Matanga has a persistent current account deficit, because its spending on imported fuel, machinery and food is greater than its earnings from exports, which come mainly from tea, coffee and fresh produce.
Table 1: Economic data for Matanga, 2022–2024
Indicator
2022
2023
2024
Real GDP growth (%)
5.1
5.6
5.3
Inflation (annual % change in consumer price index)
6.2
9.1
11.6
Exchange rate (MTS per US$)
110
132
140
Current account balance (% of GDP)
−5.2
−6.8
−6.1
Population below national poverty line (%)
39
38
38
Text B — Mangoes from Matanga
[1] About 400 000 smallholder households grow mangoes, mostly on plots of less than one hectare. Grafted mango trees take four to five years to produce a full crop, and the harvest lasts only about three months. Because there are few cold stores and many rural roads are poor, up to 40 % of the harvest rots before it can be sold.
[2] At the peak of the harvest, farmers have to sell their fruit quickly, whatever the price, and local prices often fall by more than half within a few weeks.
[3] Table 2 shows Matanga's mango exports in 2022 and 2023.
Table 2: Mango exports from Matanga, 2022 and 2023
2022
2023
Average export price (US$ per kg)
0.80
1.00
Export volume (tonnes)
60 000
63 000
[4] In 2024 a foreign firm, Verano Fresh, opened a cold store and pack-house near the main growing region. Mangoes can now be stored for up to four weeks, so exporters can hold back fruit when prices are low and sell more when prices rise.
Text C — Promoting horticultural exports
[1] The government's National Export Strategy (2023–2030) aims to double exports of fruit, vegetables and flowers. It offers ten-year tax holidays for foreign direct investment (FDI) in food processing and cold storage, and it plans to upgrade 2 000 km of rural roads with a loan from the World Bank.
[2] Supporters say horticulture creates jobs for women and young people and earns foreign currency. Verano Fresh employs 1 200 workers and buys fruit from 15 000 farmers.
[3] Critics point out that most of Matanga's mangoes are sold to a few supermarket chains in Europe, that the tax holidays reduce government revenue, and that Verano Fresh sends most of its profits to its parent company abroad. Farmers' groups complain that they receive only about 15 % of the final retail price of their mangoes. Irrigation is also increasing the use of water in areas already affected by drought.
(a)(i)
Define the term current account deficit indicated in bold in the text (Text A, paragraph 3).
[2]2 marks
(a)(ii)
Define the term foreign direct investment (FDI) indicated in bold in the text (Text C, paragraph 1).
[2]2 marks
(b)(i)
Using information from Table 2, calculate the price elasticity of supply (PES) of Matanga's mango exports between 2022 and 2023.
[2]2 marks
(b)(ii)
Using information from Table 1 and Table 2, calculate the change in Matanga's export revenue from mangoes, in MTS million, between 2022 and 2023.
[3]3 marks
(c)
Using an AD/AS diagram, explain how higher prices of imported fuel and fertilizer may have contributed to inflation in Matanga (Text A, paragraph 2).
[4]4 marks
(d)
Using an exchange rate diagram, explain how an increase in foreign direct investment in Matanga's food processing and cold storage could affect the value of the Matangan shilling (Text C, paragraph 1).
[4]4 marks
(e)
Using a demand and supply diagram, explain how the new cold store could reduce the fall in mango prices at the peak of the harvest (Text B, paragraphs 2 and 4).
Read the extracts and answer the questions that follow.
Text A — Overview of Talvenor
[1] Talvenor is a lower-middle-income country on the coast of West Africa with a population of 9.6 million. Its economy depends on fishing, cocoa and tourism. Real gross domestic product (GDP) grew by an average of 5.8 % a year between 2015 and 2019, before tourism collapsed in 2020. Growth has since recovered (Table 1).
[2] Rising prices of imported fuel and food pushed inflation up in 2023 and 2024. In response, the central bank raised its base interest rate from 6 % to 9 %. Business groups warned that higher borrowing costs would delay investment in hotels and fish-processing plants.
[3] Talvenor has a persistent current account deficit. Fish and fish products make up 31 % of export revenue and cocoa 24 %, while fuel, food and machinery dominate imports. The exchange rate of the tal (TLV) floats freely, and the tal has lost value against the US dollar since 2021 (Table 1).
[4] About 34 % of the population lives below the national poverty line. Poverty rates are highest in coastal fishing villages, where few households have access to piped water or secondary schools.
[5] The government's budget deficit reached 5.1 % of GDP in 2024, partly because of fuel subsidies and higher interest payments on its debt. The International Monetary Fund has urged the government to broaden its tax base and to reduce spending that does not support long-term growth.
Table 1: Economic data for Talvenor
2021
2024
Real GDP growth (%)
3.9
4.6
Inflation (annual % change in consumer price index)
5.2
9.8
Labour force (million)
4.10
4.35
Number unemployed (thousand)
369
413
Unemployment rate (% of labour force)
9.0
Exchange rate (TLV per US$)
410
525
Text B — Overfishing in Talvenor's waters
[1] Talvenor's coastal waters are rich in sardines and tuna. Fish supply about 60 % of the animal protein in Talvenorian diets, and an estimated 210 000 people work in small-scale fishing, fish smoking and fish trading, many of them women.
[2] Since 2010 the government has sold licences allowing foreign industrial trawlers to fish in its waters, earning about US$62 million a year. The total catch rose at first but has since fallen (Table 2). Small-scale fishers report that their catch per trip has fallen by around 40 % in ten years.
[3] The government pays fuel subsidies to owners of small fishing boats, which allow them to travel further and fish for longer. A growing share of the sardine catch is also bought by factories that turn it into fishmeal for export, to feed farmed fish in other countries. The price of fresh sardines in local markets has doubled since 2019.
[4] In 2025 the government proposed a two-month closed season each year, a 50 % cut in the number of trawler licences and a gradual end to fuel subsidies. Fishers' associations support the cut in trawler licences but oppose the closed season. Instead, they ask for coastal zones in which only local communities, applying their own rules, may fish.
[5] Monitoring is a major problem. Talvenor's navy has four patrol boats to cover more than 500 km of coastline, and some trawlers switch off their tracking devices to fish illegally in areas reserved for small boats. Neighbouring countries share the same sardine stocks, which migrate along the coast, but there is no regional agreement on catch limits.
Table 2: Total fish catch in Talvenor's waters (thousand tonnes)
2014
2019
2024
420
455
352
Text C — Coral reefs and tourism
[1] Tourism accounts for about 12 % of Talvenor's GDP. Many visitors come to dive on the coral reefs off the southern coast. The reefs also act as breeding grounds for fish and protect the coast from storm damage.
[2] The reefs are being damaged by overfishing, by untreated sewage from hotels and coastal towns, and by rising sea temperatures. Surveys show that live coral cover on the main reefs fell from 48 % in 2010 to 29 % in 2024.
[3] The government plans to charge each foreign tourist a levy of US$20 on arrival and to use the revenue to fund marine protected areas and sewage treatment. The hotel association fears that the levy will push visitors towards beaches in neighbouring countries, which are already cheaper.
[4] Supporters of the levy point to a survey in which most divers said they would pay more to visit healthy reefs. They also argue that, without action, Talvenor risks losing both its tourism industry and the fish nurseries on which coastal communities depend.
(a)(i)
Define the term current account deficit indicated in bold in the text (Text A, paragraph 3).
[2]2 marks
(a)(ii)
Define the term subsidies indicated in bold in the text (Text B, paragraph 3).
[2]2 marks
(b)(i)
Using information from Table 1, calculate Talvenor's unemployment rate in 2024.
[2]2 marks
(b)(ii)
Using information from Table 2, calculate the percentage change in the total fish catch between 2019 and 2024.
[2]2 marks
(b)(iii)
Using information from Table 1, state whether the tal appreciated or depreciated against the US dollar between 2021 and 2024.
[1]1 mark
(c)
Using an AD/AS diagram, explain the likely effect on Talvenor's real GDP of the rise in the central bank's base interest rate (Text A, paragraph 2).
[4]4 marks
(d)
Using an exchange rate diagram, explain how higher prices of imported fuel could have contributed to the depreciation of the tal (Text A, paragraphs 2 and 3).
the barriers to processing are serious: unreliable electricity, high transport costs as a landlocked country, few technical skills and strong Asian competition (Text B, paragraph 4);
garment manufacturing may offer low wages and poor conditions; services growth is concentrated in the capital;
alternatives that address volatility without abandoning cotton: crop insurance, improved yields, farmer cooperatives, regional trade agreements, remittances and mobile banking (Text C, paragraph 3);
growth and development may conflict: diversification led by urban services may raise GDP while increasing inequality.
Synthesis/evaluation: short run versus long run; stakeholders (cotton farmers, urban workers, the government, foreign investors); the need for investment in infrastructure and human capital before diversification can succeed; a reasoned conclusion.
A maximum of [9] should be awarded if only economic growth or only economic development is discussed.
Examiners should be aware that candidates may take a different approach which, if appropriate, should be rewarded.
Markbands (best fit)
Level
Marks
Descriptor
0
0
The work does not reach a standard described by the descriptors below.
1
1–3
Little understanding of the demands. Theory is stated but not relevant. Terms are not relevant or are used incorrectly. No synthesis or evaluation. No use of the text/data, or it is merely copied.
2
4–6
Some understanding of the demands. Relevant theory is described. Some relevant terms are included. Synthesis or evaluation is relevant but superficial. Limited use of the text/data.
3
7–9
The demands are understood but only partially addressed. Theory is partly explained. Some terms are used appropriately. Diagram(s) are included where appropriate. Synthesis or evaluation is appropriate but lacks balance. Some relevant information from the text/data is used.
4
10–12
The demands are understood and addressed. Theory is explained. Terms are used appropriately. Diagram(s) are included and explained. Synthesis or evaluation is mostly balanced. Use of the text/data is generally appropriate, relevant and applied correctly.
5
13–15
The demands are thoroughly understood and addressed. Theory is fully explained. Terms are used appropriately throughout. Diagram(s) are fully explained. Synthesis or evaluation is effective and balanced. The text/data is appropriate, relevant and used to build a reasoned argument supported by analysis and evaluation.
[4]4 marks
(f)
Using a poverty cycle diagram, explain how post-harvest losses can keep smallholder mango farmers in poverty (Text B, paragraph 1).
[4]4 marks
(g)
Using information from the text/data and your knowledge of economics, evaluate Matanga's strategy of promoting horticultural exports as a way of achieving economic growth and economic development.
[15]15 marks
(e)
Using an externalities diagram, explain how the fuel subsidies for small fishing boats may have increased the welfare loss caused by overfishing (Text B, paragraphs 2 and 3).
[4]4 marks
(f)
Using a demand and supply diagram, explain why the price of fresh sardines in Talvenor's local markets has risen (Text B, paragraphs 2 and 3).
[4]4 marks
(g)
Using information from the text/data and your knowledge of economics, discuss whether Talvenor can achieve economic growth while using its fish stocks and coral reefs sustainably.