Explain how exchange rates are set in floating, fixed and managed systems, calculate prices in other currencies and percentage changes, draw the diagrams, and evaluate the effects of a currency’s rise or fall.
Each is in the Economics glossary, with every other term in the subject.
A rise in the value of a currency in a floating exchange rate system, caused by market forces, so that one unit buys more of another currency.
Borrowing in a currency with a low interest rate to buy assets in a currency with a higher interest rate, profiting from the interest rate difference as long as the exchange rate does not move against the trade.
Buying or selling of its own currency by a central bank on the foreign exchange market, using its reserves of foreign currency, to influence the exchange rate.
A fall in the value of a currency in a floating exchange rate system, caused by market forces, so that one unit buys less of another currency.
A decision by the government or central bank to lower the value of its currency in a fixed (or managed) exchange rate system.
Government limits on the amount of foreign currency that residents and firms may buy or take out of the country, used to reduce pressure on a fixed or managed exchange rate.
The price of one currency expressed in terms of another currency, for example US$1.30 per pound.
An exchange rate system in which the government or central bank sets the value of its currency against another currency or a basket of currencies and keeps it there by intervening in the foreign exchange market.
Explain how a floating exchange rate is determined by the demand for and supply of a currency, and draw the diagram.
Calculate the price of a good in another currency and the percentage appreciation or depreciation of a currency from data.
Explain how trade, foreign direct investment, portfolio investment, remittances, speculation, relative inflation, interest and growth rates, and central bank intervention change the demand for and supply of a currency.
Evaluate the consequences of an appreciation or depreciation for inflation, economic growth, unemployment, the current account and living standards, using an AD/AS diagram.
Distinguish between devaluation and revaluation, and explain how a fixed exchange rate is maintained, with a diagram.
Explain how a managed exchange rate works, with a diagram, and why a currency may be overvalued or undervalued.
Evaluate fixed and floating exchange rate systems (HL).
An exchange rate is the price of one currency in terms of another. Because almost every international transaction (selling coffee abroad, buying a foreign company, a holiday, a worker sending money home) needs one currency to be swapped for another, the exchange rate affects the prices of exports and imports, the rate of inflation, output, jobs and the incomes of millions of households.
Exchange rates are a clear example of interdependence: an interest rate decision in the United States can change the yen price of imported goods in Japan within days. They also raise questions of intervention, about whether a central bank should fix or steer the value of its currency or leave it to the market, and of
197 exam-style questions on this subtopic, written in the style of the IB papers. The first has its markscheme open. Counted on
Read the extracts and answer the questions that follow.
Text A — Overview of Rendalia
[1] Rendalia is a lower-middle-income economy in South America with a population of 31 million. Agriculture employs about a quarter of the labour force, and soybeans are its largest export, followed by beef and timber. Tourism, centred on the rainforests and wetlands of the south, has become the fastest-growing source of foreign exchange.
[2] Between 2015 and 2025 the world price of soybeans fell, and foreign investors withdrew funds from Rendalia. As a result, the rendal (RDL) experienced a depreciation against the US dollar (Table 1). Because Rendalia imports most of its fuel and fertilizer, the weaker currency raised firms' costs and inflation rose sharply.
[3] In 2025 the central bank raised its policy interest rate from 5 % to 11 % in an attempt to bring inflation back to its target of 3–5 %. Business groups warned that higher borrowing costs would slow investment and job creation at a time when unemployment was already rising.
[4] Despite slower growth, the share of the population living in extreme poverty has continued to fall, helped by a cash transfer programme for rural households. Inequality remains high, however, particularly between the prosperous soy-growing north and the poorer, more remote south, where many households depend on small-scale farming and seasonal tourism work.
[5] The government's budget deficit widened to 4.8 % of GDP in 2025 as spending on the cash transfer programme rose and revenue from taxes on trade fell. Credit rating agencies have warned that further increases in government debt could raise the cost of borrowing.
Table 1: Economic data for Rendalia
Indicator | 2015 | 2025 |
|---|---|---|
Real GDP growth (annual %) |
One of 61 short multiple-choice questions on 4.5. Pick an answer to see why it's right or wrong.
Why is it easier for a central bank to stop its currency rising than to stop it falling?
The official deck for this part of the syllabus.
Explain why exchange rates matter to an economy.
Explain how exchange rates link to the key concept of interdependence.
With a free account, Augment remembers where you stopped and what you have practiced.
An exchange rate system in which the value of a currency is set by the demand for and supply of it on the foreign exchange market, with no government or central bank intervention.
Investment by a firm in one country to set up, buy or expand a lasting business operation in another country in which it has a controlling interest (usually at least 10% of the voting shares).
The global market in which currencies are bought and sold, and where floating exchange rates are determined by demand and supply.
Holdings of foreign currencies and other liquid foreign assets kept by a central bank, which it can use to buy its own currency and support the exchange rate.
Short-term financial capital that moves quickly between countries in search of the highest interest rate or an expected exchange rate gain.
Inflation caused by higher prices of imported goods and raw materials, often after a depreciation or devaluation of the domestic currency.
The difference between the interest rates in two countries, a major influence on short-term financial flows and so on the exchange rate between their currencies.
An exchange rate system in which the currency floats, but the central bank intervenes from time to time to keep it within a band or to limit large or rapid changes in its value.
A currency whose official or market exchange rate is higher than the rate that would balance demand for and supply of it in a free market, making exports dear and imports cheap.
Cross-border purchases of financial assets such as shares and bonds that do not give the buyer a controlling interest in the firm or institution that issued them.
Money sent home by people working in another country to their families or communities in their country of origin.
A decision by the government or central bank to raise the value of its currency in a fixed (or managed) exchange rate system.
Buying or selling an asset, such as a currency, in order to profit from an expected future change in its price.
A currency whose official or market exchange rate is lower than the rate that would balance demand for and supply of it in a free market, making exports cheap and imports dear.
Every country, or group of countries in a monetary union, has its own currency: the pound sterling (£), the euro (€), the Japanese yen (¥), the Nigerian naira (₦). A UK firm that buys machinery from Japan must pay the Japanese seller in yen, so it first sells pounds and buys yen. The rate at which it swaps them is the exchange rate.
Currencies are bought and sold on the foreign exchange market. It is not one building but a worldwide network of banks, firms, central banks, investment funds and currency dealers, linked electronically and trading around the clock on weekdays. It is by far the largest financial market in the world, and most of its trading is between banks and financial institutions rather than for trade in goods.
An exchange rate always involves two currencies, so it can be written either way round. If £1 buys US$1.30, then US$1 buys £1 ÷ 1.30 = £0.77. Both statements describe the same rate, and each is the reciprocal of the other (1 divided by it). Financial news usually quotes the yen as “yen per dollar” (¥150 per US$) but the pound and the euro as “dollars per pound” or “dollars per euro”.
The way a rate is quoted matters for interpreting changes. A rise in the number of yen per dollar, from ¥115 to ¥160, means the yen has become weaker: more yen are needed to buy each dollar. A rise in the number of dollars per pound, from US$1.20 to US$1.30, means the pound has become stronger.
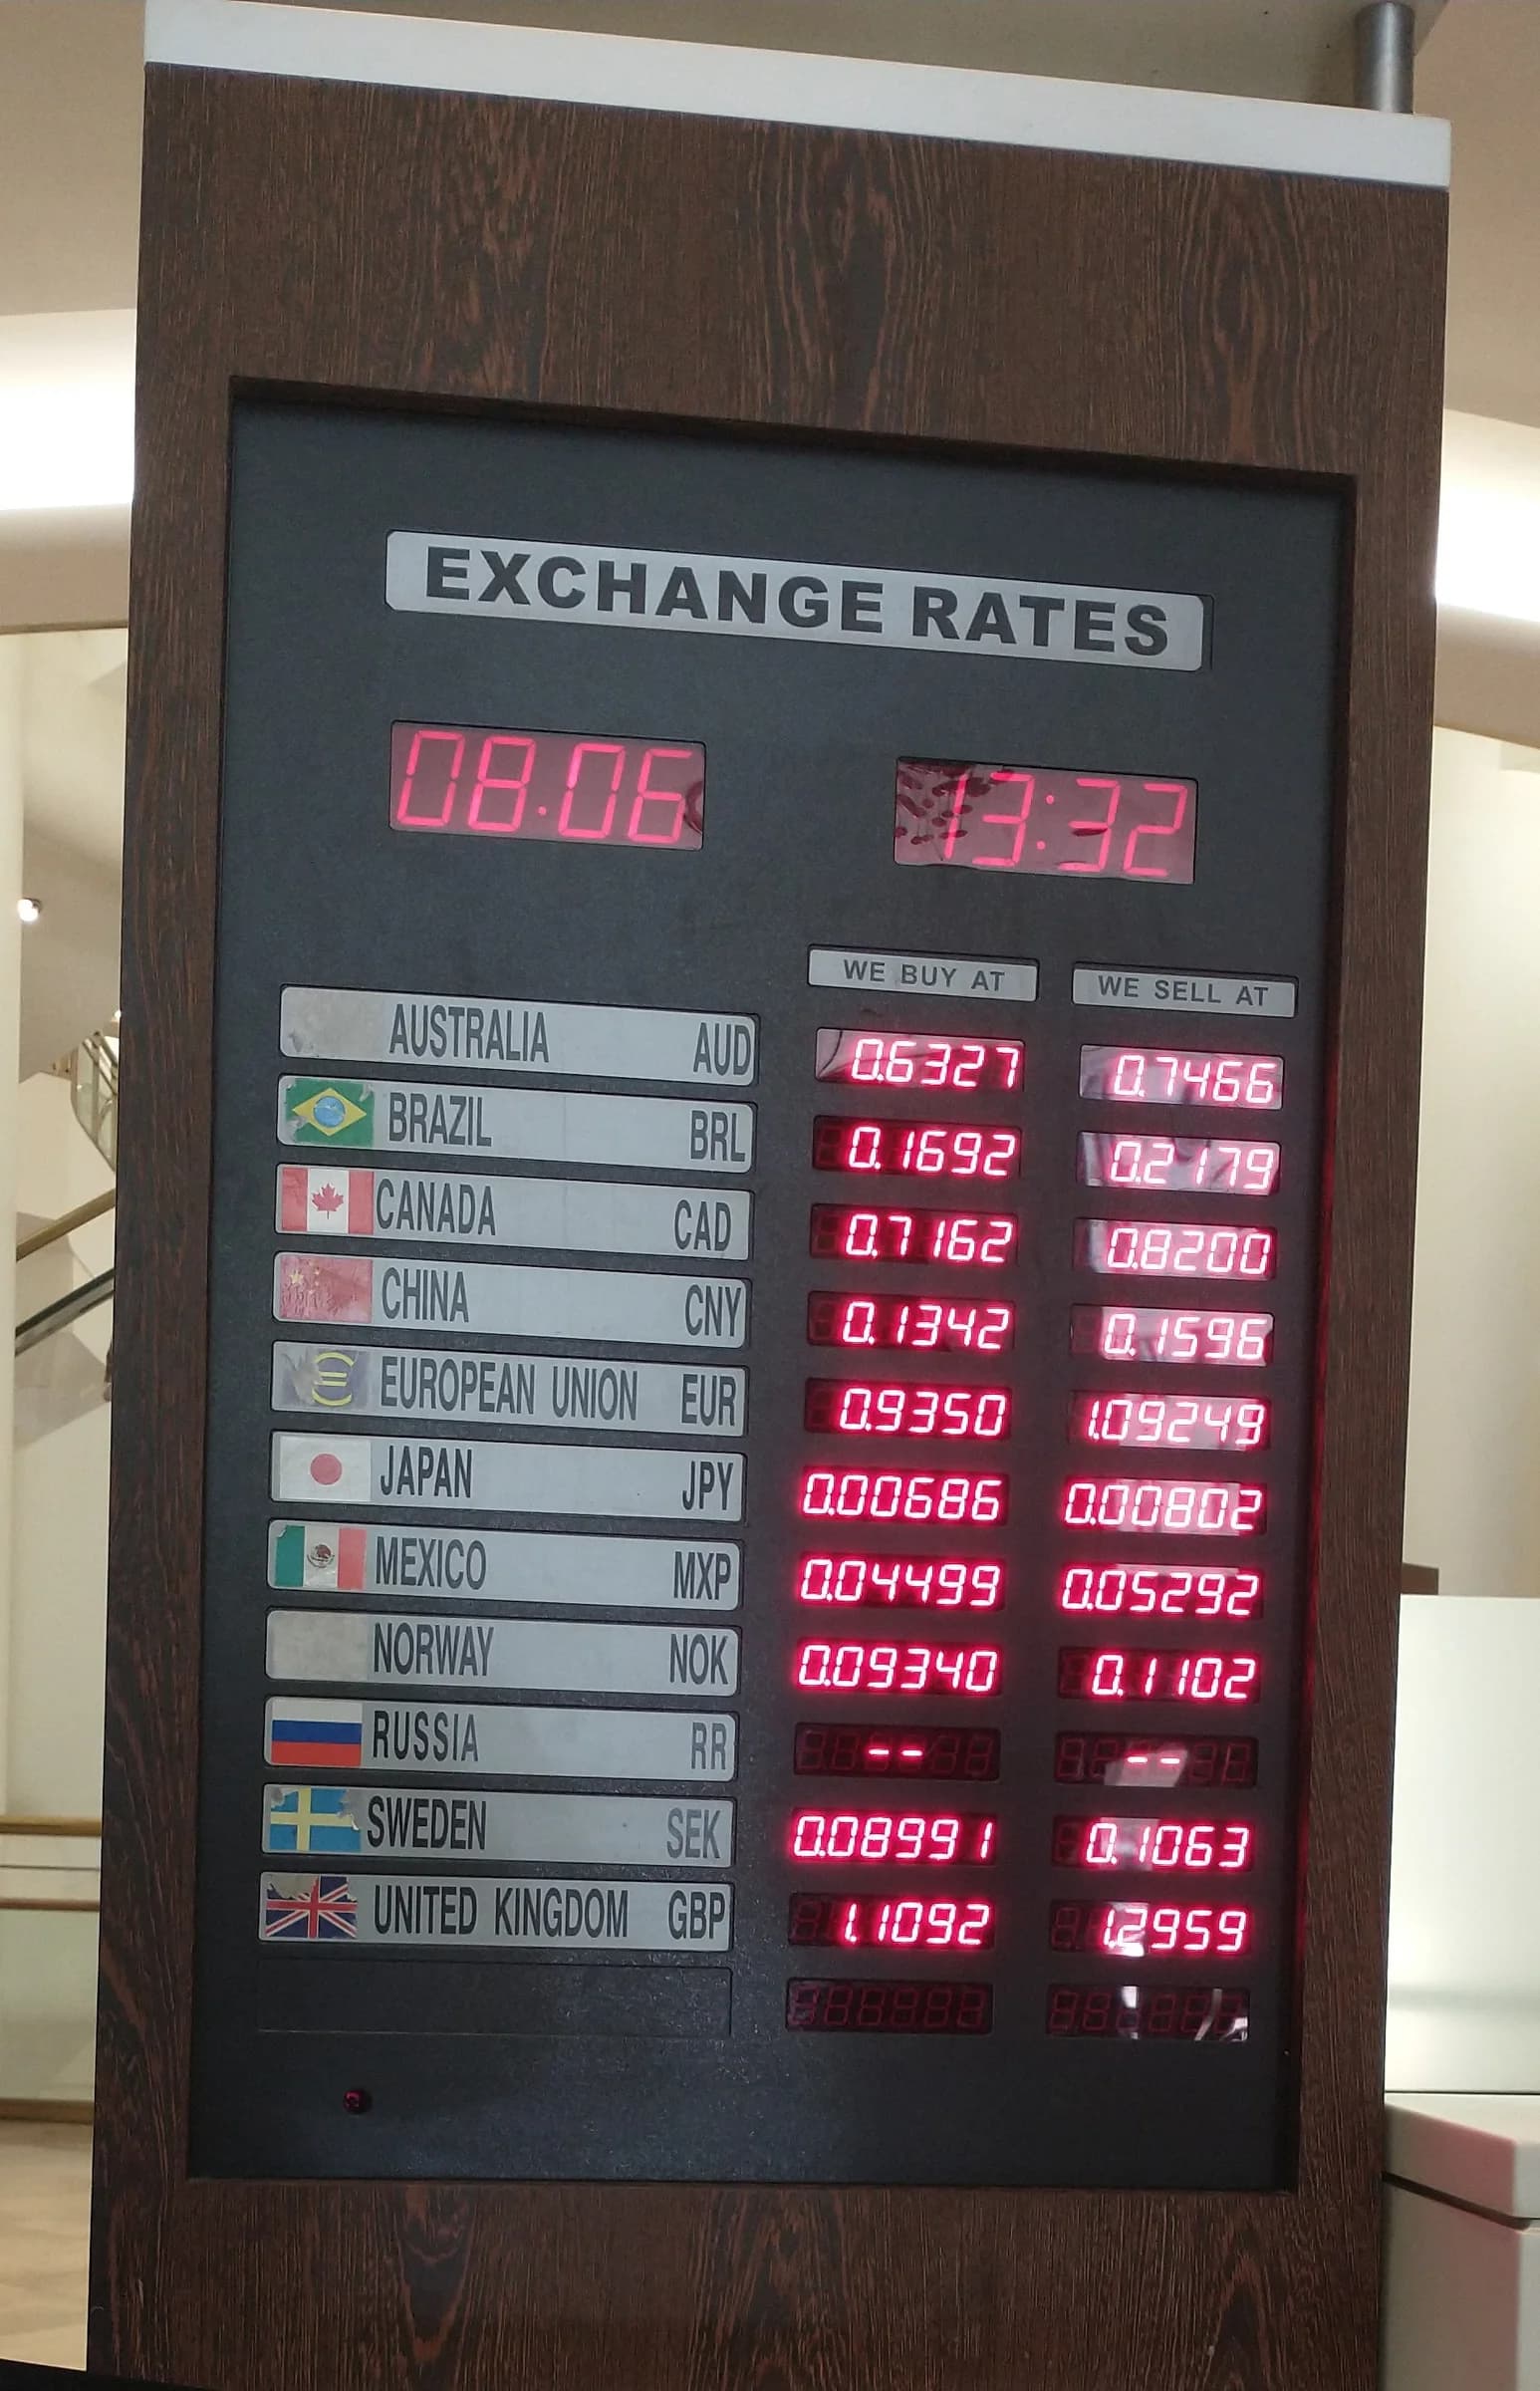
The board in the photograph quotes the value of each currency in US dollars. A traveller who sells euros to the counter receives US$0.9350 for each euro, but a traveller who buys euros pays US$1.09249 each. Economists usually ignore this margin and work with a single market rate halfway between the two, which is the rate shown on the exchange rate diagram.
Converting a price from one currency into another is a single multiplication or division. The safest method is to write the exchange rate as an equation and multiply both sides until the unit wanted appears on one side.
In a floating exchange rate system the value of a currency is set only by market forces, in the same way as the price of wheat or copper. The government and the central bank do not buy or sell the currency in order to influence its value. The US dollar, the euro, the pound, the yen, the Australian dollar and the Mexican peso are examples of currencies that float, although their central banks occasionally intervene, as Japan did to support the yen in 2022–26.
A currency is not wanted for itself. The demand for pounds is a derived demand: people want pounds because they want to buy something British, whether a good, a service, an asset or a holiday. The supply of pounds comes from UK residents who want something foreign and must sell pounds to pay for it.
Using the pound as the example, pounds are demanded on the foreign exchange market by:
foreign buyers of UK exports of goods and services (a US importer of Scotch whisky, a Chinese student paying fees at a UK university, a German tourist in London);
foreign firms making foreign direct investment in the UK, such as a Japanese car maker building a factory in the north-east of England;
foreign investors buying UK shares, government bonds or bank deposits (portfolio investment);
people working abroad who send money home to families in the UK (remittances);
speculators who expect the pound to rise and buy it now in order to sell it later at a higher price;
foreign central banks, and the Bank of England itself, when they buy pounds.
Pounds are supplied by UK residents, firms and the government when they need foreign currency: UK households and firms buying imports and holidays abroad, UK firms investing in factories and offices overseas, UK pension funds buying foreign shares and bonds, migrants in the UK sending money to their families abroad, speculators selling pounds because they expect it to fall, and central banks selling pounds. Every one of these groups must sell pounds to obtain the foreign currency it wants.
The demand curve for pounds slopes downwards. When the price of the pound falls from US$1.40 to US$1.20, a UK good priced at £100 falls in dollar price from US$140 to US$120. Foreign buyers demand more British goods, services and assets, so they need a larger quantity of pounds. Each pound is cheaper for foreigners, so the quantity of pounds demanded rises.
The supply curve of pounds slopes upwards. When the pound is worth more dollars, US goods become cheaper for UK buyers: a US$130 jacket costs £100 at US$1.30 per pound but only £86.67 at US$1.50. UK residents buy more American goods, services and assets and so supply more pounds to obtain the dollars they need.
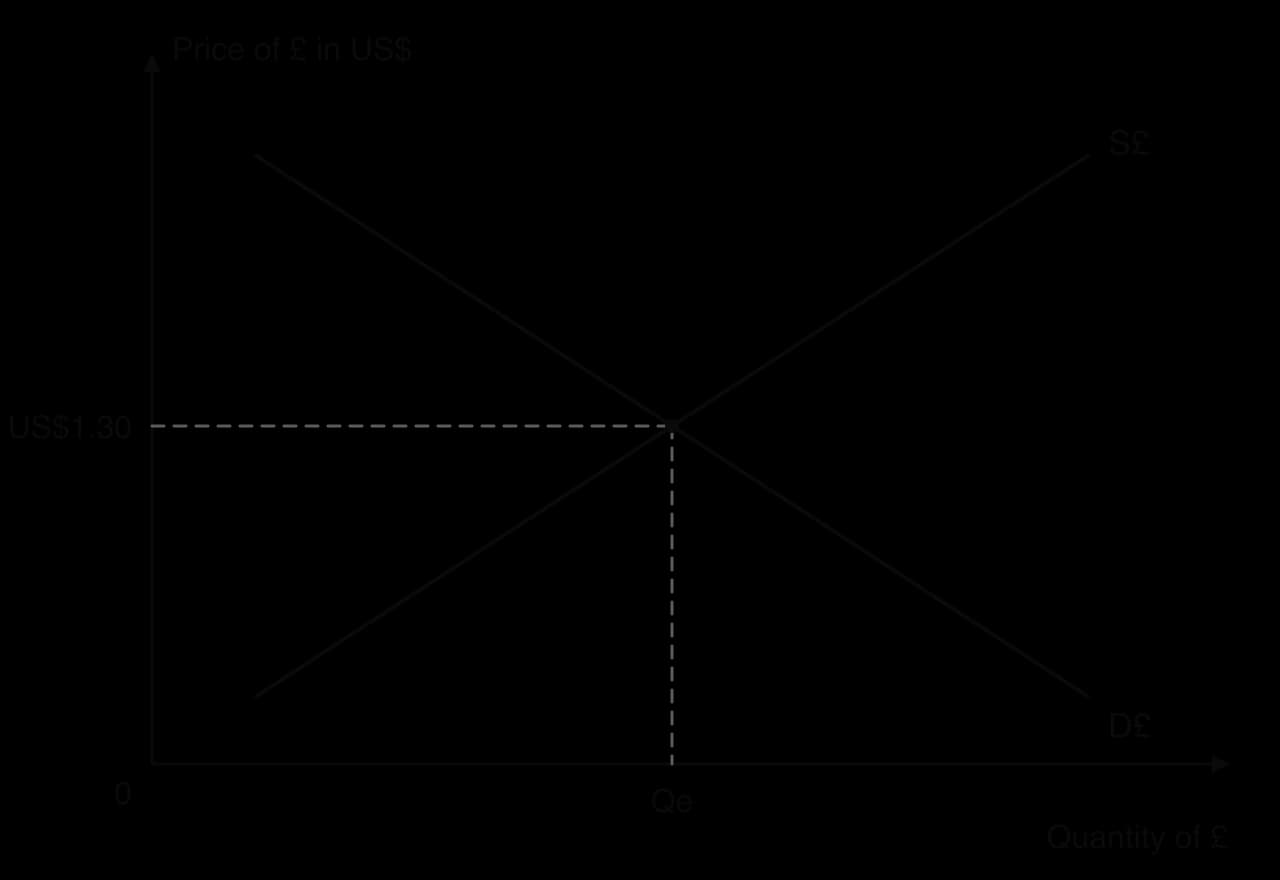
The diagram is drawn exactly like a market diagram, with two differences in labelling. The vertical axis shows the price of the currency in terms of the other currency (US dollars per pound), and the horizontal axis shows the quantity of the currency (pounds) traded. Every label names the currency, so the curves are D£ and S£ rather than D and S.
If the rate were above US$1.30, the quantity of pounds supplied would exceed the quantity demanded. Holders of pounds who could not find buyers would accept fewer dollars per pound, and the rate would fall. Below US$1.30 there would be excess demand for pounds, and buyers would offer more dollars for each pound. In a floating system the exchange rate moves until the market clears, just as the price mechanism clears any other market.
When the equilibrium price of a floating currency changes, it either appreciates or depreciates. These terms are used only when the change comes from market forces.
An appreciation of the pound from US$1.20 to US$1.30 means each pound now buys more dollars. It is caused either by an increase in demand for pounds (the demand curve shifts right) or by a decrease in supply of pounds (the supply curve shifts left).
A depreciation of the pound is caused by a decrease in demand for pounds or an increase in supply of pounds. In both cases the equilibrium price of the pound falls.
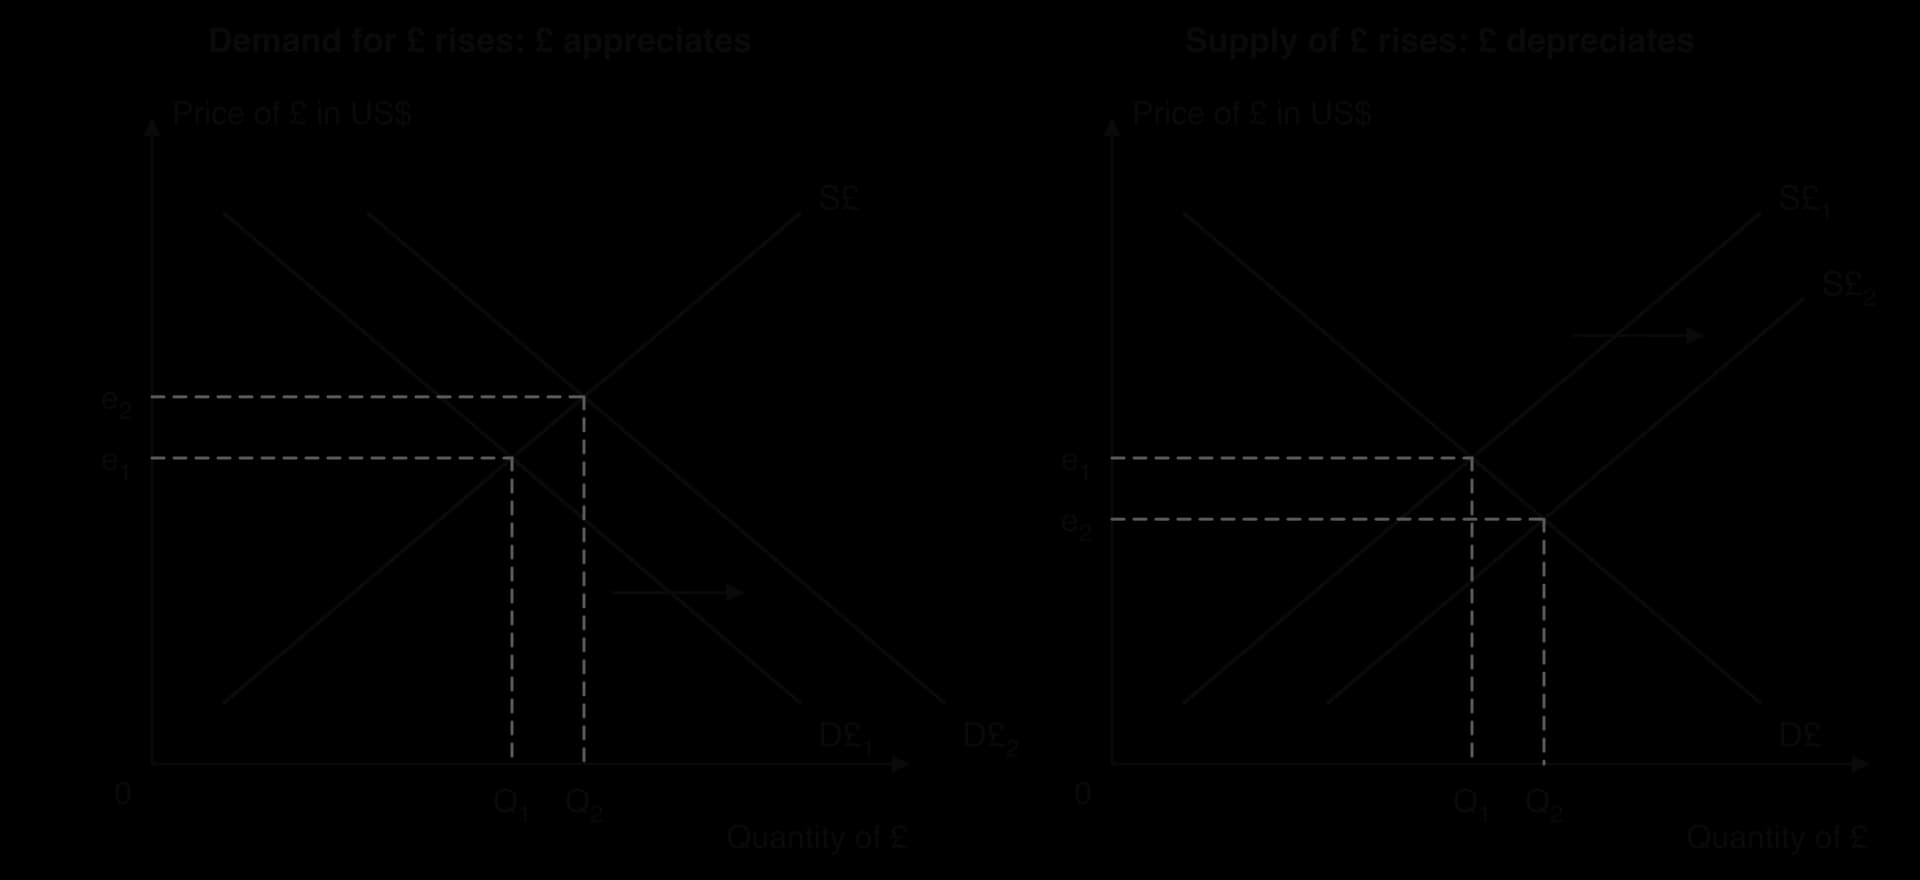
In the left-hand diagram, foreigners want to buy more British goods or assets at every exchange rate, so the demand curve shifts from D£₁ to D£₂. At the old rate e₁ there is excess demand for pounds, and the rate rises to e₂. In the right-hand diagram, UK residents want more foreign goods or assets, so they supply more pounds at every rate; the supply curve shifts from S£₁ to S£₂, creating excess supply at e₁, and the rate falls to e₂.
An exchange rate change always has two sides. If the pound appreciates against the dollar, the dollar must have depreciated against the pound: a rate of US$1.30 per pound is the same as £0.77 per dollar, and a rise to US$1.40 per pound is a fall to £0.71 per dollar. A diagram for the pound and a diagram for the dollar describe the same event from opposite sides, which is why a fall in demand for pounds by Americans is also a fall in the supply of dollars by Americans.
The size of an appreciation or depreciation is measured as a percentage change, with the usual formula.
The value used must be the price of the currency being measured. To measure the change in the pound, use dollars per pound; to measure the change in the yen against the dollar, use dollars per yen (the reciprocal of yen per dollar). The two currencies do not move by the same percentage, because the base of each percentage is different.
A shortcut for (b) uses the rates directly: the yen’s percentage change equals (old yen per dollar ÷ new yen per dollar − 1) × 100 = (114.83 ÷ 157.86 − 1) × 100 = −27.3%. It gives the same answer because the price of the yen is the reciprocal of the price of the dollar.
 YouTube
Anything that changes how much foreigners want to buy from a country, or how much its residents want to buy from abroad, shifts the demand or supply curve of its currency. The table lists the main factors, using the pound as the example.
Change (in the UK, other things equal) | Curve that shifts | Effect on the pound |
|---|---|---|
Foreign demand for UK exports rises | D£ shifts right | Appreciates |
UK demand for imports rises | S£ shifts right | Depreciates |
Inward FDI into the UK rises | D£ shifts right | Appreciates |
Outward FDI by UK firms rises | S£ shifts right | Depreciates |
Foreigners buy more UK shares and bonds (inward portfolio investment) | D£ shifts right | Appreciates |
Remittances sent to the UK rise | D£ shifts right | Appreciates |
Speculators expect the pound to fall | D£ shifts left and S£ shifts right | Depreciates |
UK inflation rises relative to other countries | D£ shifts left and S£ shifts right | Depreciates |
UK interest rates rise relative to other countries | D£ shifts right and S£ shifts left | Appreciates |
UK growth is faster than in other countries | S£ shifts right (more imports); D£ may shift right (more inward investment) | Depends which effect is larger |
The Bank of England buys pounds with foreign currency | D£ shifts right | Appreciates |
Trade in goods and services is the most direct link. If incomes in the United States rise, or British products become more fashionable or better in quality, foreign demand for UK exports rises and so does the demand for pounds. If UK consumers buy more imported goods, perhaps because UK incomes rise or foreign products improve, the supply of pounds increases. The prices of exports and imports, and therefore the international competitiveness of a country’s firms, are themselves affected by inflation and by the exchange rate.
Primary commodity exporters show the link clearly. When world prices of oil, copper or coffee rise, the export earnings of producing countries rise and demand for their currencies increases. Currencies such as the Australian dollar, the Norwegian krone and the Chilean peso tend to rise and fall with the prices of the commodities their countries export.
Inward FDI into the UK, such as a foreign car maker building a battery plant, requires foreign currency to be swapped for pounds to pay for land, buildings and wages, so demand for pounds rises. Outward FDI, such as a UK supermarket buying a chain in Poland, requires pounds to be swapped for złoty, so the supply of pounds rises. FDI is usually long term and is not easily reversed, so it tends to produce steady rather than sudden changes in the exchange rate.
Foreign pension funds buying UK government bonds, or foreign investors buying shares in UK companies, must first buy pounds, so inward portfolio investment raises the demand for pounds. UK investors buying US shares supply pounds. Portfolio flows respond quickly to changes in interest rates, share prices and confidence, and can be reversed in days, which makes them a major cause of short-run exchange rate movements.
For many lower- and middle-income countries, remittances are a large and steady source of demand for the domestic currency, because the dollars or euros earned abroad must be exchanged for the home currency before families can spend them. Personal remittances to the Philippines reached about US$41.6 billion in 2025, equal to around 8.5% of the country’s GDP, providing steady support for the peso.
Sources: World Bank, World Development Indicators, BX.TRF.PWKR.CD.DT and BX.TRF.PWKR.DT.GD.ZS (2026).
Most daily trading on the foreign exchange market is by banks, investment funds and other traders who hold currencies for minutes, days or weeks in the hope of a gain. If speculators expect the pound to fall, they sell pounds now, before the fall, and plan to buy them back later at a lower price. Expectations of a depreciation therefore reduce the demand for pounds and increase their supply at the same time.
Speculation can be self-fulfilling: if enough traders expect a currency to fall and sell it, it does fall, which can attract further selling. Speculative flows are much larger and faster than flows linked to trade, so a change in expectations about a central bank’s next decision, an election or a country’s debts can move a currency far more in a day than months of changes in trade.
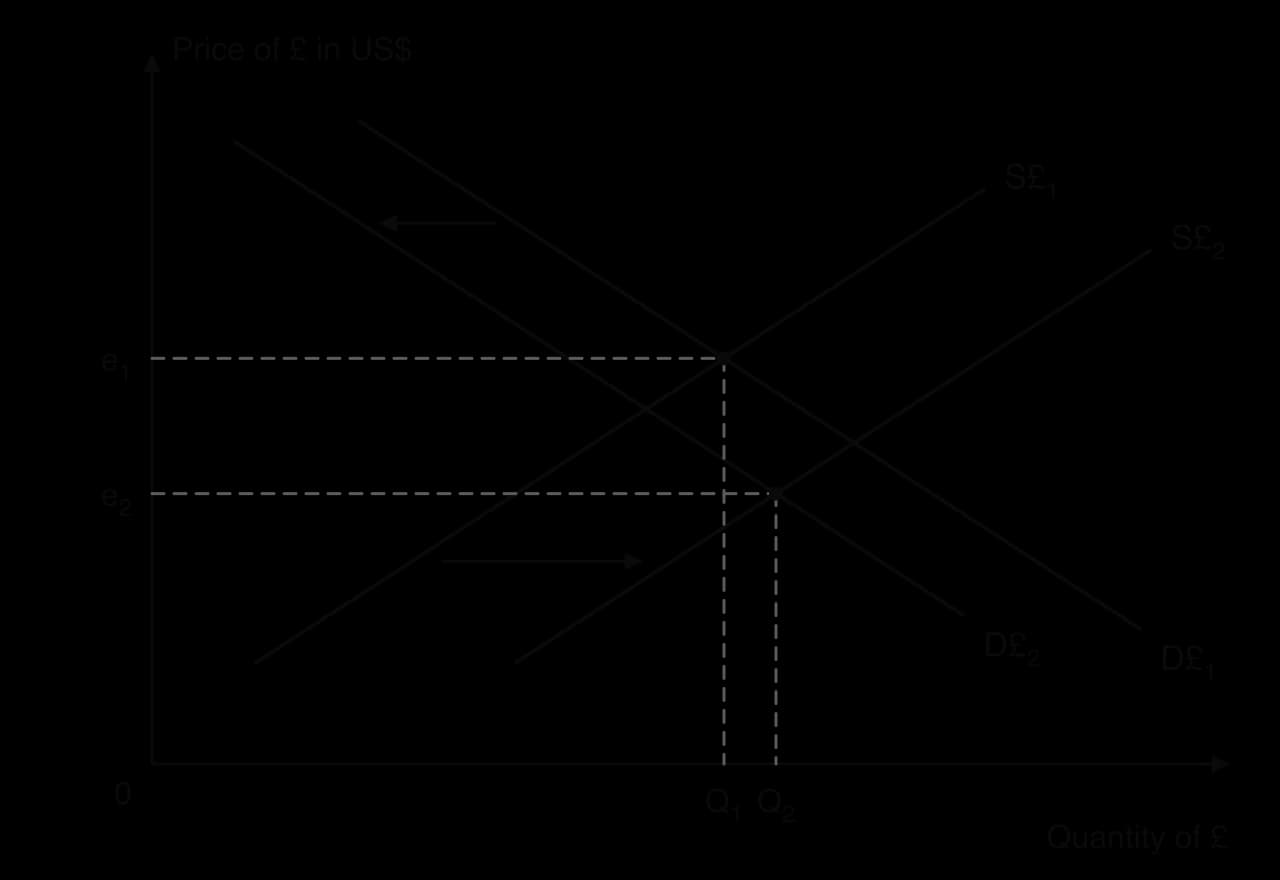
The pound after the UK’s referendum on leaving the European Union is a clear case. On 23 June 2016, the day of the vote, one pound was worth US$1.48. When the result was known on 24 June it fell to US$1.36, and by 11 October 2016 to US$1.22. Investors expected lower UK growth, more uncertainty for foreign firms investing in the UK and cuts in UK interest rates, so they sold pounds and bought fewer UK assets, as in the diagram.
Sources: Federal Reserve, H.10 noon buying rates in New York, via FRED series DEXUSUK (2026).
If inflation in the UK is higher than in its trading partners, UK goods become more expensive relative to foreign goods even if the exchange rate does not change. Foreigners buy fewer UK exports, so demand for pounds falls; UK residents switch towards relatively cheaper imports, so the supply of pounds rises. Both shifts cause the pound to depreciate.
Over long periods, countries with persistently high inflation tend to see their currencies depreciate against those of low-inflation countries. The depreciation roughly offsets the inflation difference, which is the idea behind purchasing power parity: in the long run, exchange rates tend to move towards the rates at which the same basket of goods costs the same in each country. In the short run other forces, especially interest rates and speculation, often dominate.
Interest rates set the return on bank deposits and bonds. If the Bank of England raises its central bank minimum lending rate while rates elsewhere stay the same, UK assets offer a higher return. Foreign investors buy pounds to buy UK deposits and bonds, so the demand for pounds rises, and UK investors keep more of their savings at home, so the supply of pounds falls. The pound appreciates. A fall in UK interest rates relative to others has the opposite effect.
Money that moves between countries in search of the highest return is called hot money. Because it can leave as quickly as it arrives, a country that attracts hot money with high interest rates may see its currency fall sharply if rates elsewhere rise or confidence changes. One form of this is the carry trade: investors borrow in a currency with a very low interest rate, such as the yen, and use the money to buy assets in a currency with a higher rate, such as the dollar. Borrowing and selling the low-rate currency pushes it down.
Faster economic growth in the UK than in its trading partners has two opposing effects. Rising UK incomes increase spending on imports, which increases the supply of pounds and tends to make the pound depreciate. At the same time, fast growth and rising profits can attract inward FDI and portfolio investment, which increase the demand for pounds. Which effect dominates depends on the country and the period; for many emerging economies, strong growth has attracted large capital inflows and their currencies have appreciated.
Growth abroad matters too. Faster growth in the United States raises American demand for UK exports and so increases demand for pounds, which is one way in which economic conditions in one country spread to others.
To stop its currency falling, a central bank (or, in Japan, the Ministry of Finance acting through the Bank of Japan) sells some of its foreign exchange reserves and buys its own currency, which increases demand for it. To stop its currency rising, it sells its own currency and buys foreign currency, which increases the supply of its currency and adds to its reserves. A central bank can also influence the rate indirectly by changing interest rates.
Central bank intervention is the defining feature of fixed and managed systems, but central banks with floating currencies also intervene occasionally when they judge a movement to be too fast or not justified by economic conditions. Japan’s purchases of yen in 2022, 2024 and 2026 are examples.
An appreciation or depreciation changes the relative prices of domestic and foreign goods. A depreciation makes a country’s exports cheaper in foreign currency and its imports dearer in domestic currency; an appreciation does the reverse. These price changes spread through the economy to inflation, output, unemployment, the current account of the balance of payments and living standards. The analysis is set out for a depreciation; the effects of an appreciation are the opposite.
Two separate effects work at the same time. Through demand, higher net exports increase aggregate demand. Through costs, dearer imported raw materials, components and energy raise firms’ costs of production and shift short-run aggregate supply to the left.
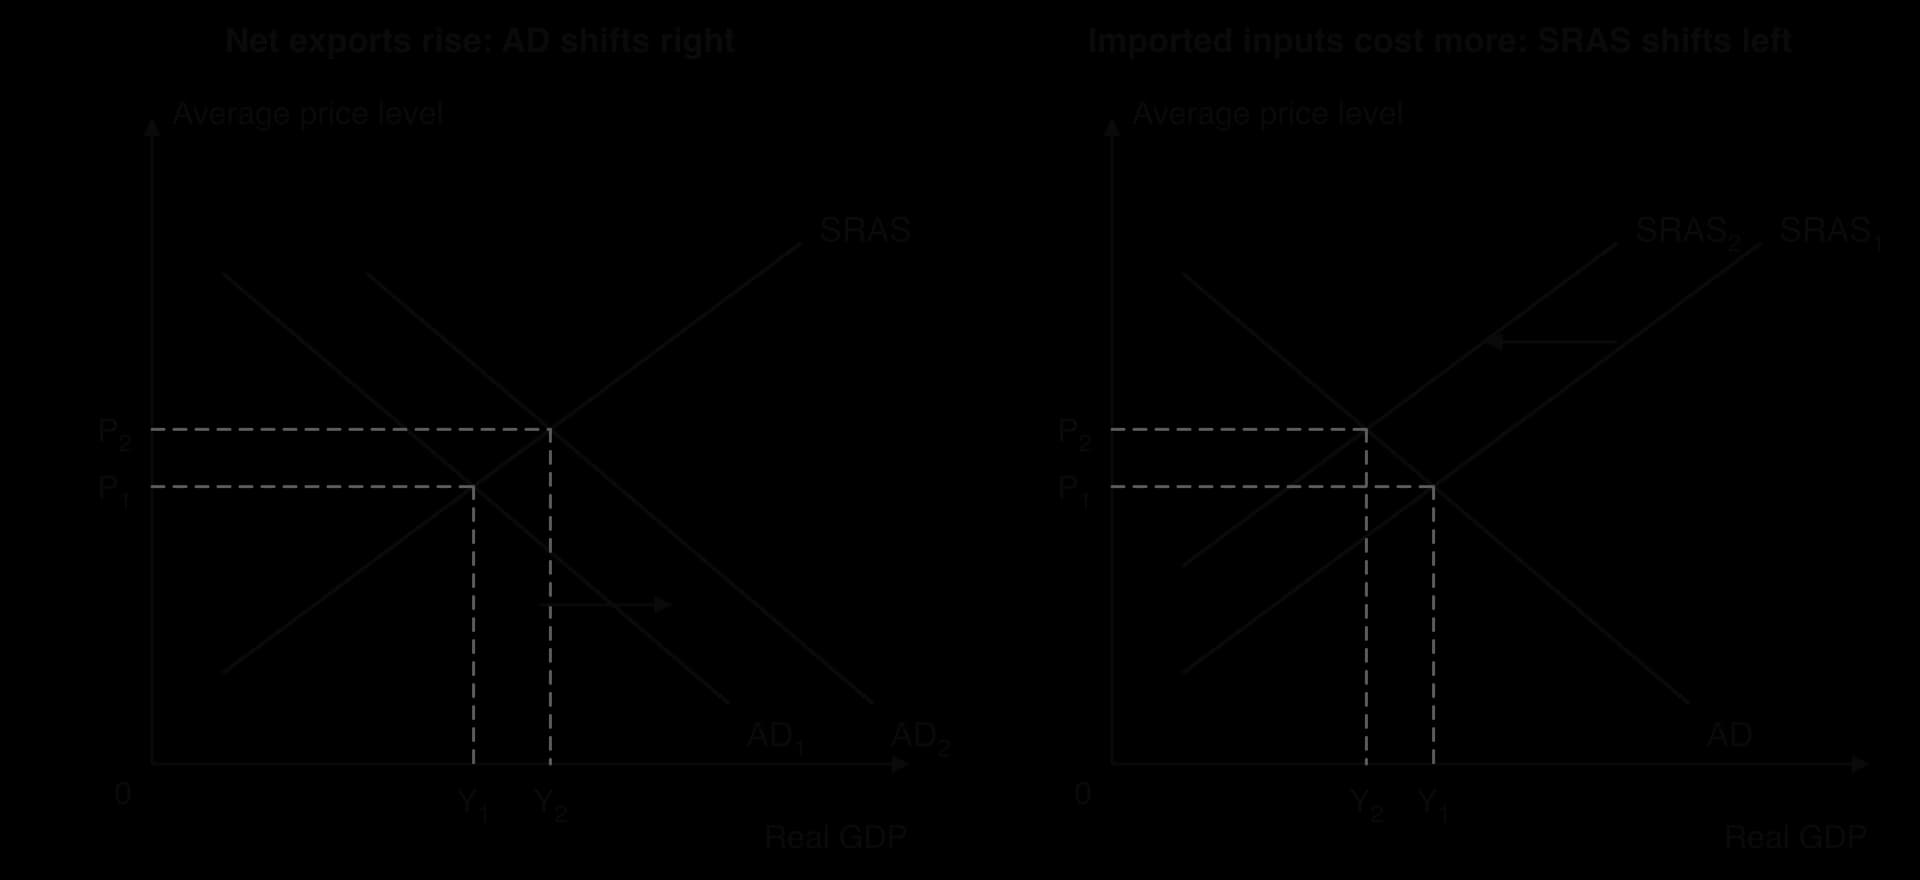
In the left-hand diagram, net exports (X − M) rise because exports are now cheaper for foreigners and imports dearer for domestic buyers, who switch to domestic substitutes. AD shifts from AD₁ to AD₂, real GDP rises from Y₁ to Y₂ and the average price level rises from P₁ to P₂. In the right-hand diagram, imported inputs cost more, SRAS shifts from SRAS₁ to SRAS₂, and the economy moves to a higher price level P₂ and a lower real GDP Y₂. In reality both happen together; the price level rises in both cases, while the overall effect on output depends on which shift is larger.
A depreciation tends to raise inflation in three ways. Imported consumer goods (food, clothing, electronics) become dearer directly. Imported raw materials and energy become dearer, raising firms’ costs and causing cost-push inflation. Higher net exports increase AD, which can cause demand-pull inflation if the economy is close to full capacity. Inflation caused by dearer imports is called imported inflation.
The size of the effect depends on how much of what the country consumes and uses in production is imported, and on whether firms pass the higher costs on to consumers. An appreciation works the other way, lowering import prices and reducing inflationary pressure, which is why central banks that target inflation pay close attention to the exchange rate. In 2022 the euro fell from US$1.23 at the start of 2021 to below US$1.00 (parity) in July 2022 and to US$0.96 in late September 2022. Oil and much liquefied gas are priced in dollars, so the weak euro added to the rise in euro-area energy prices that year.
Sources: Federal Reserve, H.10 noon buying rates, via FRED series DEXUSEU (2026).
If the economy has spare capacity, the rise in net exports after a depreciation increases AD and real GDP, and the Keynesian multiplier can add to the effect as exporters hire workers who then spend their wages. Export industries and firms competing with imports (domestic producers of goods that consumers had been importing) gain most. An appreciation reduces net exports and can slow growth, especially in economies where exports are a large share of GDP.
Against this, a depreciation raises the cost of imported capital goods and inputs, which can reduce investment and shift SRAS left. If many of the country’s exports contain imported components, as in electronics assembly, the competitive gain is smaller, because the costs of exporters rise along with the currency’s fall.
Higher output in export and import-competing industries increases the demand for labour, so a depreciation tends to reduce cyclical unemployment in the short run, particularly in manufacturing, tourism and agriculture. An appreciation can cause job losses in these industries, as happened in manufacturing in countries whose currencies rose strongly on the back of commodity booms. The effect fades if higher import prices push up inflation and workers demand higher wages to protect their real incomes, raising costs and wiping out the competitive gain.
The current account records a country’s trade in goods and services and its income flows with the rest of the world. A depreciation makes exports cheaper and imports dearer, so it tends to raise export revenue and reduce import spending, improving the current account balance. An appreciation tends to worsen it.
The improvement is not automatic. Export revenue rises only if foreign buyers increase the quantity they buy by enough to offset the lower foreign-currency price, and import spending falls only if domestic buyers cut the quantity of imports by more than the rise in their price. If demand for exports and imports is price inelastic, especially in the short run when contracts are fixed and buyers take time to find alternatives, a depreciation can at first make the current account worse. The conditions under which it improves are the Marshall–Lerner condition and the J-curve, studied with the balance of payments.
A depreciation reduces the purchasing power of domestic incomes over foreign goods. Imported food, fuel, medicines and consumer goods cost more, holidays abroad become more expensive, and households with debts in foreign currency (common in some emerging economies) face higher repayments in domestic currency. Low-income households often lose most, because food and energy, frequently imported, take up a larger share of their spending, which raises questions of equity.
Some groups gain. Workers in export industries may have more secure jobs, firms in tourism earn more as foreign visitors find the country cheaper, and families receiving remittances from abroad receive more domestic currency for each dollar sent. An appreciation raises living standards for consumers of imports and travellers, but can threaten jobs and incomes in exporting regions.
Whether a depreciation is good or bad for an economy depends on the circumstances, and a reasoned judgment weighs them:
Spare capacity. In a recession with a deflationary gap, the boost to AD raises output and employment with little inflation. Close to full employment, it mainly raises inflation.
Price elasticity of demand for exports and imports. The more elastic they are, the larger the rise in net exports; with inelastic demand the gain is small or even negative in the short run.
Import content of production. An economy that imports most of its energy, food and components suffers large cost increases, which can offset the competitive gain.
The cause of the depreciation. A fall caused by a loss of confidence, a debt crisis or very high inflation usually comes with other problems (capital leaving, higher interest rates) that can outweigh the trade benefits.
Time. Benefits for exporters build up slowly as buyers switch suppliers, while higher import prices are felt quickly; over several years, higher wages and prices can erode the competitive gain altogether.
Foreign-currency debts. Governments and firms that have borrowed in dollars face higher repayment costs in domestic currency, which can cause bankruptcies or a debt crisis.
What other countries do. If trading partners’ currencies also fall, or they respond with protection, the gain is lost.
Stakeholder | Effect of a depreciation | Effect of an appreciation |
|---|---|---|
Exporters | Gain: cheaper abroad, higher sales and profits | Lose: dearer abroad, lower sales |
Firms competing with imports | Gain: imports dearer | Lose: imports cheaper |
Firms using imported inputs | Lose: higher costs | Gain: lower costs |
Consumers | Lose: dearer imports and foreign travel, higher inflation | Gain: cheaper imports and travel, lower inflation |
Workers | Jobs gained in export and tourism industries; real wages squeezed by inflation | Jobs at risk in export industries; real wages helped by lower inflation |
Borrowers in foreign currency | Lose: debts larger in domestic currency | Gain: debts smaller |
Central bank and government | Higher inflation may force higher interest rates | Lower inflation; but a slower economy may need support |
Several key concepts apply. A currency’s fall shows interdependence (decisions abroad change domestic prices), raises issues of equity (low-income households pay most for dearer imported essentials) and affects economic well-being through purchasing power and jobs. Whether the government should step in to stop it is a question of intervention.
In a fixed exchange rate system the government or central bank sets the value of its currency against another currency, usually the US dollar or the euro, or against a basket of currencies, and commits to keep it there. A fixed rate is often called a peg. The central bank stands ready to buy or sell its currency at the official rate, using its reserves, so that the market rate cannot move away from it.
Hong Kong has fixed its dollar to the US dollar since 17 October 1983. Under its Linked Exchange Rate System the Hong Kong Monetary Authority keeps the rate within a narrow band of HK$7.75–7.85 per US dollar, buying Hong Kong dollars when the rate reaches the weak end and selling them at the strong end. China held the yuan at about 8.28 per dollar for several years until July 2005, and several Gulf oil exporters peg their currencies to the dollar, in which oil is priced.
Sources: Hong Kong Monetary Authority, Linked Exchange Rate System (2026).
Under a fixed system the market cannot change the rate, but the authorities can. A decision to move the official rate to a new level is a devaluation (downwards) or a revaluation (upwards).
A government may devalue because the old rate has become impossible to defend, for example because inflation has made its exports uncompetitive or its reserves are running out, or in order to make exports cheaper and reduce a current account deficit.
A government may revalue to reduce inflation by making imports cheaper, or under pressure from trading partners who believe the currency is kept too low. On 21 July 2005 China revalued the yuan from 8.2765 to about 8.11 per US dollar, a rise of about 2% in the yuan’s value, and moved from a fixed to a managed system.
Sources: Federal Reserve, H.10, via FRED series DEXCHUS (2026).
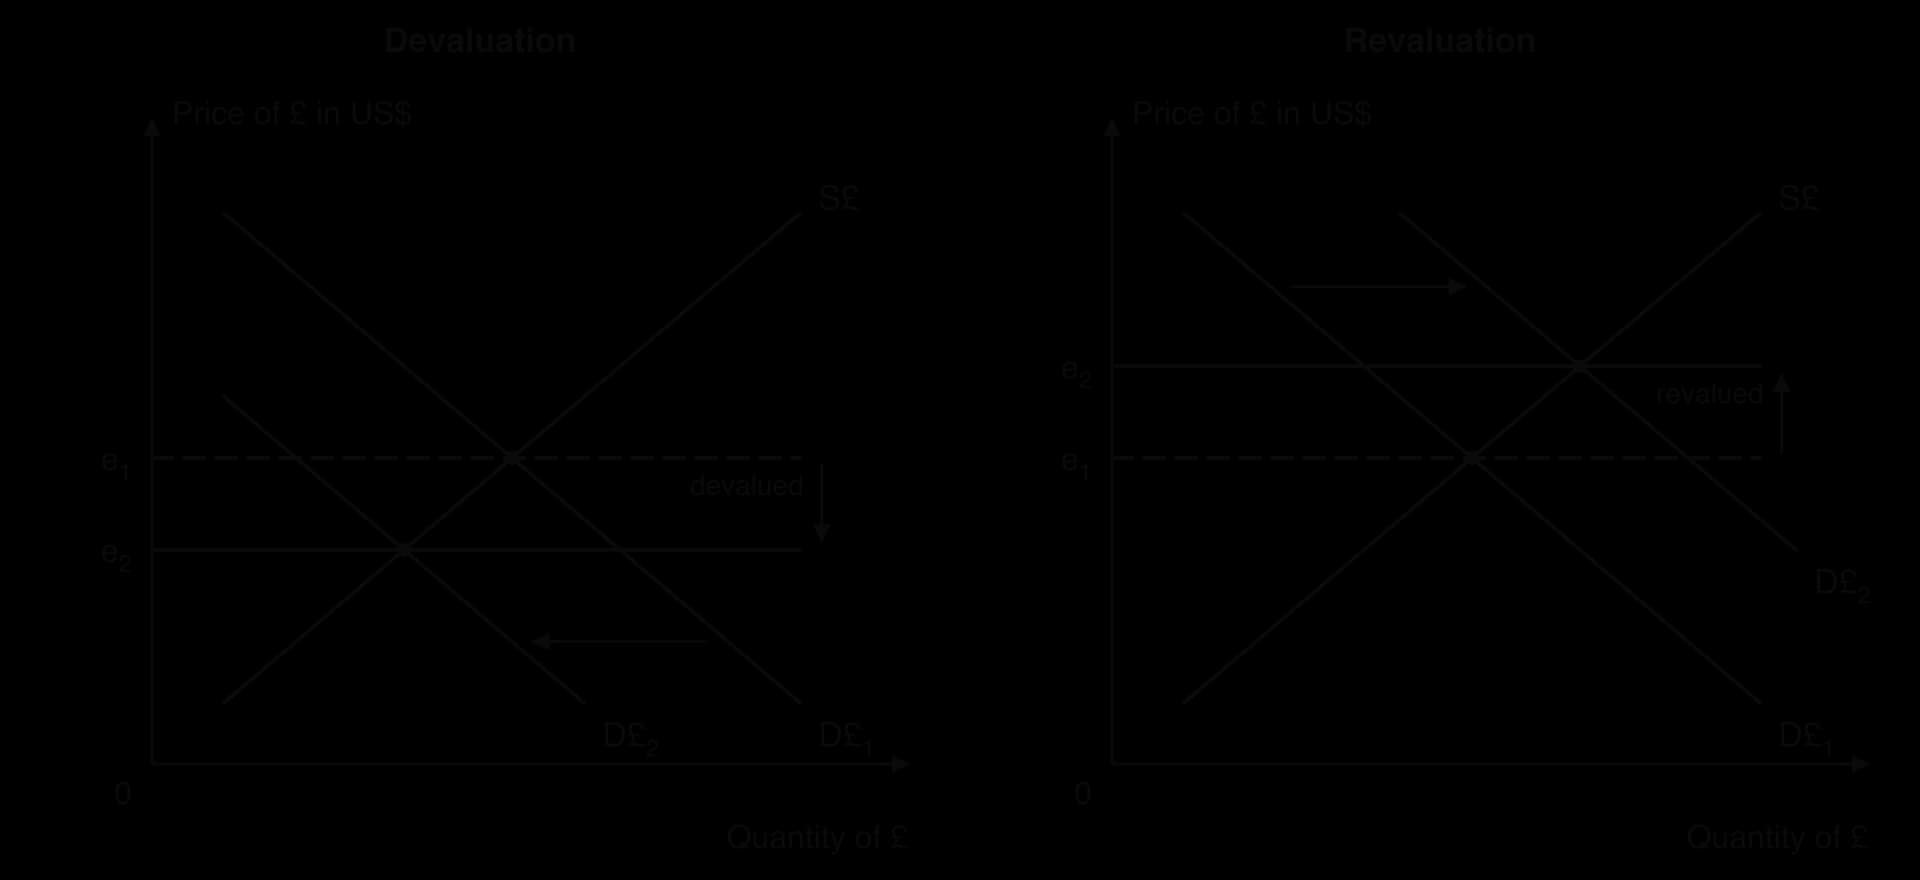
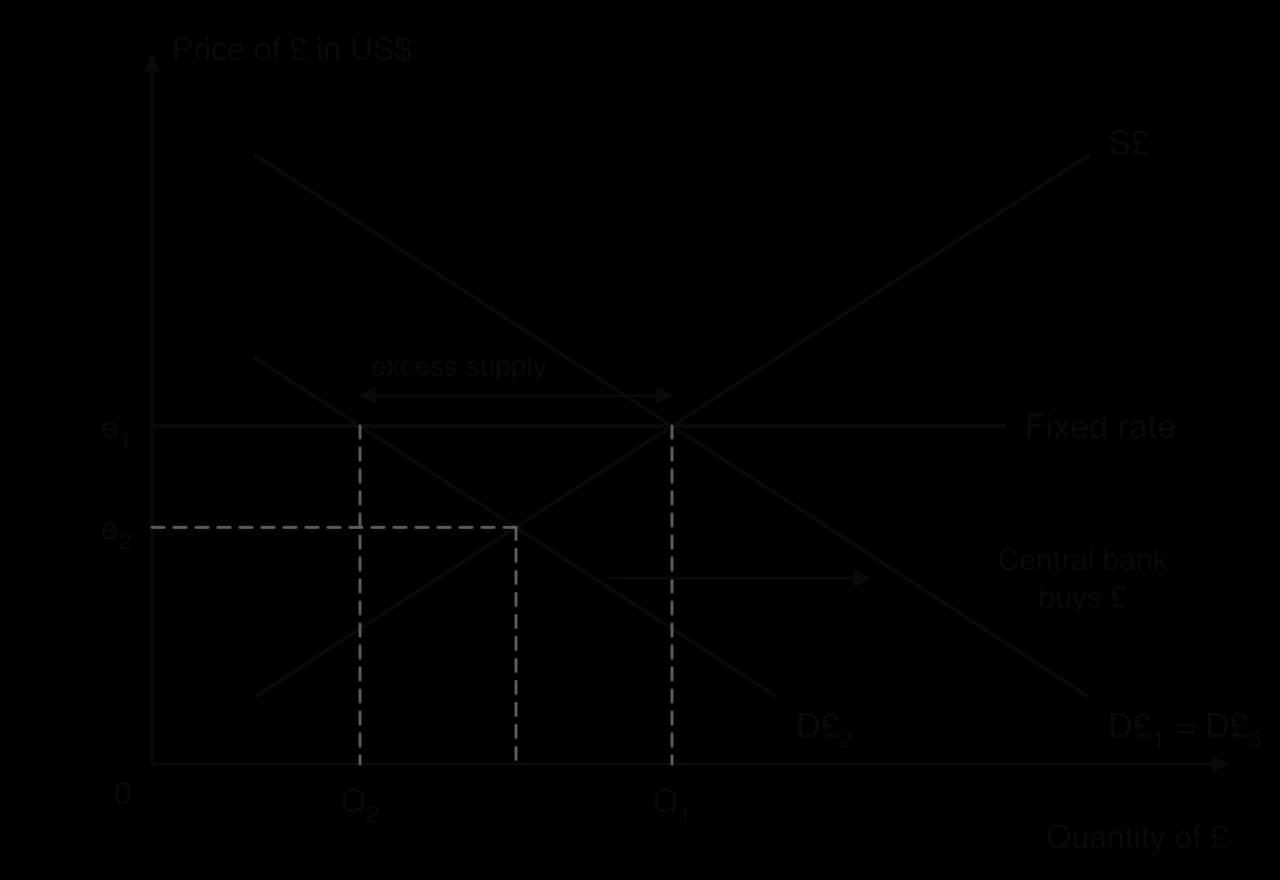
Suppose the pound is fixed at e₁ = US$1.30 and demand for pounds falls, perhaps because of a recession in the UK’s export markets. Without action, the pound would fall to e₂. At the fixed rate there is now excess supply of pounds: holders of pounds want to sell more than buyers want to buy. The central bank must remove this excess supply.
The authorities have three main tools.
Buying and selling the currency with reserves. To prevent a fall, the central bank buys its own currency on the foreign exchange market, paying with foreign exchange reserves (dollars, euros, gold). This adds to demand and shifts the demand curve back to the right, as in the diagram. To prevent a rise, it sells its own currency, which it can create, and buys foreign currency, adding to supply and to its reserves.
Changing interest rates. Raising interest rates attracts financial inflows (demand for the currency rises) and discourages outflows (supply falls), supporting the currency. Cutting interest rates does the opposite. The cost is that interest rates can no longer be set to suit domestic conditions: a country defending its currency may have to raise rates in a recession.
Exchange controls and other measures. The government can limit how much foreign currency residents and firms may buy, require exporters to sell their foreign earnings to the central bank, or restrict imports. These reduce the supply of the domestic currency directly.
The tools have limits. Reserves are finite: a central bank defending a rate against a fall can only buy its currency until its reserves run out, and speculators who see reserves falling may sell even more, expecting a devaluation. Higher interest rates reduce consumption and investment at home. Exchange controls discourage foreign investment and encourage illegal (parallel) currency markets. Defending a currency against a rise is easier, because a central bank can create unlimited amounts of its own currency to sell, but it leads to a growing stock of foreign assets and an increase in the money supply that can be costly and inflationary.
Switzerland shows both points. In September 2011, with investors pouring money into the Swiss franc as a safe asset, the Swiss National Bank set a minimum rate of CHF 1.20 per euro and sold francs to stop the franc rising further. On 15 January 2015 it abandoned the limit without warning. Within minutes the franc rose by about 30% against the euro, and it closed the day about 23% higher against the euro and 21% higher against the dollar, showing how much pressure the bank had been holding back.
Sources: Swiss National Bank (2015); Wikipedia, “Swiss franc”, citing SNB announcements (2026).
Most of the world’s currencies are neither fully floating nor rigidly fixed. Under a managed exchange rate (a managed float) the currency is allowed to float, but the central bank intervenes, through currency purchases and sales or interest rates, to keep it within a band, to slow down large or sudden movements, or to guide it towards a level that it has in mind. The central bank does not always announce its target, so markets watch its actions closely.
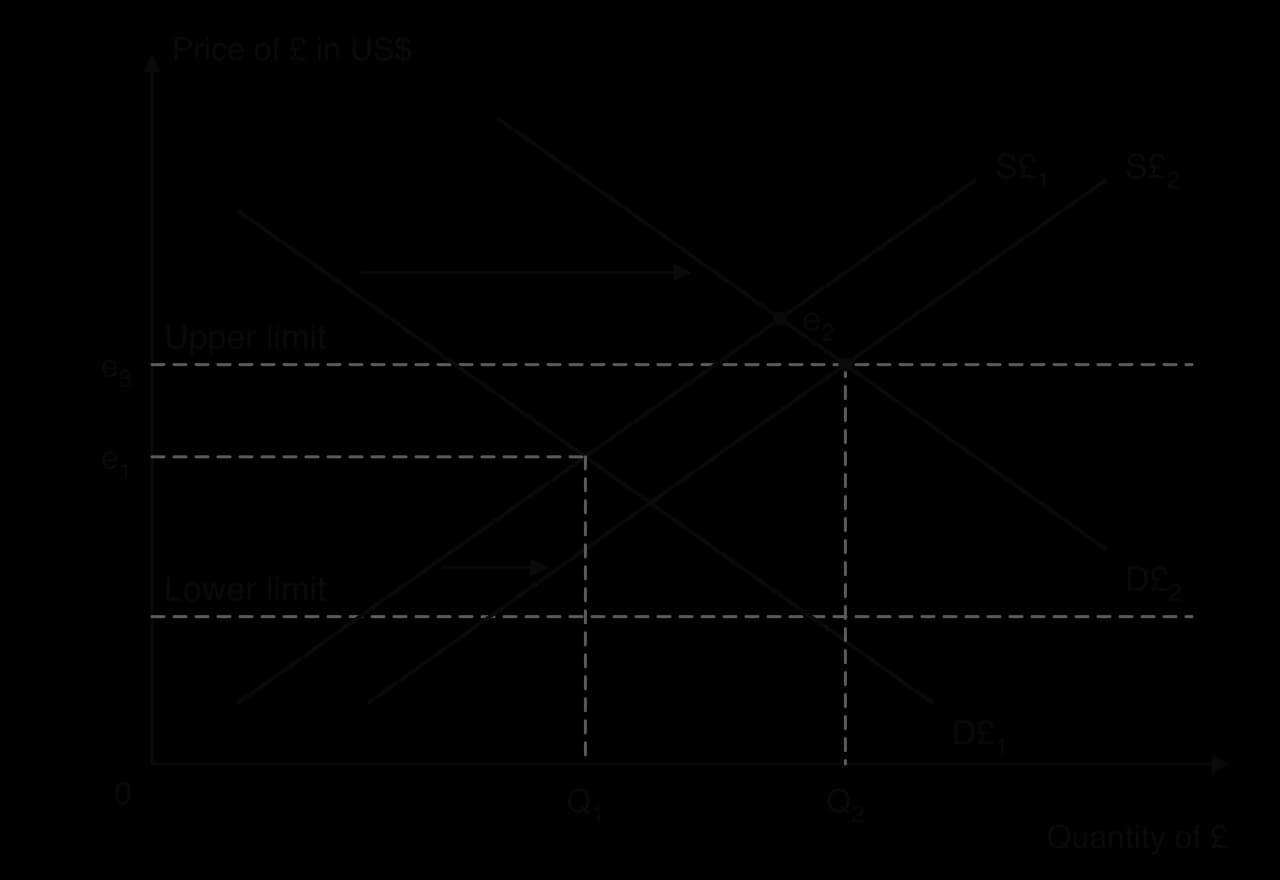
In the diagram, the equilibrium at e₁ lies inside the band, so the central bank does nothing. When demand for pounds rises to D£₂, the market rate would rise to e₂, above the upper limit. The central bank sells pounds (and buys foreign currency), which increases supply from S£₁ to S£₂, and the rate settles at e₃, the upper limit. If the currency fell towards the lower limit, the central bank would buy pounds with its reserves or raise interest rates.
China has run a managed system since 2005. Each trading day the People’s Bank of China sets a central reference rate for the yuan against the dollar and allows the market rate to move only within a band around it. On 5 August 2019, during the US–China trade dispute, the yuan weakened past 7 per US dollar (from 6.89 a week earlier); the same day, the US Treasury labelled China a “currency manipulator”, a label it withdrew in January 2020.
Sources: Federal Reserve, H.10, via FRED series DEXCHUS (2026); US Department of the Treasury press release, 5 August 2019.
When a central bank keeps a fixed or managed rate away from the level the market would set, the currency is overvalued or undervalued. The same terms are used more loosely for floating currencies that are judged to be far from their long-run value, for example by comparison with purchasing power parity.
An undervalued currency is the opposite case, in which the official or market rate is held below the level that would clear the market.
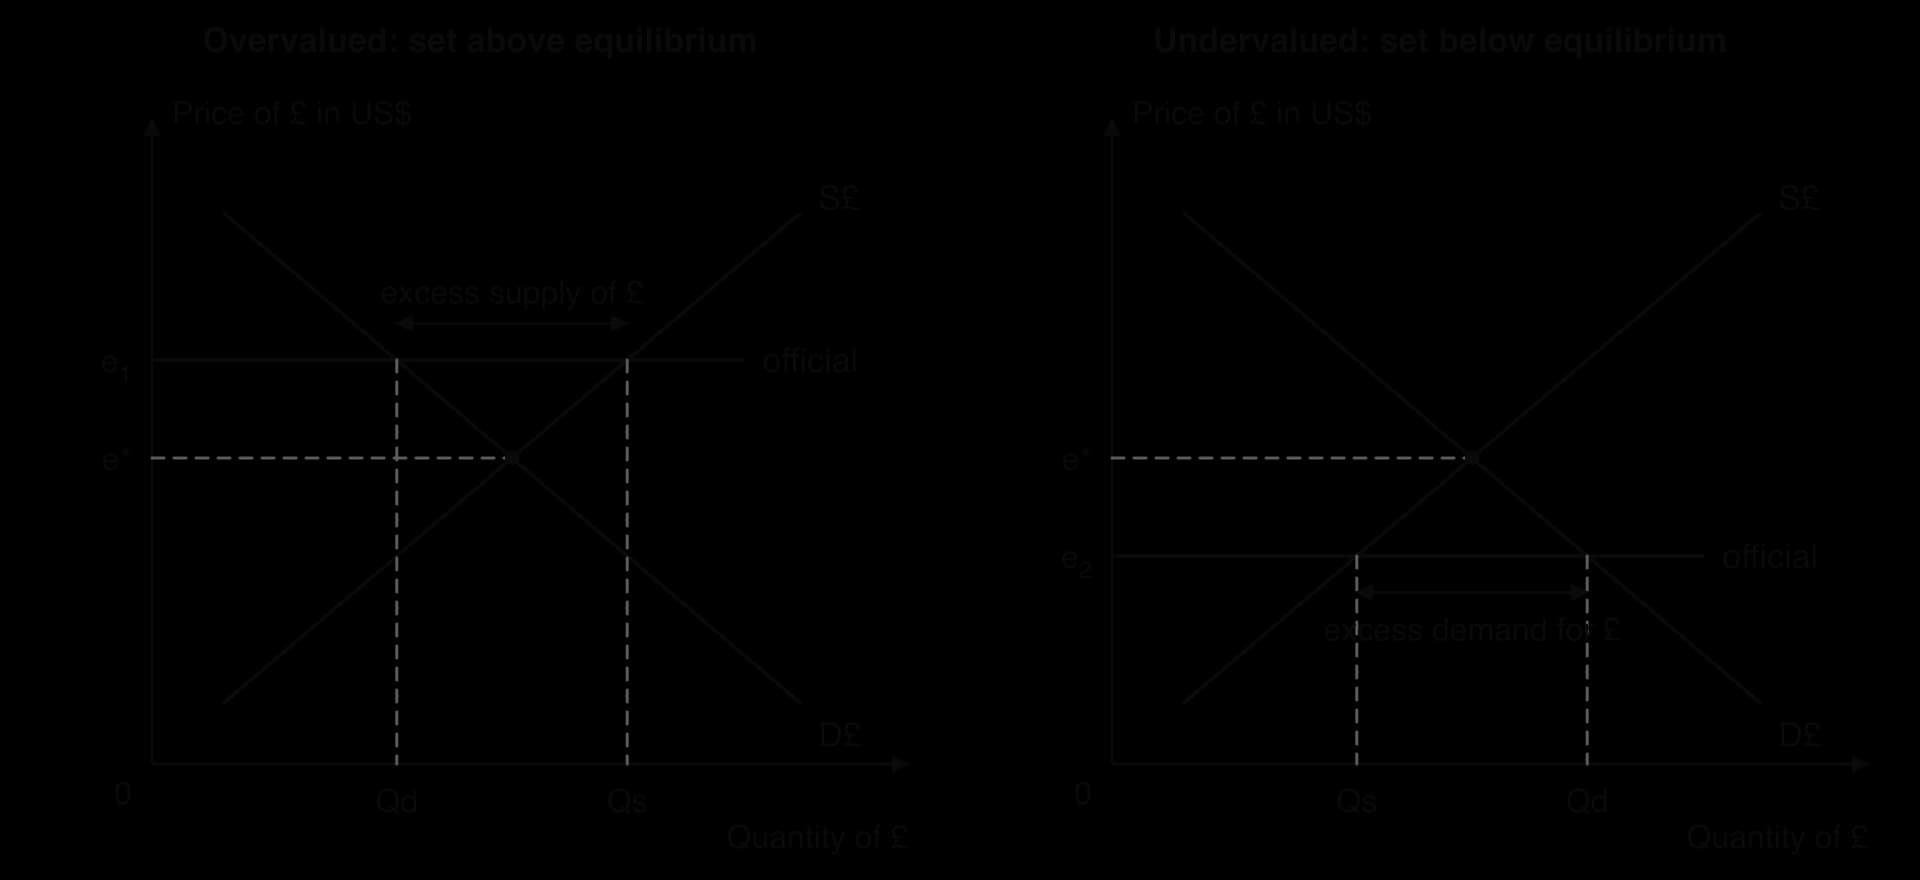
A government may keep its currency overvalued to hold down import prices and inflation, to make debts in foreign currency cheaper to repay, or because a devaluation would be politically embarrassing. The costs are that exports become uncompetitive, imports rise, the current account deteriorates and reserves are used up buying the excess supply of the currency. When reserves run short, the government often introduces exchange controls, and a parallel market appears in which the currency trades at a much weaker rate.
Nigeria shows how this ends. The Central Bank of Nigeria had held the naira at an official rate far stronger than the rate on the parallel market. On 14 June 2023 it abandoned the peg and let the naira trade freely; the official rate fell 23% in a day, to about ₦600 per US dollar, and by July 2024 it was about ₦1,600. Imported inflation followed: consumer price inflation averaged 24.7% in 2023 and 33.2% in 2024.
Sources: Wikipedia, “Nigerian naira”, citing Central Bank of Nigeria and Reuters reports (2026); IMF, World Economic Outlook database, PCPIPCH (2026).
A government may keep its currency undervalued to make its exports cheaper, protect domestic firms from imports, and support export-led growth and employment. Trading partners see this as an unfair advantage and may respond with tariffs or accusations of manipulation. Domestic consumers pay more for imports, the economy risks inflation because the central bank keeps creating its own currency to sell, and resources are drawn into export industries at the expense of domestic consumption.
No exchange rate system is best for every country. Each system trades off stability against flexibility, and the right choice depends on the size and openness of the economy, its history of inflation, its main trading partners and the kinds of shocks it faces.
Certainty for trade and investment. Exporters, importers and foreign investors know the future value of the currency, which reduces risk and the cost of protecting against currency changes. This matters most for small, very open economies that trade mainly with one partner.
A discipline on inflation. A government that pegs to the currency of a low-inflation country must keep its own inflation low, or its exports become uncompetitive and the peg comes under pressure. Pegs have been used to end high inflation, and they anchor expectations.
Less speculation, if the peg is credible. If markets believe the rate will hold, there is little point in betting against it, so destabilising speculative flows are reduced.
No sudden imported inflation from a currency collapse while the peg holds.
Loss of independent monetary policy. Interest rates must be used to defend the peg, so they cannot be cut in a recession or raised to fight domestic inflation unless the anchor country does the same. Hong Kong’s interest rates broadly follow those in the United States, whatever the state of the Hong Kong economy.
Large reserves are needed, which have an opportunity cost: the money could be invested in schools, infrastructure or higher-return assets.
Risk of a speculative attack. If markets doubt the peg, speculators sell the currency, reserves drain away, and the government may be forced into a sudden, large devaluation, as several Asian countries were in 1997–98 and Nigeria was in 2023.
Misalignment. If the official rate is set at the wrong level, the currency is overvalued or undervalued for years, causing persistent current account deficits or surpluses and trade disputes.
Painful adjustment. When a country with a fixed rate loses competitiveness, the exchange rate cannot fall to correct it, so adjustment must come through lower wages and prices (deflation) and higher unemployment.
Independent monetary policy. The central bank can set interest rates for domestic goals, such as an inflation target or supporting employment, because it does not need them to defend a rate.
Automatic adjustment. A country with a current account deficit supplies more of its currency than is demanded for trade; the currency depreciates, exports become cheaper and imports dearer, which tends to reduce the deficit without government action.
A shock absorber. When demand for a country’s exports collapses, its currency falls, cushioning the loss of output and jobs. Commodity exporters such as Australia and Chile benefit from this.
No need to hold large reserves, freeing resources for other uses.
Volatility and uncertainty. Large, rapid swings make it harder for firms to plan, price and invest, and firms must pay to protect themselves against currency risk. Small firms and those in lower-income countries, with less access to such protection, suffer most.
Overshooting and speculation. Speculative flows can push a currency far above or below the level justified by trade and inflation, for months or years, as the yen’s fall in 2022–26 suggests.
Imported inflation. A large depreciation can raise inflation sharply, especially in economies that import much of their food and energy.
Less discipline. Without a peg, governments face less external pressure to keep inflation low.
Criterion | Fixed exchange rate | Floating exchange rate |
|---|---|---|
Certainty for traders and investors | High, while the peg holds | Low; rates move daily |
Monetary policy | Tied to defending the rate | Free to target domestic goals |
Reserves needed | Large | Small |
Adjustment to a current account deficit | Through deflation and unemployment, or a devaluation | Automatic, through depreciation |
Inflation | Disciplined by the anchor country | Depends on the central bank; risk of imported inflation |
Speculation | Low if credible; crisis if not | Continuous; can cause overshooting |
The case for a fixed rate is strongest for a small, very open economy that trades mainly with one large partner, has a history of high inflation, or needs a simple and credible anchor, and that can hold enough reserves to defend the peg. Hong Kong, a financial centre whose trade and finance are largely priced in dollars, has kept its peg for more than four decades. The case for floating is strongest for a large economy with a credible independent central bank and well-developed financial markets, and for commodity exporters that face large swings in export prices.
In practice most countries choose a managed system, which gives some of the stability of a fixed rate while keeping the option to let the currency adjust. Its weakness is uncertainty about when and how the central bank will act, and the risk that trading partners treat its intervention as manipulation. A sound judgment therefore names the country type, the main shocks it faces and the strength of its institutions, rather than declaring one system best in general.
 YouTube
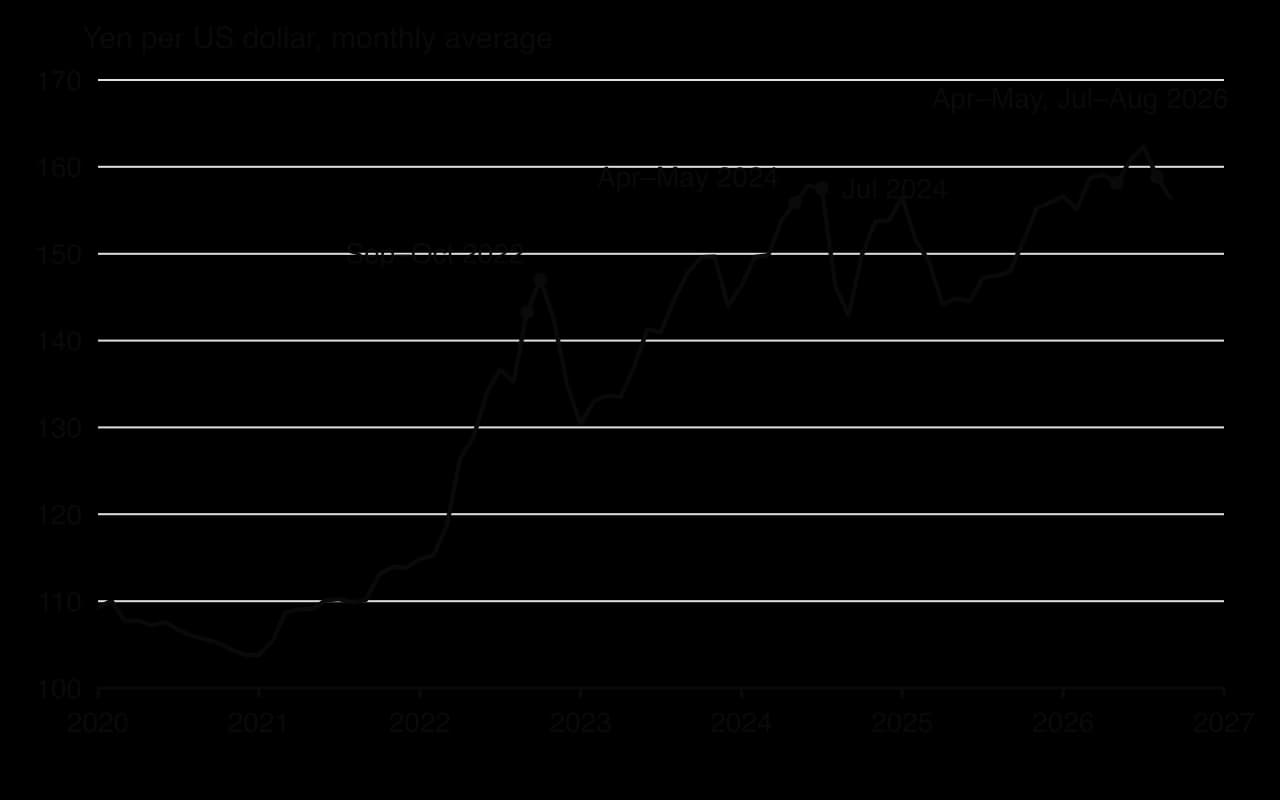
From the start of 2022 the Japanese yen fell steeply against the US dollar. In January 2022 one dollar bought on average ¥114.8; by October 2022 it bought ¥147.1, and on 10 July 2024 the daily rate reached ¥161.7, the yen’s weakest level since December 1986. After a recovery in late 2024 and 2025 it weakened again, to ¥163.9 per dollar on 29 July 2026. The yen floats, yet the Japanese authorities intervened repeatedly to slow its fall, which makes it a clear example of almost every idea about exchange rates.
The main cause was the interest rate differential, the gap between interest rates in the two countries. To fight inflation, the US Federal Reserve raised its policy rate from near zero in March 2022 to over 5% by mid-2023, and kept the federal funds rate at 5.33% until the late summer of 2024. The Bank of Japan, which had struggled with low inflation and deflation for decades, kept its short-term rate slightly below zero until March 2024 and raised it only slowly afterwards, to about 1% by mid-2026.
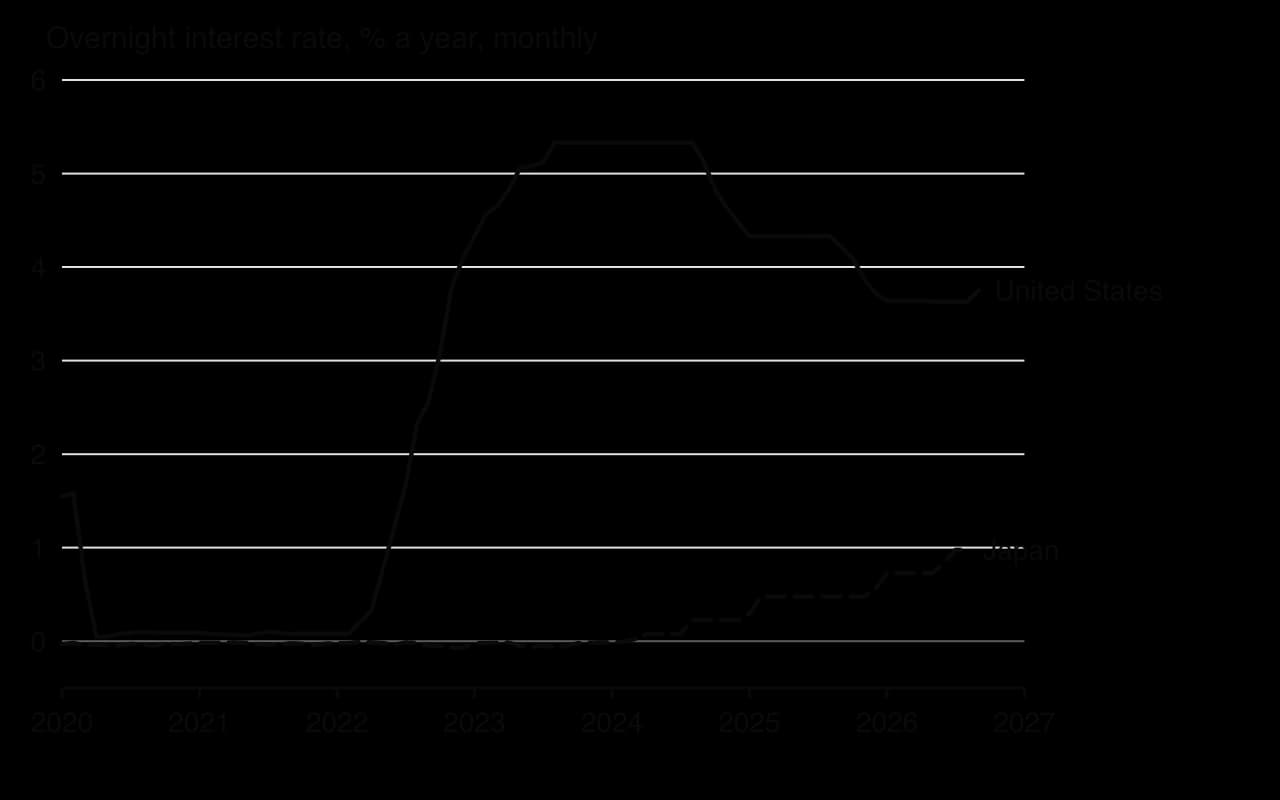
With dollar deposits and bonds paying around five percentage points more than yen assets, Japanese investors bought dollar assets (increasing the supply of yen) and foreign investors had little reason to hold yen (reducing demand).
The carry trade added to the pressure: investors borrowed yen at almost zero interest and sold them to buy higher-yielding dollar assets. On the exchange rate diagram for the yen, demand shifted left and supply shifted right, and the yen depreciated. In August 2024, when the Bank of Japan raised rates and US rates were expected to fall, carry trades were quickly unwound; the yen jumped from ¥161.7 per dollar in early July to ¥144.0 on 5 August, showing how fast speculative flows can reverse.
Japan’s Ministry of Finance, acting through the Bank of Japan, sold US dollars from its foreign exchange reserves and bought yen, shifting the demand for yen to the right. These were the first purchases of yen since 1998.
Dates | Yen bought (trillion yen) | Yen per US dollar before, approximately |
|---|---|---|
22 September 2022 | 2.84 | 144 |
21 and 24 October 2022 | 6.35 | 150 |
29 April and 1 May 2024 | 9.79 | 157–158 |
11 and 12 July 2024 | 5.53 | 161 |
30 April, 4 and 6 May 2026 | 11.73 | 159–160 |
30 July to 26 August 2026 (period total) | 15.40 | 164 |
Sources: Japan Ministry of Finance, Foreign Exchange Intervention Operations, historical data and monthly releases (2026); Federal Reserve H.10 via FRED, DEXJPUS (2026).
Each intervention pushed the yen up sharply for a few days or weeks; at the end of July 2026, at the start of a period in which Japan bought ¥15.4 trillion of yen, the rate moved from ¥163.9 per dollar on 29 July to ¥157.0 on 3 August. Over time, however, the yen weakened again whenever the interest rate gap remained wide.
This matches the theory, which predicts that intervention with reserves can smooth a currency’s path and punish one-way speculation, but it cannot hold a floating currency against a persistent force such as a large interest rate differential. In total Japan bought about ¥52 trillion of yen in these operations between 2022 and August 2026.
The weak yen had the effects that theory predicts. Imported energy and food became much dearer in yen, which helped to end Japan’s long period of very low inflation. Consumer price inflation, which had been −0.2% in 2021, averaged 2.5% in 2022, 3.3% in 2023, 2.7% in 2024 and 3.2% in 2025; part of this was imported inflation. Households’ real incomes were squeezed, and the yen-denominated cost of imported fuel was a political issue throughout the period.
Exporters and tourism gained. Japanese manufacturers earning dollars abroad reported higher profits in yen, and Japan became cheap for foreign visitors. International visitor arrivals rose from 31.9 million in 2019 to 36.9 million in 2024 and 42.7 million in 2025, both records, raising demand for yen from tourists and supporting jobs in hotels, transport and retail.
Sources: IMF, World Economic Outlook database, PCPIPCH, Japan (2026); Japan National Tourism Organization, via Wikipedia, “Tourism in Japan” (2026).
The yen’s fall shows that in a floating system short-term financial flows, driven by interest rate differentials and expectations, can dominate trade flows. It shows the trade-off a central bank faces: raising interest rates quickly would have supported the yen but risked choking a fragile recovery after decades of low inflation, which is the loss of monetary independence that defending a currency requires. It also shows the costs and gains of a depreciation falling on different groups, with exporters and tourism gaining while households paid more for imports.
The case has limits. Other forces were at work at the same time, including high world energy prices in 2022 (which raised Japan’s import bill and so the supply of yen) and the oil price rise of 2026, so not all of the yen’s fall can be attributed to interest rates. The effect of each intervention is hard to separate from that of other news on the same days. And Japan, with some of the largest foreign exchange reserves in the world, could intervene on a scale that most countries could not; a country with smaller reserves would have had to raise interest rates or let its currency fall.
Sources: Federal Reserve and OECD via FRED (FEDFUNDS, IRSTCI01JPM156N, EXJPUS, DEXJPUS), 2026; Japan Ministry of Finance (2026); IMF World Economic Outlook (2026); JNTO (2026).
Exchange rates appear in all papers. Paper 1 part (a) asks for explanation with an exchange rate or AD/AS diagram, and part (b) for evaluation of a currency change or a system. Paper 2 regularly includes the two calculations, definitions such as depreciation and devaluation, and a diagram explaining why a currency moved. At HL, Paper 1 can ask for an evaluation of fixed against floating systems, and Paper 3 combines exchange rate calculations with policy recommendations.
Calculations must show working and units, and a percentage change in a currency must use the price of that currency.
A Paper 2 part (g) on exchange rates usually asks for an evaluation using a text about one country, for example: “Using information from the text/data and your knowledge of economics, evaluate the central bank’s decision to let the currency float.” A good answer quotes figures from the text (the size of the fall, inflation, reserves), uses a diagram for the old peg and for the float, and weighs the gains (no more reserve losses, exporters more competitive, the end of the parallel market) against the costs (imported inflation, higher debt costs) for the stakeholders named in the text before reaching a judgment.
An exchange rate is the price of one currency in terms of another; in a floating system it is set by the demand for and supply of the currency on the foreign exchange market.
Demand for a currency comes from foreigners buying the country’s exports and assets (and remittances); supply comes from residents buying imports and foreign assets.
A floating currency appreciates when demand rises or supply falls, and depreciates when demand falls or supply rises; trade, FDI, portfolio flows, remittances, speculation, relative inflation, interest and growth rates and central bank intervention all shift the curves.
Percentage changes must use the price of the currency being measured; a price is converted by multiplying or dividing by the rate.
A depreciation raises net exports and AD but also import costs, so it tends to raise growth, employment and inflation; its effect on the current account and living standards depends on elasticities, spare capacity and import dependence.
A fixed rate is maintained with reserves, interest rates and exchange controls; deliberate changes are devaluations and revaluations.
A managed rate floats within limits set by central bank intervention; a rate held above equilibrium is overvalued (excess supply), below it undervalued (excess demand).
Fixed rates offer certainty and discipline at the cost of monetary independence and crisis risk; floating rates offer flexibility at the cost of volatility (HL).
I can explain how a floating exchange rate is determined and draw the diagram with correct labels.
I can calculate the price of a good in another currency.
I can calculate the percentage appreciation or depreciation of a currency, using the price of the right currency.
I can explain how each factor (trade, FDI, portfolio investment, remittances, speculation, inflation, interest and growth rates, intervention) shifts the demand or supply of a currency.
I can use AD/AS diagrams to evaluate the consequences of a depreciation or appreciation for inflation, growth, unemployment, the current account and living standards.
I can distinguish devaluation and revaluation from depreciation and appreciation.
I can explain, with a diagram, how a central bank maintains a fixed exchange rate.
I can explain a managed exchange rate and overvalued and undervalued currencies with diagrams.
I can evaluate fixed and floating exchange rate systems and reach a judgment for a particular country (HL).
4.1
2.3 |
Inflation (annual % change in CPI) | 3.2 | 9.4 |
Unemployment (% of labour force) | 6.5 | 8.1 |
Exchange rate (RDL per US$) | 4.00 | 6.00 |
Population in extreme poverty (%) | 14.0 | 11.5 |
Text B — Soy, forests and soil in the Northern Province
[1] Rendalia's Northern Province contains large areas of tropical forest. Over the past decade, soy farms have expanded rapidly into the forest. Fertile, cleared land has become increasingly scarce, and each new farm must be carved out of forest on poorer, more distant land.
[2] The price of cleared farmland in the province has more than doubled since 2015. Smaller farmers, unable to afford land close to roads and ports, have moved deeper into the forest, where transport costs are higher and yields are lower.
[3] Agricultural economists have estimated the combinations of soybeans and forest products (timber, nuts and resins harvested sustainably) that the province could produce each year if all of its land, labour and capital were fully employed (Table 2).
[4] Clearing the forest has consequences beyond the farms themselves. Without tree cover, heavy rains wash away topsoil, reducing yields on existing farms and filling rivers with silt that damages fisheries downstream. Indigenous communities who depend on the forest for food and income have lost land, and the burning that accompanies clearance releases large quantities of carbon dioxide.
Table 2: Production possibilities of the Northern Province (per year)
Combination | Soybeans (thousand tonnes) | Forest products (thousand cubic metres) |
|---|---|---|
A | 0 | 500 |
B | 200 | 460 |
C | 400 | 360 |
D | 600 | 200 |
E | 800 | 0 |
Text C — A new strategy for growth
[1] In 2025 Rendalia's government announced a new strategy. A 5 % tax will be charged on the value of soybean exports. Half of the revenue will fund payments to landowners who keep forest standing, and the other half will pay for rural roads, agricultural research to raise yields on existing farmland, and training for workers in ecotourism.
[2] Soy producers argue that the tax will make them less competitive against producers in other countries and reduce export earnings. Environmental groups say the payments for keeping forest are too low to stop clearing. Tourism operators welcome the plan; a hotel night in a southern eco-lodge costs RDL 360, and they say the weaker rendal has made Rendalia an attractive destination for foreign visitors.
Define the term depreciation indicated in bold in the text (Text A, paragraph 2).
2 marks
Vague definition [1]: The idea that the currency becomes weaker / worth less.
Accurate definition [2]: An understanding that it is a fall in the value of a currency in terms of another currency in a floating (market-determined) exchange rate system.
N.B. A definition that refers to a government decision (devaluation) should be awarded [1].
Define the term scarce indicated in bold in the text (Text B, paragraph 1).
2 marks
Vague definition [1]: The idea that there is not enough of something.
Accurate definition [2]: An understanding that a resource is scarce when it is limited relative to the needs and wants for it, so that using it for one purpose means it cannot be used for another (it has an opportunity cost).
Using information from Table 2, calculate the opportunity cost of one tonne of soybeans when the Northern Province moves from combination C to combination D.
2 marks
[1] for valid working, [1] for the correct answer of 0.8 cubic metres of forest products.
An answer of 0.8 without working is sufficient for [1].
Using information from Table 2, state whether the opportunity cost of soybeans rises, falls or stays the same as more soybeans are produced.
1 mark
It rises (e.g. from 0.2 m³ per tonne between A and B to 0.8 m³ between C and D and 1.0 m³ between D and E) [1].
Working not required.
Using information from Table 1 and Text C, paragraph 2, calculate the price in US$ of a hotel night in a southern eco-lodge in 2025.
2 marks
The price is US$60.
[1] for valid working, [1] for the correct answer of US$60.
An answer of US$60 without working is sufficient for [1].
Using an AD/AS diagram, explain how the central bank's increase in its interest rate is likely to affect inflation in Rendalia (Text A, paragraph 3).
4 marks
Level 1 [1–2]: There is a correct diagram OR an accurate written response.
Level 2 [3–4]: There is a correct diagram AND an accurate written response.
For Level 2, responses should include:
Diagram: AD shifting left from AD1 to AD2, with the average price level falling (or rising more slowly) from P1 to P2 and real output falling from Y1 to Y2.
Explanation: raising the interest rate from 5 % to 11 % increases the cost of borrowing and the reward for saving, so consumption and investment fall; AD falls, reducing demand-pull pressure, so the inflation rate (9.4 %) should fall towards the 3–5 % target, at the cost of lower real output and possibly higher unemployment.
Candidates who incorrectly label diagrams can be awarded a maximum of [3].
Vertical axis: average price level / price level / CPI; horizontal axis: real output / real GDP / real national income.
N.B. Candidates who note that much of the inflation is cost-push (Text A, paragraph 2), so the policy may reduce output more than inflation, should be rewarded.
Using an exchange rate diagram, explain why the rendal depreciated between 2015 and 2025 (Text A, paragraph 2 and Table 1).
4 marks
Level 1 [1–2]: There is a correct diagram OR an accurate written response.
Level 2 [3–4]: There is a correct diagram AND an accurate written response.
For Level 2, responses should include:
Diagram: a diagram for the rendal with demand for RDL shifting left (from D1 to D2) and/or supply of RDL shifting right (from S1 to S2), with the exchange rate falling (e.g. from US$0.25 to about US$0.17 per RDL).
Explanation: the fall in the world price of soybeans reduced the value of Rendalia's exports, so foreigners needed fewer rendals to pay for them (demand for RDL fell); foreign investors withdrawing funds sold rendals to buy US dollars (supply of RDL rose); both caused the rendal to depreciate from RDL 4.00 to RDL 6.00 per US$.
Candidates who incorrectly label diagrams can be awarded a maximum of [3].
Vertical axis: exchange rate / price of RDL in US$ (US$ per RDL); horizontal axis: quantity of RDL. A diagram for the US$ priced in RDL is acceptable if consistent.
Using a production possibilities curve (PPC) diagram, explain how soil erosion could affect the Northern Province's production possibilities (Text B, paragraph 4).
4 marks
Level 1 [1–2]: There is a correct diagram OR an accurate written response.
Level 2 [3–4]: There is a correct diagram AND an accurate written response.
For Level 2, responses should include:
Diagram: a PPC for soybeans and forest products shifting inward from PPC₁ to PPC₂ (an inward pivot with the soybean intercept moving towards the origin is also acceptable).
Explanation: topsoil is part of the factor of production land; when heavy rains wash it away, the quality of land falls and yields on existing farms decline, so the province can produce fewer soybeans from the same land; the loss of forest also reduces the potential output of forest products; production possibilities fall (the PPC shifts inward), reducing the output available to future generations.
Candidates who incorrectly label diagrams can be awarded a maximum of [3].
Axes: soybeans and forest products.
Using an externalities diagram, explain why the expansion of soy farming into the forest leads to a welfare loss (Text B, paragraph 4).
4 marks
Level 1 [1–2]: There is a correct diagram OR an accurate written response.
Level 2 [3–4]: There is a correct diagram AND an accurate written response.
For Level 2, responses should include:
Diagram: a negative production externality diagram with MSC above MPC (S), MPB = MSB (D), market output Qm greater than the socially optimal output Qopt, and the welfare loss triangle shaded between Qopt and Qm, pointing towards Qopt.
Explanation: soy farmers do not pay for the external costs of clearing forest: silt damaging downstream fisheries, loss of land and income for indigenous communities, and carbon dioxide emissions from burning; marginal social cost exceeds marginal private cost, so too much soy is produced on forest land; at Qm, the extra units cost society more than they are worth, giving a welfare loss.
Candidates who incorrectly label diagrams can be awarded a maximum of [3].
Vertical axis: price/costs/benefits; horizontal axis: quantity of soybeans.
Using information from the text/data and your knowledge of economics, evaluate the government's new strategy (Text C) as a way of achieving economic growth and sustainable development in Rendalia.
15 marks
Evaluate requires candidates to make an appraisal by weighing up the strengths and limitations.
Answers may include:
Terminology: economic growth, sustainable development, sustainability, scarcity, opportunity cost, export tax, negative externalities, payments for keeping forest (ecosystem services), infrastructure, diversification, exchange rate, real GDP.
Diagrams: negative production externality diagram with the export tax shifting MPC towards MSC; PPC showing an outward shift from agricultural research and roads (and avoidance of an inward shift from soil erosion); AD/AS diagram with LRAS shifting right; diagram showing the effect of the tax on soybean exports.
N.B. Diagrams given in answers to parts (c)–(f) and referred to here should be rewarded.
Theory: the export tax acts like a Pigouvian tax on an activity with negative externalities; using the revenue for research, roads and training raises productive capacity and diversifies the economy; payments for keeping forest give landowners an incentive to protect a resource whose benefits markets do not reward.
Strengths:
the tax raises the private cost of soy expansion, reducing the overproduction and welfare loss caused by deforestation (Text B, paragraph 4);
payments for standing forest protect forest products, fisheries, indigenous livelihoods and carbon storage (Text B, paragraph 4; Text C, paragraph 1), supporting sustainability;
research to raise yields on existing farmland (Text C, paragraph 1) allows soy output to grow without clearing more forest, and offsets the increasing opportunity cost of soy shown in Table 2 (0.8 m³ per tonne from C to D);
rural roads and ecotourism training diversify the economy towards tourism, the fastest-growing source of foreign exchange (Text A, paragraph 1), which benefits from the weaker rendal (a night costs only US$60, Text C);
may reduce rural poverty, which is still 11.5 % (Table 1).
Read the extracts and answer the questions that follow.
Text A — Overview of Kesharo
[1] Kesharo is a lower-middle-income, landlocked economy in Central Asia with a population of 14 million. Until the early 2000s it was a planned economy in which the state owned almost all farms and factories. Since then it has been in transition to a mixed economy: most shops, farms and small manufacturers are now privately owned, but the state still owns the natural gas company, the railways and several large industrial plants.
[2] Natural gas exports, sold to neighbouring countries under long-term contracts, account for over half of export revenue. Higher gas prices since 2021 have increased export earnings and government revenue, and real GDP growth has accelerated (Table 1). Around one in five working-age adults works abroad, and remittances sent home by these workers are equal to about 15 % of GDP.
[3] Strong inflows of foreign currency from gas exports and remittances have led to an appreciation of the kesh (KSH). Inflation has fallen but remains above the central bank's target of 5 %. Exporters of cotton textiles and dried fruit complain that the stronger kesh has made their products more expensive in foreign markets.
[4] Absolute poverty has fallen, but rural areas lag far behind the capital. Many rural schools and clinics lack qualified staff, and the government has promised to use part of its gas revenue to improve public services. Critics argue that too much of the revenue has been spent on subsidies and on loss-making state enterprises.
Table 1: Economic data for Kesharo
Indicator | 2020 | 2025 |
|---|---|---|
Real GDP growth (annual %) | 1.8 | 5.6 |
Inflation (annual % change in CPI) | 11.2 | 7.4 |
Youth unemployment (% of labour force aged 15–24) | 24.0 | 21.5 |
Exchange rate (KSH per US$) | 120 | 96 |
Table 2: Labour market data for Kesharo, 2025 (millions)
Labour force | Employed | Unemployed |
|---|---|---|
9.60 | 8.784 |
Text B — Bread prices and state bakeries
[1] A legacy of central planning is that the government still sets a maximum price for standard bread. In 2025 the maximum price was KSH 25 per loaf, while bakers estimate that the market price would be about KSH 40, as the cost of flour and energy has risen.
[2] Private bakers say they cannot cover their costs at the controlled price, and many have switched to producing specialty breads and pastries, whose prices are not controlled. State bakeries continue to produce standard bread but often run out by mid-morning. The government spends the equivalent of 1.2 % of GDP subsidizing state bakeries.
[3] The International Monetary Fund (IMF) has recommended that the price control be removed and replaced by cash payments to low-income families. The government fears protests if bread prices rise, and officials doubt that the social security system can identify all of the families who would need support.
Text C — Young people without work
[1] Despite faster growth, more than one in five young people in the labour force is unemployed, and many more work informally in low-paid jobs. Employers report that graduates of the state's universities and colleges lack practical skills, while there are shortages of electricians, welders and software technicians.
[2] In 2025 the government launched a vocational training programme, in partnership with private firms, to train 60 000 young people a year. Firms that offer apprenticeships receive a tax reduction. Critics say that the gas sector, which employs few workers, dominates investment, and that the government should do more to encourage private firms in manufacturing and services by reducing bureaucracy and the cost of starting a business.
[3] Many young people see emigration as the best option. Surveys suggest that two-thirds of school leavers would work abroad if they could, and some rural districts have lost a large share of their young men to construction jobs in neighbouring countries, leaving farms short of labour at harvest time. Their remittances support family incomes, but local employers say that the skills of those who leave are rarely replaced.
Define the term mixed economy indicated in bold in the text (Text A, paragraph 1).
2 marks
Define the term remittances indicated in bold in the text (Text A, paragraph 2).
2 marks
Using information from Table 2, calculate Kesharo's unemployment rate in 2025.
2 marks
Sketch a production possibilities curve (PPC) diagram to show the position of Kesharo's economy given the level of unemployment in 2025 (Table 2 and Text C, paragraph 1).
2 marks
Using information from Table 1, state whether the kesh appreciated or depreciated against the US dollar between 2020 and 2025.
1 mark
Using a demand and supply diagram, explain why there is a shortage of standard bread in Kesharo (Text B, paragraphs 1 and 2).
4 marks
Using an AD/AS diagram, explain how higher natural gas export revenues have contributed to faster growth in Kesharo's real GDP (Text A, paragraph 2 and Table 1).
4 marks
Read the extract and answer the questions that follow.
Text A — Why Vardenia's growth forecast went wrong
[1] Each January, Vardenia's finance ministry uses an economic model to forecast economic growth for the coming year. The model assumes that exchange rates, demand in export markets and energy prices remain at their levels at the time of the forecast.
[2] In January 2024 the model forecast real GDP growth of 3.0 % for the year. During 2024, however, a recession in Vardenia's largest trading partner reduced demand for its exports of machinery, and the vardenian lev (VDL) appreciated by 9 % against the US$.
[3] The ministry has been criticized for publishing a single figure without explaining the assumptions on which it depends.
Table 1: Real GDP of Vardenia (VDL billion, 2020 prices)
Year | Real GDP |
|---|---|
2023 | 412.0 |
2024 | 418.2 |
Define the term economic model indicated in bold in the text (Text A, paragraph 1).
2 marks
Using information from Table 1, calculate Vardenia's rate of economic growth in 2024.
2 marks
Using your answer to (b)(i), calculate the difference, in percentage points, between the forecast and the actual rate of growth in 2024.
1 mark
Using an AD/AS diagram, explain how the fall in demand for Vardenia's exports affected its real GDP (Text A, paragraph 2).
4 marks
Using information from Text A, explain two reasons why forecasts based on the ceteris paribus assumption may be inaccurate.
4 marks
soy producers may lose competitiveness and export earnings (Text C, paragraph 2), slowing growth that has already fallen from 4.1 % to 2.3 % (Table 1);
lower export earnings could weaken the rendal further, adding to inflation of 9.4 % (Table 1);
payments may be too low to stop clearing (Text C, paragraph 2); monitoring forest cover is costly;
research and roads take years to raise productivity; roads into forest areas may encourage further clearing;
with the interest rate at 11 % (Text A, paragraph 3), private investment needed for tourism and agriculture may be held back.
Synthesis/evaluation:
trade-off between short-run growth and long-run sustainability;
the outcome depends on the size of the tax and payments, enforcement and the price elasticity of demand for Rendalia's soy;
alternatives or complements: regulation (protected areas), land rights for indigenous communities, international climate finance;
a reasoned judgement on whether the strategy is likely to achieve both growth and sustainable development.
A maximum of [9] should be awarded if only economic growth or only sustainable development is addressed.
Examiners should be aware that candidates may take a different approach which, if appropriate, should be rewarded.
Markbands (best fit)
Level | Marks | Descriptor |
|---|---|---|
0 | 0 | The work does not reach a standard described by the descriptors below. |
1 | 1–3 | Little understanding of the demands. Theory is stated but not relevant. Terms are not relevant or are used incorrectly. No synthesis or evaluation. No use of the text/data, or it is merely copied. |
2 | 4–6 | Some understanding of the demands. Relevant theory is described. Some relevant terms are included. Synthesis or evaluation is relevant but superficial. Limited use of the text/data. |
3 | 7–9 | The demands are understood but only partially addressed. Theory is partly explained. Some terms are used appropriately. Diagram(s) are included where appropriate. Synthesis or evaluation is appropriate but lacks balance. Some relevant information from the text/data is used. |
4 | 10–12 | The demands are understood and addressed. Theory is explained. Terms are used appropriately. Diagram(s) are included and explained. Synthesis or evaluation is mostly balanced. Use of the text/data is generally appropriate, relevant and applied correctly. |
5 | 13–15 | The demands are thoroughly understood and addressed. Theory is fully explained. Terms are used appropriately throughout. Diagram(s) are fully explained. Synthesis or evaluation is effective and balanced. The text/data is appropriate, relevant and used to build a reasoned argument supported by analysis and evaluation. |
Using an exchange rate diagram, explain why the kesh appreciated between 2020 and 2025 (Text A, paragraph 3).
4 marks
Using a production possibilities curve (PPC) diagram, explain how the vocational training programme could increase Kesharo's output (Text C, paragraphs 1 and 2).
4 marks
Using information from the text/data and your knowledge of economics, discuss the appropriate balance between market forces and government intervention in Kesharo's economy.
15 marks