4.7 Sustainable development · IB Economics | Augment Education
4.7 Sustainable development
Explain what sustainable development means, how the Sustainable Development Goals turn it into targets, and (HL) how poverty and environmental damage reinforce each other.
IB Economics
Part of 4 The global economy
SL and HL
Key terms introduced here
Each is in the Economics glossary, with every other term in the subject.
The deterioration of the environment through the depletion of natural resources such as soil, water, forests and fish stocks, and through pollution and the loss of ecosystems.
Fairness in the distribution of resources and well-being between present and future generations, so that people alive today do not gain at the expense of people who will live later.
Eight international development goals agreed in 2000, with targets for 2015, focused on reducing extreme poverty, hunger, disease and illiteracy in developing countries.
The stock of natural resources, such as soil, forests, water, fish stocks, minerals and the atmosphere, that provides a flow of goods and services to the economy over time.
A natural resource, such as oil, coal or a metal ore, that exists in a fixed quantity, so that every unit used today reduces the amount available in the future.
Define sustainable development and explain its economic, social and environmental dimensions.
Distinguish between economic growth, economic development and sustainable development.
Explain why using up natural capital can raise output today but reduce production possibilities in the future.
Describe the Sustainable Development Goals (SDGs) and explain how they developed from the Millennium Development Goals.
Explain the synergies and trade-offs between different SDGs, using real examples.
Evaluate the SDGs as a framework for promoting sustainable development.
Explain how poverty can lead to environmental degradation (HL).
Explain why people in poverty suffer most from environmental degradation (HL).
Introduction
Sustainable development is development that improves people’s lives today without reducing the ability of future generations to improve theirs. It matters because many of the ways economies have grown, such as clearing forests, burning fossil fuels and overusing water and soil, raise output now while using up the resources that future output depends on.
The topic brings together several key concepts. It applies sustainability to the whole economy, it is a question of equity between people alive now and people not yet born, and it depends on interdependence, because carbon emissions in one country change the climate of every other. Most of the policies that promote it are forms of intervention.
Questions on 4.7
101 exam-style questions on this subtopic, written in the style of the IB papers. The first has its markscheme open. Counted on
Question 1 · ECON-0000625 marks
The atmosphere's capacity to absorb greenhouse gases has long been treated as if it were unlimited.
(a)
Explain why the atmosphere may once have been regarded as a free good and why its use now involves an opportunity cost.
[10]10 marks
Markscheme (a)
Answers may include:
Terminology: definitions of free good (a good that is not scarce, so its use has no opportunity cost), economic good (a scarce good with an opportunity cost), scarcity, opportunity cost, sustainability.
Explanation: when emissions were low relative to the atmosphere's capacity to absorb them, one person's use of clean air did not reduce the amount available to others, so there was no opportunity cost; as industrial production and fossil fuel use have grown, the absorptive capacity of the atmosphere has become limited relative to demand, so emitting more now reduces air quality and climate stability for others and for future generations; the cost of using it is the clean air, health and environmental quality forgone, so it has become an economic (scarce) good; link to sustainability, since current overuse compromises the ability of future generations to meet their needs.
Diagram: a PPC with manufactured goods and environmental quality (clean air) on the axes, showing that more manufactured output requires giving up environmental quality; or a negative production externality diagram (MSC above MPC).
A maximum of [6] should be awarded if only one of the two aspects (why it was free, why it now has an opportunity cost) is explained.
Markbands (best fit)
Try a quick-fire question
One of 40 short multiple-choice questions on 4.7. Pick an answer to see why it's right or wrong.
The diagram shows the environmental Kuznets curve. At which point does environmental damage per person fall as real GDP per capita rises?
Flashcards for 4.7
The official deck for this part of the syllabus.
4.7 Sustainable development · front
Explain why many ways economies have grown are a problem for sustainable development.
4.7 Sustainable development · front
State the four IB key concepts that sustainable development links, with what each means here.
4.7 Sustainable development214 cards
Carry on with 4.7 in Augment
With a free account, Augment remembers where you stopped and what you have practiced.
Payments to landowners or communities for managing land in a way that provides environmental benefits to others, such as protecting forest that stores carbon and keeps water supplies clean.
A natural resource, such as a forest, fish stock or groundwater, that regenerates naturally and can be used indefinitely if it is used no faster than it regenerates.
Seventeen goals with 169 targets, adopted by all UN member states in 2015, to end poverty, reduce inequality and protect the environment by 2030; they apply to every country.
Scope: At SL and HL, sustainable development covers what the term means and the Sustainable Development Goals. HL adds the two-way relationship between sustainability and poverty: how poverty can drive environmental damage, and why people in poverty suffer most from it.
Sustainability and natural capital
An economy produces goods and services by combining the factors of production. One of them, land, includes everything that nature provides: soil, forests, fish stocks, fresh water, minerals, fossil fuels and a stable climate. Economists often call this stock of natural resources natural capital, because, like machines and buildings, it produces a flow of goods and services over many years.
Natural resources fall into two groups. Renewable resources, such as forests, fish and groundwater, regenerate naturally, so they can be used indefinitely as long as the rate of use does not exceed the rate of regeneration. Non-renewable resources, such as oil, coal and metal ores, exist in a fixed quantity, so every unit used today is a unit that cannot be used later.
Type of resource
Examples
When its use is sustainable
Renewable
Forests, fish stocks, fresh water, soil fertility, solar and wind energy
When it is used no faster than it regenerates, so the stock does not shrink
Non-renewable
Oil, natural gas, coal, metal ores
Strictly never, because the stock only falls; in practice, when its use is slowed and its income is invested in other forms of capital or in substitutes
Environmental sinks
The atmosphere and oceans absorbing carbon dioxide and pollution
When waste is released no faster than the sink can absorb it
The idea of sustainability as a key concept follows directly. Resource use is sustainable when it meets present needs without reducing the stock of resources available to meet future needs. A fishery is used sustainably if the annual catch is no larger than the number of fish the stock adds each year; it is used unsustainably if the catch is larger, because the stock then falls and future catches must fall with it.
Why markets tend to overuse natural capital
Markets often fail to protect natural capital. Many environmental resources, such as the atmosphere, open-sea fisheries and unfenced forests, are common pool resources: no one can easily be excluded from using them, but one person’s use reduces what is left for others. Each user gains the full benefit of extra use but bears only a small part of the cost, so the resource is overused.
Pollution is also a negative externality of production. The firm that burns coal pays for the coal but not for the damage its carbon dioxide does to people elsewhere and in the future. Because future generations cannot take part in today’s markets, their interests are not reflected in today’s prices at all. This is the market failure behind the case for intervention to promote sustainable development.
What sustainable development means
The most widely used definition comes from the World Commission on Environment and Development, chaired by the former Norwegian prime minister Gro Harlem Brundtland. Its 1987 report, Our Common Future (the Brundtland Report), defined sustainable development in one sentence.
Development that meets the needs of the present without compromising the ability of future generations to meet their own needs.
— World Commission on Environment and Development, Our Common Future (1987)
The definition has two parts. The first, "meets the needs of the present", is about development now: in 2025 an estimated 808 million people still lived in extreme poverty, so present needs are far from met. The second, "without compromising the ability of future generations", sets a limit: the way present needs are met must not run down the resources, environment and institutions that later generations will depend on.
The second part is a question of intergenerational equity, fairness between generations. A generation that uses up a fish stock, a forest or the atmosphere’s capacity to absorb carbon gains at the expense of later generations, who are not present to object. Sustainable development also requires intragenerational equity, fairness within the present generation, because development that benefits only a minority while others go without basic needs does not meet "the needs of the present".
Sources: United Nations, _The Sustainable Development Goals Report 2025 (2025)._
The three dimensions of sustainable development
Sustainable development is usually described as having three dimensions, which the United Nations calls the economic, social and environmental dimensions. Development is sustainable only when it meets the goals of all three at once.
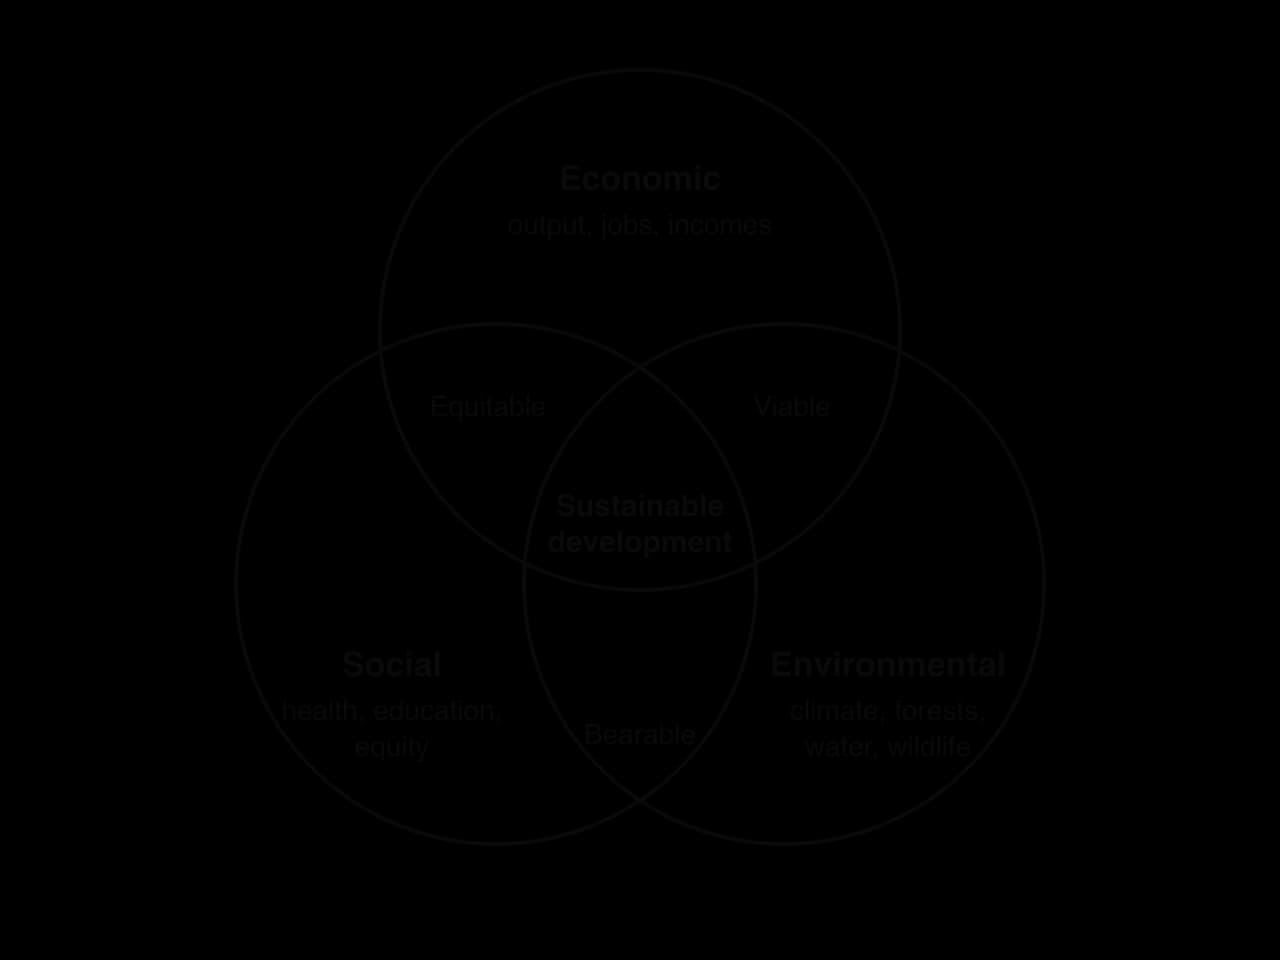
Sustainable development lies where all three circles overlap. Each area where only two circles overlap (equitable, viable, bearable) meets two dimensions but fails the third.
The diagram shows each dimension as a circle. The economic dimension concerns output, employment and incomes; the social dimension concerns health, education, equity and the ability of people to take part in society; the environmental dimension concerns the climate, forests, water, biodiversity and the stocks of natural resources. Where two circles overlap, development succeeds on two dimensions only: economic and social progress without environmental limits is "equitable" but not lasting, while economic activity within environmental limits but without social progress is "viable" but leaves people behind.
Dimension
What it requires
An example of failure on this dimension
Economic
Rising output and incomes that can be kept up over time
Growth that depends on a single resource and collapses when the resource runs out or its price falls
Social
Rising health, education and living standards, shared fairly; basic needs met
Rapid growth whose gains go to a small elite while access to schools and clinics stays poor
Environmental
Using renewable resources no faster than they regenerate; keeping pollution within what the environment can absorb
Clearing forest for farmland, so that soil erodes and rainfall patterns change
Growth, development and sustainable development
Three ideas are easily confused. Economic growth is an increase in real GDP, the quantity of goods and services an economy produces. Economic development is a broader improvement in people’s well-being: higher incomes, but also better health, more education, less poverty and more freedom to choose how to live. Sustainable development adds a time dimension: development that can be kept up because it does not destroy the conditions it depends on.
Concept
What it measures or describes
Typical indicators
Economic growth
An increase in real output (real GDP or real GDP per capita)
Growth rate of real GDP
Economic development
An increase in well-being: income, health, education, poverty, freedom
GDP per capita at PPP, life expectancy, schooling, HDI
Sustainable development
Development that can be kept up without reducing future generations’ ability to meet their needs
Development indicators plus resource stocks, carbon emissions, forest cover
Growth can occur without development, if its gains are not shared or not spent on health and education. Development can occur with little growth, if a country uses modest resources well. And both growth and development can be unsustainable, if they are achieved by running down natural capital. Sustainable development is therefore a stricter test than either of the other two: it asks whether today’s growth and development can still be kept up decades from now.
Using up natural capital: a PPC view
The production possibilities curve (PPC) shows why unsustainable growth is self-defeating. A country can raise output of agricultural goods this year by clearing forest for farmland, ploughing steep slopes and pumping groundwater faster than rain replaces it. Measured output rises, so GDP grows.
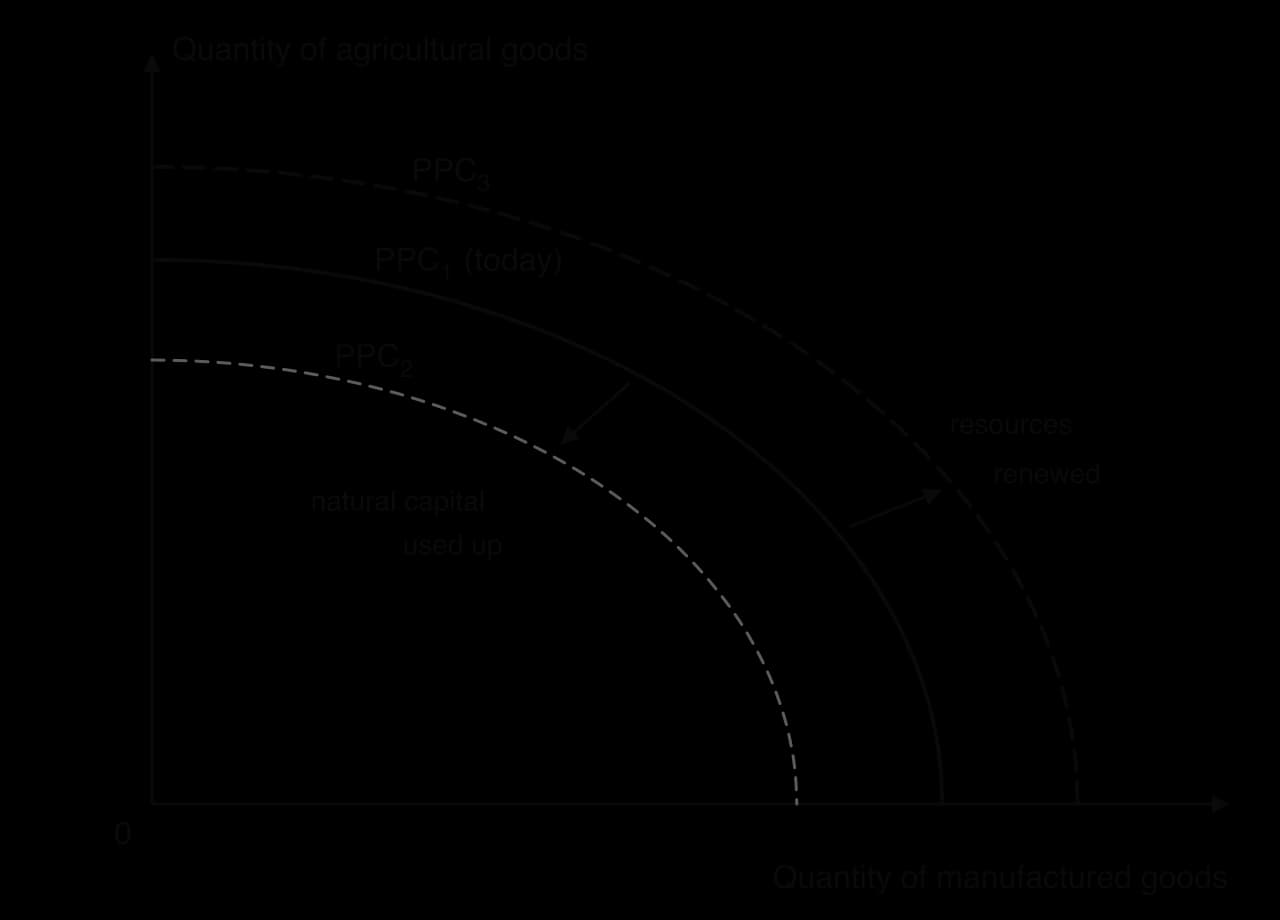
Running down natural capital (soil, forest, groundwater) reduces the quantity and quality of land, shifting future possibilities in from PPC₁ to PPC₂. Renewing resources and investing in them shifts the curve out to PPC₃.
The diagram shows the effect over time. Natural capital is part of the factor of production land, so when soil erodes, aquifers run dry and fish stocks collapse, the economy has fewer resources to produce with, and the PPC shifts inward from PPC₁ to PPC₂. The output gained today is paid for by lower possible output in the future. A sustainable path keeps the stock of natural capital intact, or replaces what it uses with other capital, so that the PPC can shift outward to PPC₃.
Standard national accounts hide this cost. GDP counts the timber sold from a cleared forest as output, but nothing is subtracted for the loss of the forest itself, so a country can appear to grow while becoming poorer in total resources. Measures such as green GDP try to correct this by deducting the depletion of natural resources and the cost of environmental damage.
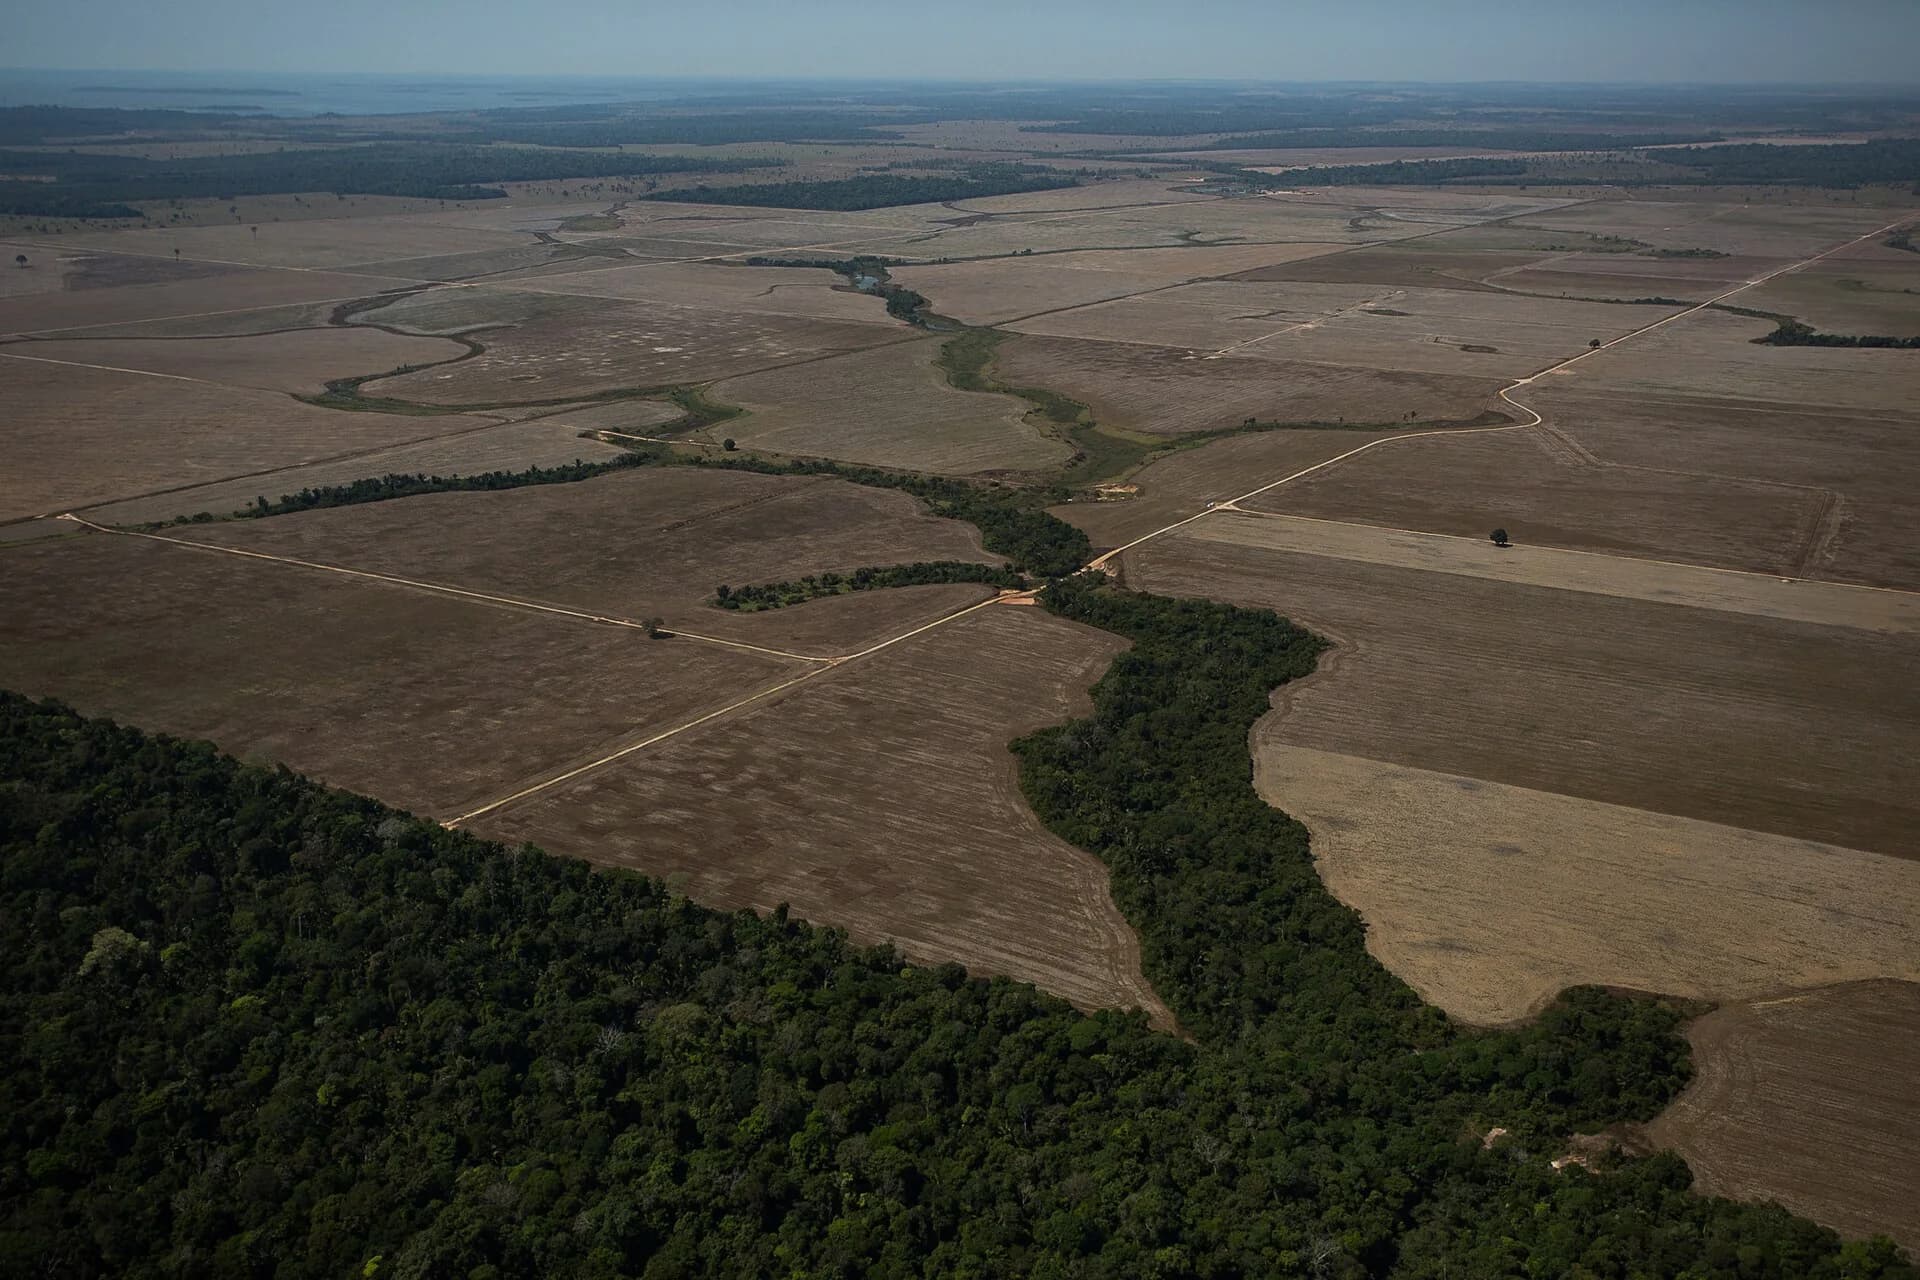
Forest cleared for farmland in Rondônia, Brazil (2020). The cleared land adds to measured output, but the loss of forest, soil and biodiversity is not subtracted from GDP. Photo: Amazônia Real from Manaus AM, Brasil, CC BY 2.0, via Wikimedia Commons.
The photograph shows the edge of the Amazon forest in the Brazilian state of Rondônia, with dense forest in the foreground and cleared fields beyond. The farmland produces crops and cattle that are counted in GDP. The forest that was cleared stored carbon, protected soil and supported rainfall, and none of these losses appears in the national accounts.
Weak and strong sustainability
Economists disagree about how strict the "future generations" condition should be. The disagreement turns on whether natural capital can be replaced by other kinds of capital, such as machines, infrastructure and human capital.
View
Main idea
What it allows
Criticism
Weak sustainability
What matters is the total stock of capital (natural, physical and human) passed to the next generation
Using up oil or forest is acceptable if the income is invested in schools, roads or other assets of equal value
Some natural capital, such as a stable climate or biodiversity, has no substitute, and its loss may be irreversible
Strong sustainability
Critical natural capital must be kept intact, because it cannot be replaced by other capital
Using renewable resources only within their regeneration rate; protecting key ecosystems whatever the income forgone
It may forbid uses of resources that would greatly raise living standards, especially in low-income countries
Norway’s oil fund is often given as an example of weak sustainability in practice: the government saves its oil revenue in a sovereign wealth fund and spends only part of the return, turning a non-renewable resource into a lasting financial asset. The climate is the clearest case for strong sustainability, because no investment can easily replace a stable climate once greenhouse gases have accumulated.
Can growth be sustainable?
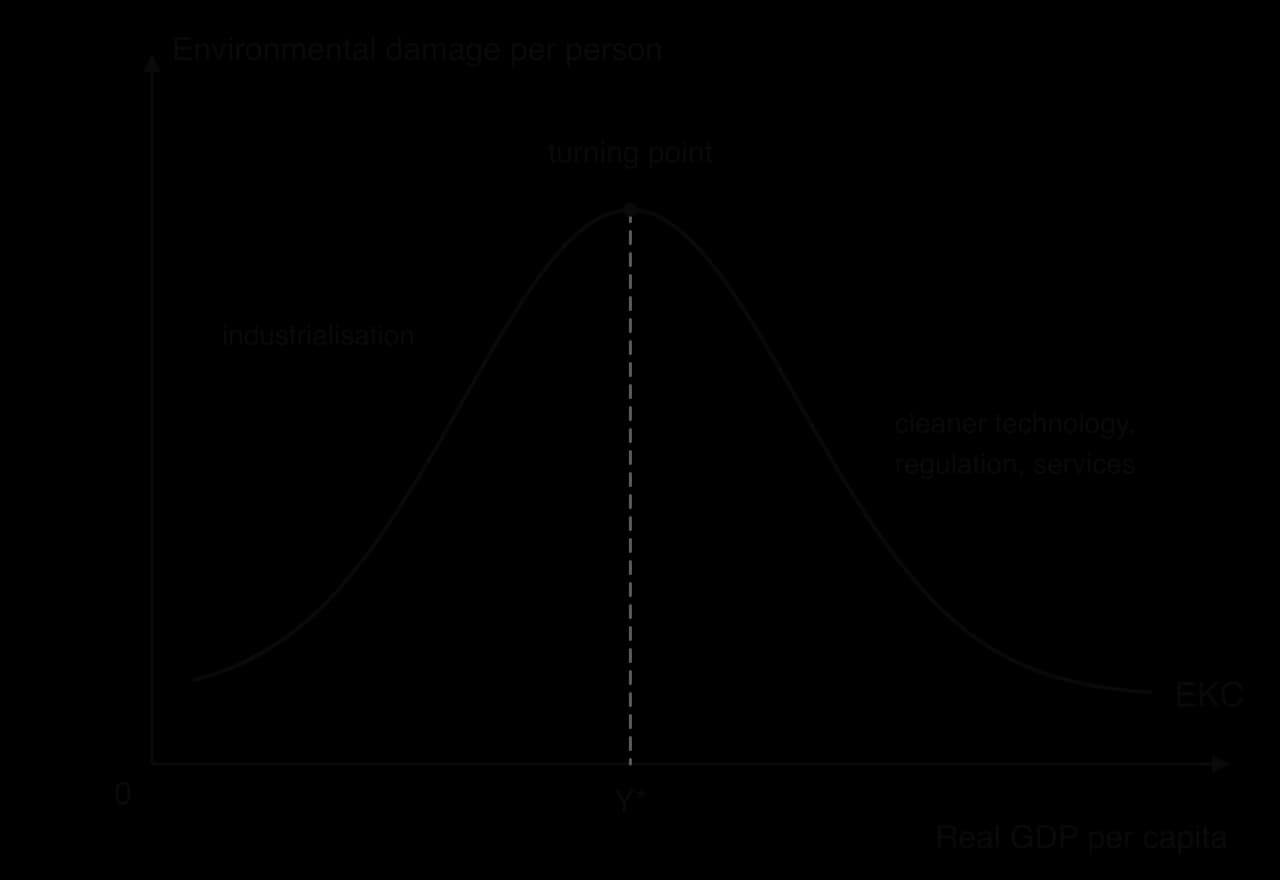
One hypothesis suggests that growth eventually solves the environmental problems it creates. The environmental Kuznets curve (EKC) proposes that as real GDP per capita rises, environmental damage per person first increases, as the economy industrialises, and then decreases, as households demand a cleaner environment, governments regulate pollution, technology improves and the economy shifts towards services.
The EKC hypothesis: damage rises during industrialisation, peaks at the turning point Y*, and falls at higher incomes. The evidence supports this shape for some local pollutants, much less for carbon dioxide.
The curve shows damage rising with income up to Y* and falling beyond it. The evidence for the hypothesis is mixed. It fits some local pollutants, such as sulphur dioxide and urban smoke, which high-income countries have reduced through regulation. It fits global pollutants such as carbon dioxide much less well, because their costs fall mainly on other countries and future generations, so voters in high-income countries have less reason to demand cuts. Some of the apparent fall also comes from moving polluting industries to lower-income countries rather than ending the pollution.
A related idea is decoupling: growth in real GDP alongside a fall in resource use or emissions. Several high-income economies have reduced their territorial carbon emissions while their real GDP grew, mainly by replacing coal with gas and renewable electricity. Whether decoupling can be fast enough and global enough to meet climate targets is one of the central debates about sustainable development.
From the Millennium Development Goals to the SDGs
International efforts to promote development have, since 2000, been organised around shared goals with measurable targets and deadlines. Goals of this kind give governments, aid donors and international organisations a common agenda and a way to track progress.
The Millennium Development Goals, 2000–2015
At the Millennium Summit in September 2000, world leaders adopted the Millennium Declaration, from which came eight Millennium Development Goals (MDGs) with 21 targets, to be achieved by 2015. They focused on the basic needs of people in low-income countries.
Eradicate extreme poverty and hunger.
Achieve universal primary education.
Promote gender equality and empower women.
Reduce child mortality.
Improve maternal health.
Combat HIV/AIDS, malaria and other diseases.
Ensure environmental sustainability.
Develop a global partnership for development.
Progress was real but uneven. The share of people in developing countries living on less than $1.25 a day halved to 21% (1.2 billion people) between 1990 and 2010, so the target of halving extreme poverty was met before the deadline, largely because of rapid growth in China. Child and maternal mortality fell, but by less than the targets required, and the sanitation and education targets were missed.
The MDGs were also criticised for their design. They were drawn up mainly by rich countries and international organisations, with little involvement from the countries they were meant to help. They applied only to developing countries, treating development as something poor countries needed and rich countries funded. And they gave little weight to the environment: environmental sustainability was one goal of eight, not a condition for all of them.
Sources: _The Economist, “Poverty: Growth or safety net?” (21 September 2013); D. Hulme and J. Scott, “The Political Economy of the MDGs” (2010); both via Wikipedia, “Millennium Development Goals” (accessed 2026)._
The Sustainable Development Goals, 2015–2030
On 25 September 2015 all 193 member states of the United Nations adopted Transforming our world: the 2030 Agenda for Sustainable Development. At its centre are the 17 Sustainable Development Goals (SDGs), with 169 targets to be met by 2030 and a set of more than 200 indicators to measure them.
The SDGs differ from the MDGs in four main ways. They are universal, applying to high-income countries as well as low-income ones. They are broader, covering inequality, jobs, cities, consumption, peace and institutions as well as basic needs. They put sustainability at the centre, with several goals on climate, oceans, land and resource use. And they were drawn up through a much wider consultation, including governments of developing countries and civil society.
Goal
Short name
Goal
Short name
1
No poverty
10
Reduced inequalities
2
Zero hunger
11
Sustainable cities and communities
3
Good health and well-being
12
Responsible consumption and production
4
Quality education
13
Climate action
5
Gender equality
14
Life below water
6
Clean water and sanitation
15
Life on land
7
Affordable and clean energy
16
Peace, justice and strong institutions
8
Decent work and economic growth
17
Partnerships for the goals
9
Industry, innovation and infrastructure
The 2030 Agenda groups its commitments under five headings, often called the "five Ps": people (ending poverty and hunger), planet (protecting the planet from degradation), prosperity (prosperous and fulfilling lives for all), peace (peaceful, just and inclusive societies) and partnership (mobilising the means to carry out the Agenda). It also commits countries to "leave no one behind", reaching those furthest behind first.
The goals are meant to be pursued together. The Agenda describes them as "integrated and indivisible", balancing the economic, social and environmental dimensions of sustainable development. Grouping the goals by dimension is a useful way to remember them.
Dimension
SDGs most closely linked to it
Social (people)
1 No poverty, 2 Zero hunger, 3 Good health, 4 Quality education, 5 Gender equality, 6 Clean water and sanitation
Economic (prosperity)
7 Affordable and clean energy, 8 Decent work and economic growth, 9 Industry, innovation and infrastructure, 10 Reduced inequalities, 11 Sustainable cities
Environmental (planet)
12 Responsible consumption and production, 13 Climate action, 14 Life below water, 15 Life on land
Institutions and means (peace and partnership)
16 Peace, justice and strong institutions, 17 Partnerships for the goals
YouTube
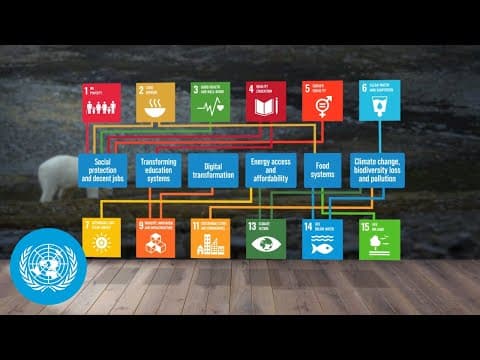
United Nations: a three-minute stocktake of how far the world is from the SDGs and what it would take to reach them.
The video sets out the gap between the goals and progress so far, which the UN’s annual progress reports measure target by target.
Sources: United Nations General Assembly, _Transforming our world: the 2030 Agenda for Sustainable Development (2015)._
How far has progress gone?
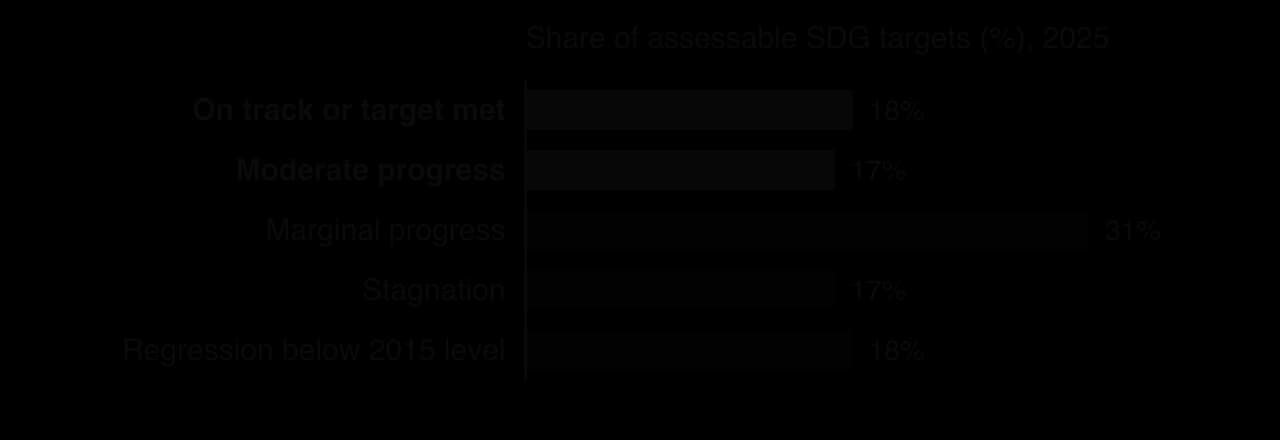
Each year the UN assesses progress on every target for which data exist. Its 2025 report could assess 139 of the 169 targets, comparing the trend since 2015 with what would be needed to reach each target by 2030.
With five years to go, only 35% of assessable SDG targets were on track or making moderate progress; 18% had gone backwards since 2015. Source: United Nations, The Sustainable Development Goals Report 2025 (2025).
The chart shows that only 18% of targets were on track and a further 17% were making moderate progress. Nearly half (48%) showed marginal progress or none at all, and 18% had regressed below their 2015 level. The COVID-19 pandemic, conflicts, the rise in food and energy prices after 2021 and higher interest rates all set progress back.
The picture differs between goals. Access to electricity rose from 84% of the world’s population in 2010 to 92% in 2023, and access to clean cooking fuels from 64% to 74% between 2015 and 2023. But the number of people without electricity in sub-Saharan Africa barely changed, at about 565 million, because population growth kept pace with new connections. Extreme poverty affected about 808 million people in 2025, measured at the World Bank’s new international poverty line of $3.00 a day (2021 PPP), and the report judged its eradication by 2030 "highly unlikely". 2024 was the hottest year on record, about 1.55°C above pre-industrial levels.
Sources: United Nations, _The Sustainable Development Goals Report 2025 (2025)._
Synergies and trade-offs between the goals
Because the goals are interdependent, progress on one can help or hinder progress on others. A synergy exists when action on one goal also advances another; a trade-off exists when progress on one goal makes another harder to reach.
Synergies
Clean cooking is a clear synergy. When households replace wood and charcoal stoves with gas, electric or improved stoves (SDG 7), indoor air pollution falls (SDG 3), women and children spend less time collecting fuel (SDGs 4 and 5) and less forest is cut for fuel (SDG 15). Education for girls (SDG 4) is another: it raises future earnings (SDG 1), lowers child mortality (SDG 3) and promotes gender equality (SDG 5).
Kenya’s geothermal power is an example of growth and climate goals supporting each other. Power stations in the Rift Valley, at Olkaria, use underground heat to generate electricity, and renewable sources produced 78% of Kenya’s electricity in 2021. Cheap, reliable power supports industry and jobs (SDGs 8 and 9) without the carbon emissions of coal or oil (SDG 13).
Sources: World Bank, World Development Indicators, renewable electricity output, from IEA (2026).
Trade-offs
Some goals pull in different directions, at least in the short run. Raising food output (SDG 2) can mean clearing forest for farmland and using more fertiliser and water, against SDGs 6, 14 and 15. Rapid industrial growth (SDGs 8 and 9) has historically relied on fossil fuels, against SDG 13. Even renewable energy has trade-offs: large hydroelectric dams can flood farmland and displace communities, and mining the lithium and cobalt that batteries need damages land and water near the mines.
Goals involved
Synergy or trade-off
Mechanism
7 (clean energy) and 3, 5, 15
Synergy
Clean stoves cut indoor air pollution, time spent collecting fuel and forest loss
4 (education) and 1, 3, 5
Synergy
Educated girls earn more, marry later and have healthier children
2 (zero hunger) and 15 (life on land)
Trade-off
More farmland and fertiliser can mean deforestation and polluted rivers
8 (growth) and 13 (climate action)
Trade-off (can be reduced)
Growth powered by fossil fuels raises emissions; renewable energy and decoupling reduce the conflict
9 (industry) and 6 (clean water)
Trade-off
Factories and mines can pollute water sources unless regulated
Evaluating the SDGs
The SDGs are the most widely accepted framework for sustainable development, but economists and development experts debate how useful they are.
Strengths
They give governments, donors, firms and NGOs a shared agenda, which helps coordinate action and aid across countries.
Measurable targets and indicators create accountability: annual reports show which goals are off track and where.
They are universal, so high-income countries, whose consumption causes most carbon emissions, are also responsible for progress.
They treat development as multidimensional and link it to the environment, rather than treating growth in GDP as the only aim.
The goals helped improve data: many countries now collect statistics on poverty, health and the environment that did not exist before.
Limitations
With 17 goals and 169 targets, the framework gives little guidance on priorities when resources are scarce; critics argue that a short list of the most cost-effective targets would achieve more.
The goals are not legally binding, and there is no penalty for missing them; progress depends on national policies and on finance.
Trade-offs between goals are not resolved by the framework, so countries can choose the goals that suit them and ignore others.
Data are missing for many targets and countries: 30 of the 169 targets could not be assessed in 2025.
Reaching the goals requires large amounts of investment that many low-income countries, often burdened by debt, cannot finance on their own.
A balanced judgment is that the SDGs have succeeded better as a common language and a measurement system than as a plan. They have helped focus attention and data on the poorest groups and on the environment, but with only about a third of targets on course, their success depends on factors outside the framework: financing, national policy, peace and the willingness of high-income countries to reduce their emissions and support others.
YouTube
EconplusDal: the meaning of sustainable growth and sustainable development, and the tensions between growth and the environment (8 minutes).
The video revises the definition and the conflict between growth and sustainability, including the role of natural capital.
Sustainability and poverty (HL only)
Poverty and environmental damage are linked in both directions. Poverty can push people to use natural resources in unsustainable ways, and environmental degradation in turn reduces the incomes and health of people in poverty, who depend most on natural resources and have the least protection from environmental harm. Each can make the other worse, forming a cycle.
How poverty leads to environmental degradation
Short time horizons
A household that struggles to meet today’s needs has little choice but to put the present before the future. A farmer with no savings may have to cut trees for fuel or plant crops on steep slopes this year, even though the soil will erode and yields will fall later. Economists describe this as a high rate of time preference: when survival this year is at stake, future benefits count for very little.
Dependence on natural resources for fuel and income
People in poverty rely heavily on biomass, such as wood, charcoal and crop waste, for cooking because they cannot afford gas or electricity, or have no access to them. In 2024 only about 16% of people in low-income countries had access to clean cooking fuels and technologies, compared with over 99% in high-income countries. Most rural incomes in low-income countries come from farming, fishing and forest products, so pressure on these resources rises with population.
Lack of property rights and credit
Many poor households farm land they do not legally own, or use forests and fisheries that are common pool resources. Without secure property rights, a farmer has little reason to invest in terracing, tree planting or soil conservation, because there is no guarantee of benefiting from the investment later. Without access to credit, even a farmer who wants to invest in better methods, such as drip irrigation or improved stoves, cannot pay the upfront cost.
Marginal land
When good land is owned by a few, or taken by population growth, poor households are pushed onto marginal land: steep hillsides, dry areas and forest edges. This land is the most easily damaged when cleared, so the same activity causes more erosion and degradation than it would on flat, fertile land.
Haiti illustrates several of these mechanisms. Most Haitian households depend on wood and charcoal as their main fuel, and only about 6% had access to clean cooking fuels in 2024. Charcoal production, estimated at close to a million tonnes a year, is a source of income for many rural households. Unequal land distribution left many farmers on steep, easily eroded slopes, and large amounts of topsoil are washed away each year, lowering farm yields. Estimates of how much forest remains vary widely, from under 1% (primary forest only) to around 30%, depending on the definition used, but the loss of soil and tree cover on hillsides is not disputed.
Sources: World Bank, World Development Indicators, access to clean fuels and technologies for cooking (2026); A. Tarter, _Charcoal in Haiti: A National Assessment of Charcoal Production and Consumption Trends, World Bank/PROFOR (2018); Hedges et al., PNAS (2018); Churches et al., International Journal of Applied Earth Observation and Geoinformation (2014); USAID (2000); all via Wikipedia, “Deforestation in Haiti” (accessed 2026)._
Why people in poverty suffer most from environmental degradation
The effects run in the other direction too. Environmental degradation harms everyone, but it harms people in poverty most, for several reasons.
Their incomes depend directly on natural capital. When soil erodes, fish stocks fall or rains fail, a smallholder farmer or fisher loses income, while a city office worker in a high-income country is barely affected.
They are more exposed. Low-income households are more likely to live on floodplains, unstable hillsides, coastal land and near polluting factories or waste sites, because land there is cheaper.
They are less able to cope. With no savings, insurance or social protection, one flood or drought can force a household to sell livestock or take children out of school, which reduces future income.
Their health suffers more. Polluted water and indoor smoke cause disease, and poor households have the least access to health care. The WHO estimates that household air pollution from cooking with polluting fuels caused about 2.9 million deaths in 2021, more than 309,000 of them children under five.
Women and children carry a large share of the burden. They usually collect fuel and water and spend most time near smoky stoves, so degradation takes time away from school and paid work.
Climate change magnifies these effects. Low-income countries are concentrated in tropical regions where higher temperatures, droughts, floods and storms do most damage to farming, and they have the least money to adapt. The World Bank estimated in 2020 that climate change could push between 68 million and 135 million people into poverty by 2030.
Sources: World Health Organization, "Household air pollution" fact sheet (accessed 2026); World Bank, "Global action urgently needed to halt historic threats to poverty reduction" (2020).
The poverty–environment trap
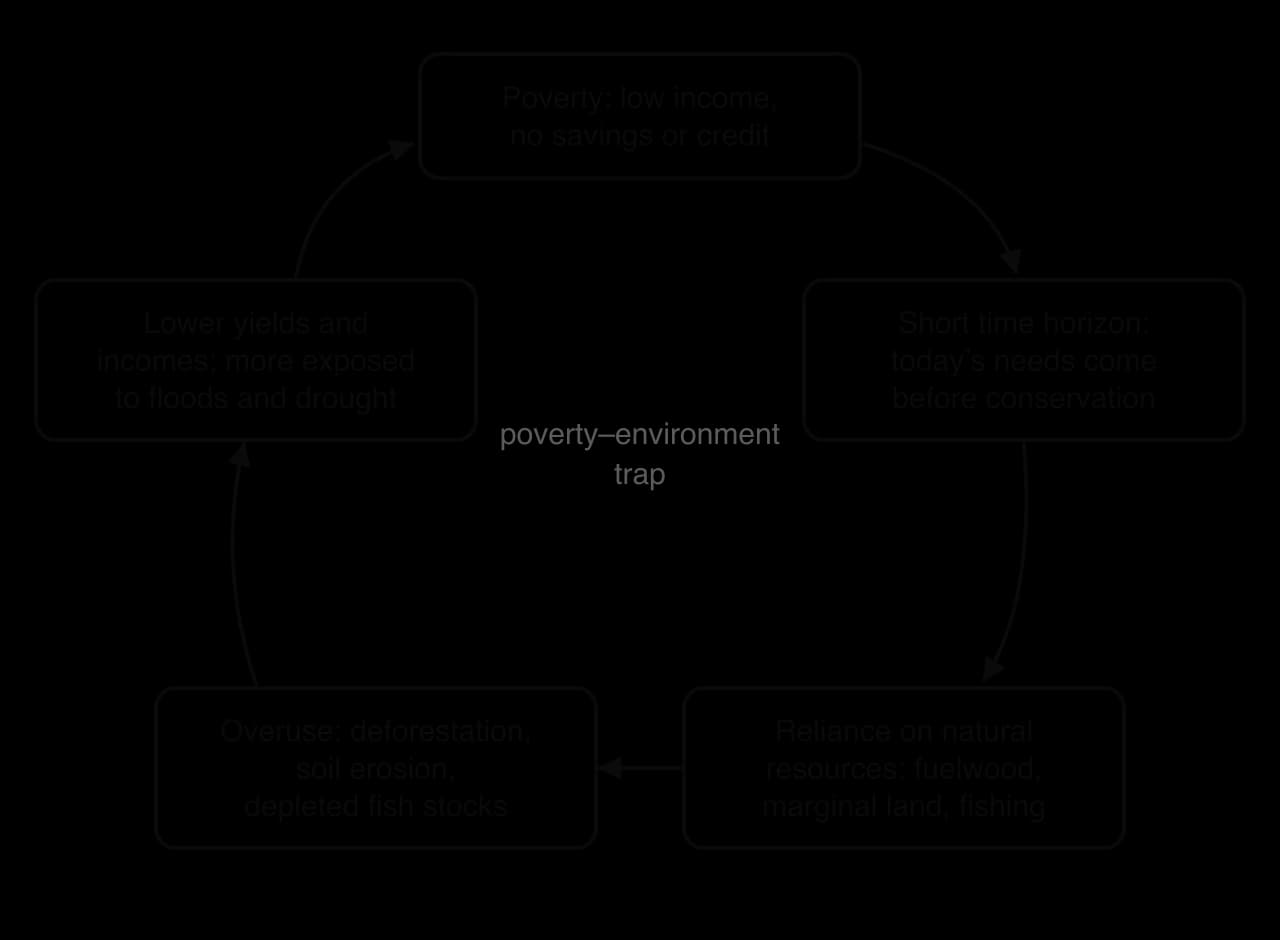
Putting the two directions together gives a cycle in which poverty and environmental degradation reinforce each other, sometimes called a poverty–environment trap.
Each stage leads to the next: poverty shortens time horizons, people rely more heavily on natural resources, overuse degrades them, and lower yields deepen poverty. Breaking any link can stop the cycle.
The cycle starts with poverty: low incomes and no savings or credit. Poverty shortens time horizons, so households meet today’s needs from the resources at hand: fuelwood, marginal land and open-access fisheries. Overuse leads to deforestation, soil erosion and depleted fish stocks. Degraded land and water yield less income and leave households more exposed to floods and drought, which deepens poverty and starts the cycle again. It is a specific form of the wider poverty trap that keeps low-income communities poor.
Who causes environmental damage and who bears it
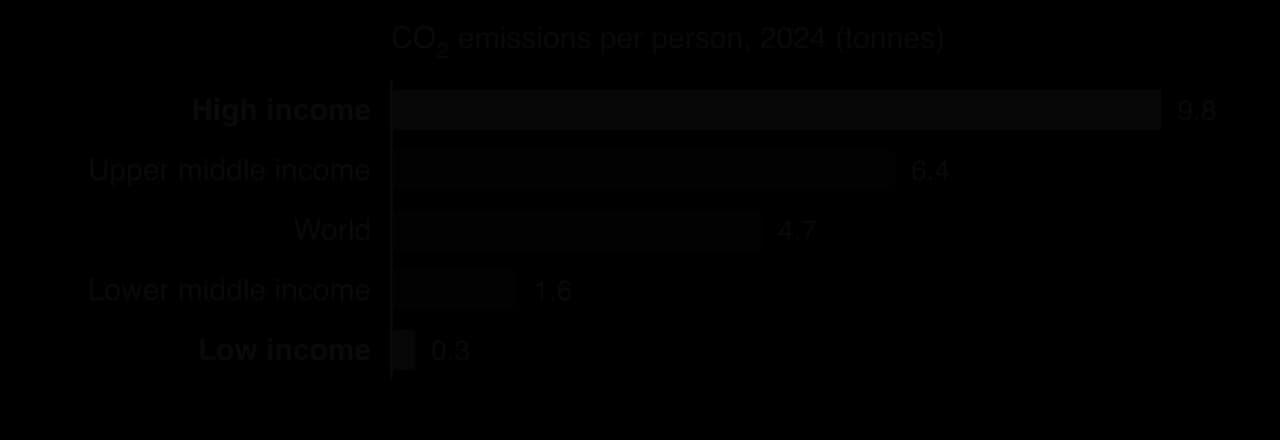
The relationship between poverty and the environment is also a question of equity between countries. Carbon dioxide emissions rise steeply with income, because higher-income households consume more energy, goods and transport.
In 2024 a person in a high-income country emitted about 32 times as much carbon dioxide as a person in a low-income country, yet low-income countries are among the most exposed to climate change. Source: World Bank, WDI, from EDGAR (2026).
The chart shows emissions per person of 9.8 tonnes in high-income countries and 0.3 tonnes in low-income countries in 2024. The countries that contribute least to climate change are among those that suffer most from it, which is why international climate negotiations debate climate finance: transfers from high-income countries to help low-income countries adapt and develop on a low-carbon path.
Breaking the link: policies and their limits
Because the cycle has several links, policies can target any of them. The most effective approaches usually raise incomes and protect natural capital at the same time.
Policy
Link it targets
Strengths
Limitations
Secure land titles and community rights over forests
Lack of property rights
Gives farmers a reason to invest in soil and trees; lets them use land as collateral
Titling is slow and costly; it can be captured by powerful groups and exclude women
Payments for ecosystem services
Short time horizons; income from clearing land
Pays poor landowners to protect forest, turning conservation into income
Needs lasting funding; payments may go to people who would have protected the forest anyway
Subsidised clean stoves and fuels (LPG, electricity)
Dependence on biomass
Cuts deforestation and indoor air pollution together
Costly; households may return to wood if fuel prices rise
Microfinance and crop insurance
Lack of credit and savings
Helps households invest and recover from shocks without selling assets
Interest rates can be high; reaches few of the poorest
Climate finance and adaptation spending (flood defences, drought-resistant seeds)
Exposure to environmental shocks
Reduces the damage climate change does to the poor
Promised international finance often arrives late or as loans
The judgment depends on the context. Where poverty is the main driver of degradation, as with fuelwood in Haiti, policies that raise incomes and provide alternatives to biomass protect the environment more effectively than bans on tree cutting, which poor households have little choice but to break. Where degradation is driven by large commercial interests, such as ranching or logging companies, the priority is enforcing regulation and property rights rather than changing the behaviour of the poor.
Case study: Costa Rica’s payments for ecosystem services
Costa Rica, a middle-income country in Central America, is one of the few countries that has reversed large-scale deforestation while its economy grew. Its experience shows how the market failure behind deforestation can be corrected by paying landowners for the environmental benefits that forests provide.
What happened
From the 1940s to the 1980s, Costa Rica lost forest quickly as land was cleared for cattle ranching and plantations such as bananas. National estimates suggest that forest cover fell from about two-thirds of the country in 1940 to less than a fifth in the early 1980s, although these figures use different methods from today’s data and are not directly comparable. Pasture expanded rapidly, encouraged by loans for cattle ranching and by demand for beef exports.
Forestry Law 7575 of 1996 changed the incentives. It recognised the environmental services forests provide (carbon storage, watershed protection, biodiversity and scenic beauty for tourism) and created a national forestry financing fund, FONAFIFO. From 1997 the fund ran the world’s first national programme of payments for ecosystem services (PES, known locally as PSA), paying landowners to protect existing forest, plant trees, manage forests sustainably or combine trees with crops.
The programme was funded in part by a tax on fossil fuels set by the 1996 law, later supplemented by a charge on water users (from 2006), a World Bank loan and a grant from the Global Environment Facility. Payments were made at a flat rate per hectare; by the end of 2005 land under PES contracts covered about 10% of the country, almost all of it under forest protection contracts.
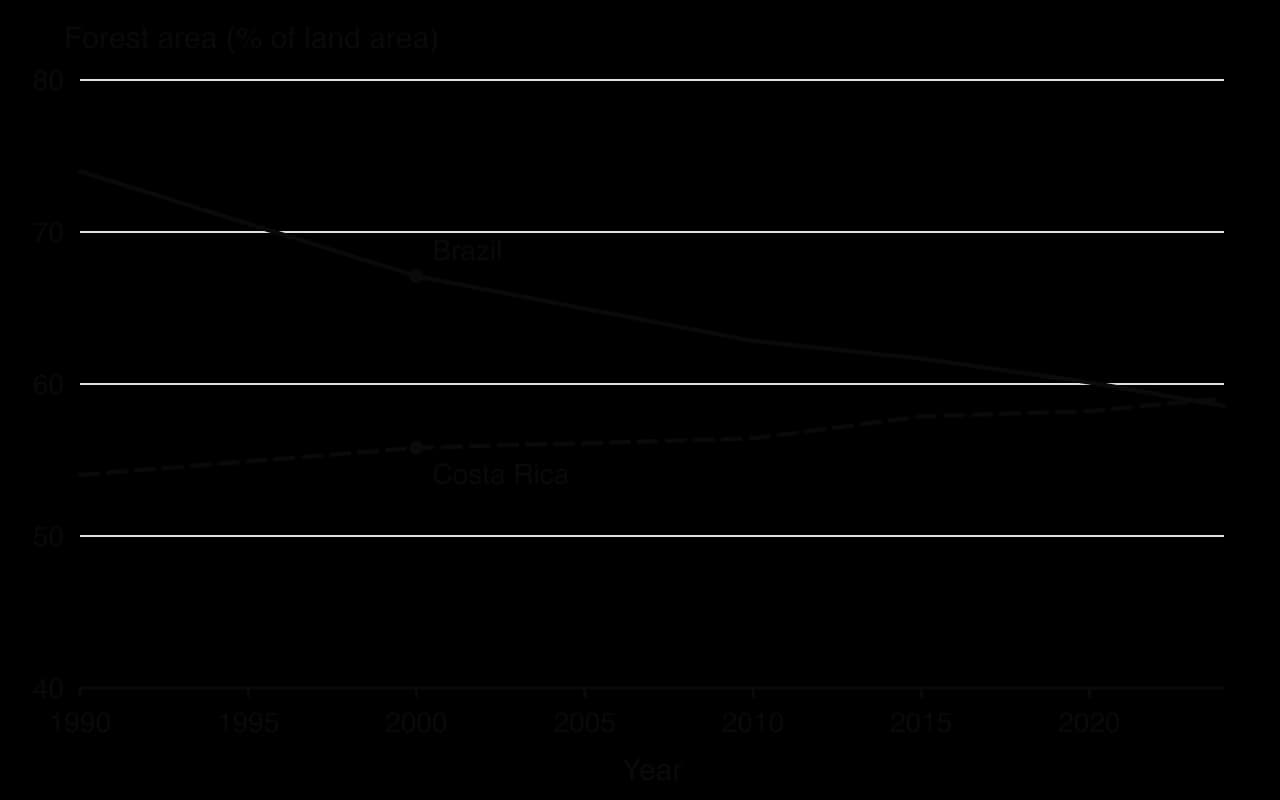
Costa Rica’s forest area rose from 54.0% to 59.1% of land between 1990 and 2024, while Brazil’s fell from 74.0% to 58.5%. Source: FAO, via World Bank, World Development Indicators (2026).
The chart compares Costa Rica with Brazil, where forest has been cleared steadily for farmland. Costa Rica’s forest area, measured on the FAO’s consistent definition, rose from 54.0% of land in 1990 to 59.1% in 2024. Over the same period Costa Rica generated almost all of its electricity from renewable sources (99.4% in 2021, mainly hydroelectric, geothermal and wind power), and its Human Development Index reached 0.833 in 2023, in the "very high" group.
Which theory explains it
Deforestation was a market failure. Forest provides external benefits (carbon storage, clean water downstream, biodiversity) that the landowner does not receive, while clearing it for cattle gives the landowner a private income. The marginal private benefit of clearing was greater than the marginal social benefit, so too much forest was cleared. PES works like a subsidy for a positive externality: it pays the landowner part of the external benefit, raising the private return from keeping the forest. Financing it with a fuel tax follows the polluter pays principle, since fuel users cause carbon emissions that forests absorb.
The case also illustrates the three dimensions of sustainable development. Economically, forest supports a large tourism industry and protects the water supply for hydroelectric power. Socially, payments provide income to rural landowners. Environmentally, forest cover and the carbon it stores have increased.
Limits and evaluation
Studies of the programme suggest that its direct effect was smaller than the rise in forest cover implies. Deforestation was already slowing in the 1990s because cattle ranching became less profitable and the 1996 law banned the clearing of existing forest, so many payments went to landowners who would have kept their forest anyway. Economists call this a lack of additionality: the payment does not change what would have happened.
The flat-rate payment also caused problems. Because it was the same everywhere, it was not enough to persuade landowners in areas where clearing paid well, so some ecologically valuable forest stayed outside the programme while cheaper, less threatened land was enrolled. Smaller and poorer farmers, often without formal land titles, found it harder to join, which limited the programme’s effect on rural poverty.
Stakeholder
Effect of PES
Gain or loss
Landowners who enrol forest
Receive a regular payment for keeping trees standing
Gain, especially those who would have kept the forest anyway
Fuel users
Pay part of the cost through the fuel tax
Lose a little, but pay for the carbon their fuel emits
Water users and hydroelectric producers
Benefit from protected watersheds and steadier river flows
Gain
Tourism firms and their workers
Benefit from forest and wildlife that attract visitors
Gain
Small farmers without land titles
Often unable to enrol
Gain little
Future generations and the world
Inherit more forest and the carbon it stores
Gain
The case shows that sustainable development is possible in a middle-income country, but that it rests on several conditions together: a change in the economy away from ranching, strong laws, a stable government and long-term funding. PES alone did not reverse deforestation. Its wider lesson is that paying for environmental benefits can align private incentives with sustainability, provided the payments are targeted at land that would otherwise be cleared.
Sources: World Bank, World Development Indicators: forest area (FAO) and renewable electricity output (IEA) (2026); UNDP, Human Development Report 2025 (2025); S. Sader and A. Joyce, _Biotropica (1988), forest cover 1940–1983; S. Pagiola, “Payments for environmental services in Costa Rica”, Ecological Economics (2008); B. Matulis, Geoforum (2013); all via Wikipedia, “Deforestation in Costa Rica” and “Payment for ecosystem services” (accessed 2026)._
Exam practice
Sustainable development is usually examined in Paper 1 part (a) or (b) and in Paper 2 definitions and part (g), often alongside barriers to development or development strategies. HL students may also meet it in Paper 3, where data on emissions, forest cover or clean cooking support a policy recommendation.
Paper 2-style short questions (invented for practice):
(a) Define the term sustainable development. [2]
(b) Using the data on forest area, calculate the percentage change in Brazil’s forest share between 1990 and 2024. [2]
(c) Using a PPC diagram, explain how overusing natural resources could reduce a country’s future production possibilities. [4]
(d) Explain two reasons why progress towards the SDGs has been slower than planned. [4]
(e) Using information from the text/data and your knowledge of economics, evaluate payments for ecosystem services as a way of promoting sustainable development. [15]
Part (b) questions on sustainable development usually widen the theory from part (a) into an evaluation of a policy or framework, and they need real examples with figures.
Summary
Sustainable development, as the Brundtland Report defined it in 1987, meets the needs of the present without compromising the ability of future generations to meet their own needs.
It has economic, social and environmental dimensions, and requires equity both between and within generations.
Growth that runs down natural capital raises output now but shifts the PPC inward in the future; GDP does not record this loss.
The 17 SDGs (2015–2030) replaced the eight MDGs; they are universal, broader and put sustainability at the centre.
In 2025 only 35% of assessable SDG targets were on track or making moderate progress, and 18% had regressed.
Goals can support each other (clean energy and health) or conflict (food output and forests; growth and climate).
HL: poverty can drive environmental degradation, and degradation hurts the poor most, forming a poverty–environment trap.
Self-check
To do:
I can define sustainable development and explain its three dimensions.
To do:
I can distinguish between economic growth, economic development and sustainable development.
To do:
I can draw a PPC to show how using up natural capital reduces future production possibilities.
To do:
I can describe the SDGs and explain how they differ from the MDGs.
To do:
I can explain one synergy and one trade-off between SDGs with a real example.
To do:
I can evaluate the SDGs as a framework for sustainable development.
To do:
I can explain how poverty leads to environmental degradation (HL).
To do:
I can explain why people in poverty suffer most from environmental degradation (HL).
Level
Marks
Descriptor
0
0
The work does not reach a standard described by the descriptors below.
1
1–2
Little understanding of the specific demands of the question. Relevant economic theory is stated but not relevant. Economic terms are stated but not relevant.
2
3–4
Some understanding of the specific demands of the question. Relevant economic theory is described. Some relevant economic terms are included.
3
5–6
The specific demands of the question are understood but only partially addressed. Relevant economic theory is partly explained. Some relevant terms are used appropriately. Where appropriate, relevant diagram(s) are included.
4
7–8
The specific demands of the question are understood and addressed. Relevant economic theory is explained. Relevant terms are used mostly appropriately. Where appropriate, relevant diagram(s) are included and explained.
5
9–10
The specific demands of the question are understood and addressed. Relevant economic theory is fully explained. Relevant terms are used appropriately throughout. Where appropriate, relevant diagram(s) are included and fully explained.
(b)
Using real-world examples, evaluate the view that carbon taxes are the most effective way to reduce greenhouse gas emissions.
Explanation: a carbon tax per tonne of CO₂ internalizes the external cost, shifting MPC up towards MSC, raising price and reducing output of carbon-intensive goods towards the social optimum; it gives firms a continuing incentive to switch to cleaner technology; it raises revenue that can fund green investment or compensate low-income households.
Diagram(s): negative production externality diagram showing MPC shifting up by the tax towards MSC, output falling from Qm to Qopt and the welfare loss eliminated.
Synthesis/evaluation: difficulty of measuring the external cost and setting the right rate; demand for energy is often price inelastic, so emissions may fall only slightly in the short run; regressive effects on low-income households; political resistance; carbon leakage to countries without taxes; tradable permits give certainty about the quantity of emissions whereas taxes give certainty about price; regulation (emissions standards, bans) may act faster; subsidies for renewable energy and international agreements are complementary; consideration of 'most effective' and a reasoned judgement.
Examples: Sweden's carbon tax (introduced 1991, among the highest rates in the world) alongside falling emissions and continued growth; British Columbia's revenue-neutral carbon tax (2008); France's planned fuel tax increases suspended after the 'gilets jaunes' protests in 2018; the EU ETS as a tradable-permit alternative.
For 'most effective' questions, a maximum of [12] should be awarded where no alternative policies are considered.
N.B. Terminology, theory, diagrams and examples given in part (a) and referred to in part (b) should be rewarded.
Examiners should be aware that candidates may take a different approach which, if appropriate, should be rewarded.
Markbands (best fit)
Level
Marks
Descriptor
0
0
The work does not reach a standard described by the descriptors below.
1
1–3
Little understanding of the specific demands of the question. Theory is stated but not relevant. Terms are not relevant. No synthesis or evaluation. Real-world examples are identified but not relevant.
2
4–6
Some understanding of the demands. Relevant theory is described. Some relevant terms are included. Synthesis or evaluation is superficial. A relevant real-world example is identified.
3
7–9
The demands are understood but only partially addressed. Theory is partly explained. Some terms are used appropriately. Relevant diagram(s) are included where appropriate. Synthesis or evaluation is appropriate but lacks balance. Example(s) are identified and partly developed in context.
4
10–12
The demands are understood and addressed. Theory is explained. Terms are used mostly appropriately. Diagram(s) are included and explained. Synthesis or evaluation is appropriate and mostly balanced. Example(s) are identified and developed in the context of the question.
5
13–15
The demands are understood and addressed. Theory is fully explained. Terms are used appropriately throughout. Diagram(s) are included and fully explained. Synthesis or evaluation is effective and balanced. Example(s) are identified and fully developed to support the argument.
Question 2 · ECON-0000725 marks
Governments often aim to increase the output of goods and services in their economies.
(a)
Using a production possibilities curve (PPC), distinguish between actual growth and growth in production possibilities.
[10]10 marks
(b)
Using real-world examples, discuss the view that economic growth always conflicts with environmental sustainability.