2.3 Competitive market equilibrium
Explain how demand and supply set the equilibrium price, how the price mechanism signals, motivates and rations, and why social surplus is maximised where MB = MC; HL students also calculate surplus.
- IB Economics
- Part of 2 Microeconomics
- SL and HL
Key terms introduced here
Each is in the Economics glossary, with every other term in the subject.
- Allocative efficiency
A situation in which resources produce the mix and quantity of goods society values most; in a market it occurs where marginal benefit equals marginal cost and social surplus is maximised.
- Consumer surplus
The difference between the highest price consumers are willing and able to pay for a good and the price they actually pay; the area below the demand curve and above the price.
- Disequilibrium
A situation in a market where quantity demanded and quantity supplied are not equal at the current price, so there is excess demand or excess supply and pressure for the price to change.
- Excess demand
The situation where, at the current price, quantity demanded is greater than quantity supplied; it arises when the price is below the equilibrium price.
- Excess supply
The situation where, at the current price, quantity supplied is greater than quantity demanded; it arises when the price is above the equilibrium price.
- Incentive function
The role of prices in motivating consumers and producers to change their behaviour, for example a higher price encouraging firms to produce more and consumers to buy less.
- Marginal benefit
The additional benefit consumers receive from consuming one more unit of a good, measured by the maximum price they are willing to pay for it; shown by the demand curve.
- Market equilibrium
The situation in a market where quantity demanded equals quantity supplied, so there is no tendency for the price or the quantity traded to change; it occurs at the market-clearing price.
- Price mechanism
The system in which the interaction of demand and supply sets prices, and changes in prices guide the decisions of consumers and producers about what, how much and for whom to produce.
- Producer surplus
The difference between the price producers receive for a good and the lowest price at which they are willing to supply it; the area above the supply curve and below the price.
- Rationing function
The role of prices in distributing scarce goods: a rising price reduces quantity demanded until it equals the quantity available, so the good goes to those willing and able to pay.
- Resource allocation
The way scarce factors of production are assigned to producing different goods and services; in a market economy it is decided by the price mechanism through signalling and incentives.
- Signalling function
The role of prices in passing information to consumers and producers about changes in market conditions, such as a rise in demand or a fall in supply.
- Social surplus
The sum of consumer surplus and producer surplus in a market, measuring the total benefit buyers and sellers gain from trading a good; also called community surplus.
Notes on 2.3 Competitive market equilibrium
Learning objectives
Draw a market equilibrium diagram and explain why the market settles at the equilibrium price and quantity.
Explain how excess demand and excess supply push the price towards equilibrium.
Draw diagrams to show and explain how changes in demand and/or supply lead to a new equilibrium.
Explain the signalling, incentive and rationing functions of the price mechanism and how they allocate resources.
Draw and explain consumer surplus, producer surplus and social surplus on a demand and supply diagram.
Explain why the competitive equilibrium is allocatively efficient, where marginal benefit equals marginal cost.
Calculate consumer surplus, producer surplus and social surplus from values on a diagram (HL).
Introduction
A market brings together buyers and sellers of a good or service. When they trade freely, the price tends to settle at the level where the amount consumers want to buy is exactly equal to the amount producers want to sell. This price is the market equilibrium, and the way prices move to reach it is how most goods in a market economy are produced and shared out.
Competitive market equilibrium connects the separate models of demand and supply into one. It explains why prices rise and fall in real markets, such as the sharp rise and later fall in US egg prices after an outbreak of bird flu between 2022 and 2026, and it gives economists a way to measure the gains from trade and to judge whether a market produces the "right" quantity of a good.
Several key concepts are at work in competitive markets:
Key concept | How it appears in competitive market equilibrium |
|---|---|
Scarcity | Prices ration goods that are scarce: when there is not enough for everyone who wants a good at the current price, the price rises until quantity demanded matches the quantity available. |
Choice | Consumers and producers respond to prices, choosing how much to buy and sell, and those choices together decide what is produced. |
Efficiency | At the competitive equilibrium, social surplus is as large as it can be: resources are allocatively efficient. |
Change | Every change in a determinant of demand or supply moves the market to a new equilibrium; markets are always adjusting. |
Equity | An efficient outcome need not be fair: the price mechanism rations by willingness and ability to pay. |
Market equilibrium
Bringing demand and supply together
A demand curve shows the quantity demanded at each price, ceteris paribus; it slopes downwards because consumers buy more at lower prices. A supply curve shows the quantity supplied at each price; it slopes upwards because producers are willing to sell more at higher prices. Placing the two curves on the same axes shows where buyers’ plans and sellers’ plans match.
At most prices the plans of buyers and sellers are not consistent with each other. At a high price, firms want to sell a lot but few consumers want to buy. At a low price, many consumers want to buy but firms want to sell little. There is only one price at which the two quantities are the same.
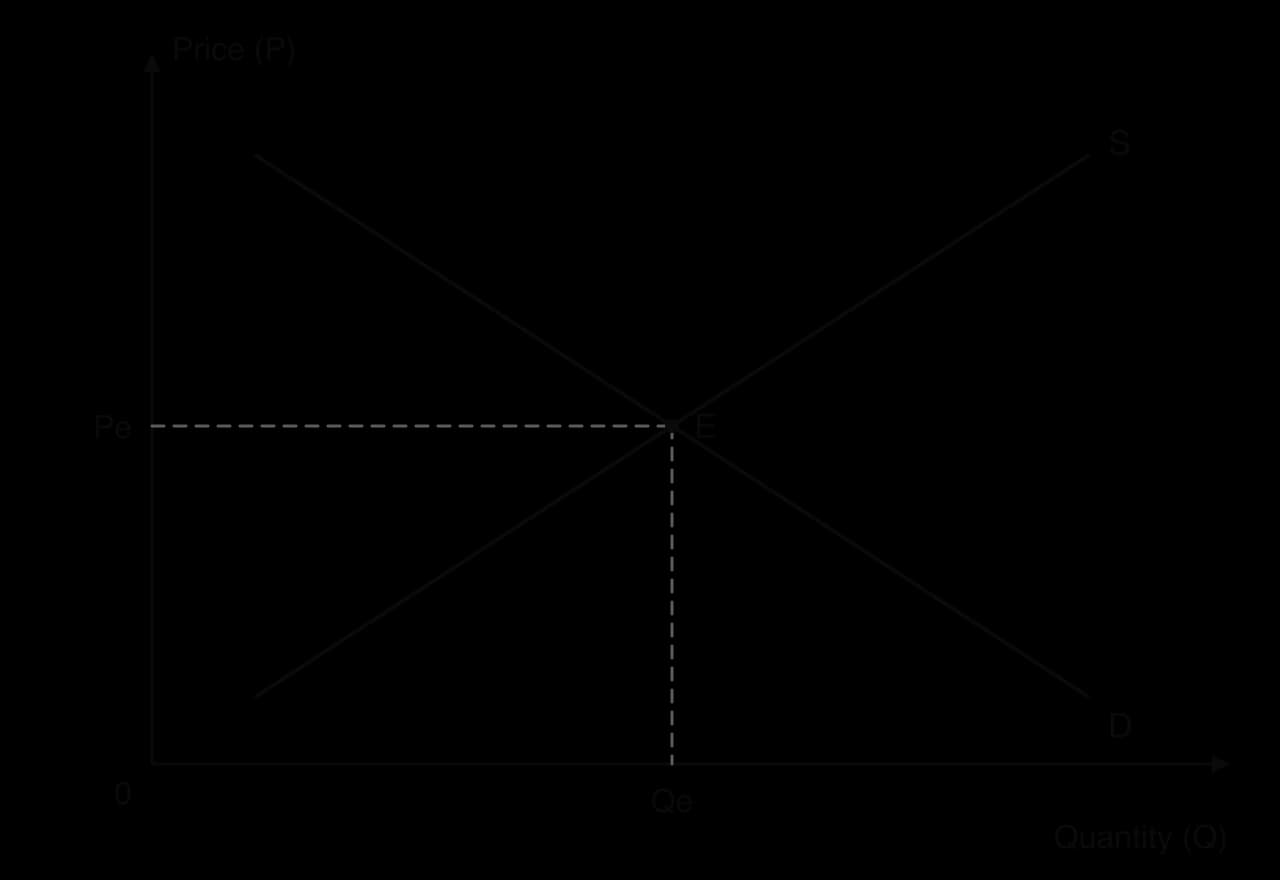
The diagram shows the equilibrium E where the demand curve D crosses the supply curve S. Reading across to the price axis gives the equilibrium price Pe; reading down to the quantity axis gives the equilibrium quantity Qe. At this price every consumer who is willing and able to pay Pe can buy the good, and every producer willing to sell at Pe finds a buyer. Nobody has a reason to change the price, so the market "clears".
Equilibrium does not mean that nothing happens in the market. Goods are bought and sold continuously at Pe. It means only that, as long as the conditions of demand and supply stay the same, the price and quantity have no tendency to move.
Finding the equilibrium from a schedule
Demand and supply can also be shown as schedules: tables listing the quantity demanded and the quantity supplied at each price. The equilibrium is the price in the table at which the two quantities are equal. At any other price there is a gap between them, and its size shows how far the market is from equilibrium.
The table gives hypothetical weekly demand and supply schedules for bubble tea in a small town. Quantity demanded falls and quantity supplied rises as the price rises, as the laws of demand and supply predict.
Price ($ per cup) | Quantity demanded (cups) | Quantity supplied (cups) |
|---|---|---|
2 | 900 | 300 |
3 | 750 | 450 |
4 | 600 | 600 |
5 | 450 | 750 |
6 | 300 | 900 |
Disequilibrium: excess demand and excess supply
A market is in disequilibrium when the price is anywhere other than the equilibrium price, so quantity demanded and quantity supplied are not equal. In a free market, disequilibrium is temporary: the gap between the two quantities itself creates pressure on the price to change, and the price keeps moving until the gap disappears.
When the price is above Pe, firms produce more than consumers want to buy. Unsold stock builds up in shops and warehouses. To sell it, firms cut their prices. As the price falls, two things happen at once: quantity demanded extends along the demand curve, because the good is now cheaper, and quantity supplied contracts along the supply curve, because producing the good is now less profitable. The excess supply shrinks, and the price keeps falling until it reaches Pe.
When the price is below Pe, consumers want to buy more than firms are offering. Shelves empty quickly and queues form. Some consumers are willing to pay more than the current price rather than go without, and sellers notice they can raise prices and still sell everything. As the price rises, quantity demanded contracts and quantity supplied extends, until the shortage is gone at Pe.
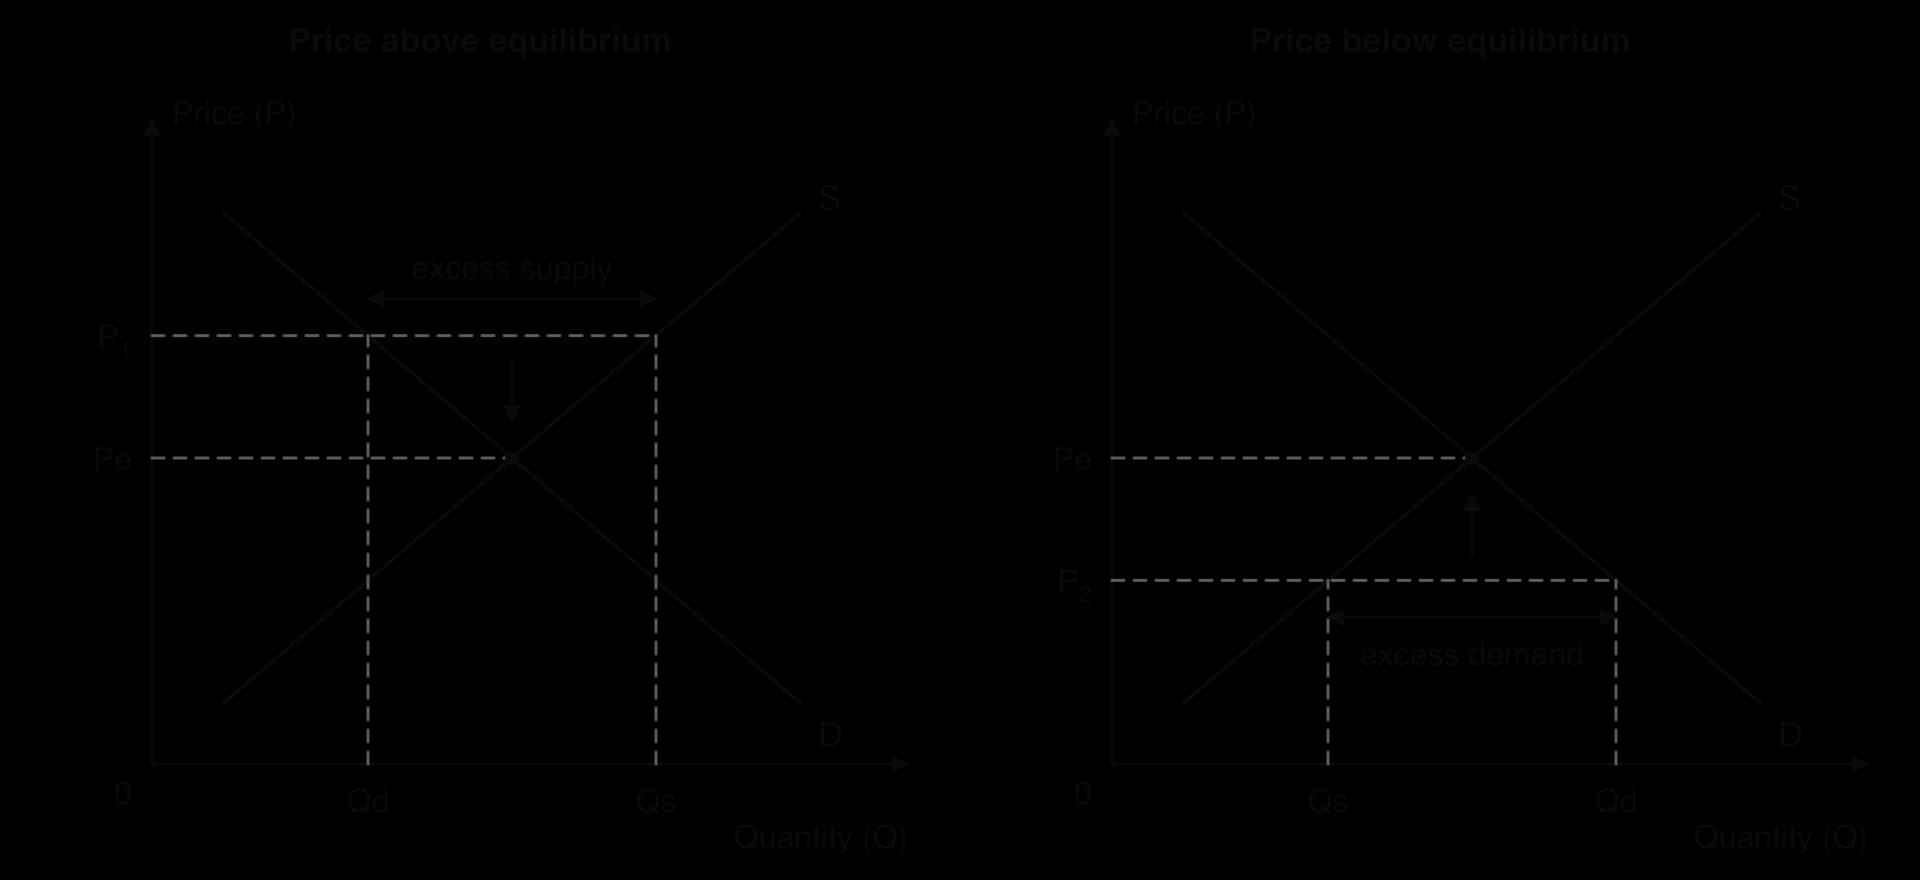
In the left-hand panel, at P₁ quantity demanded is Qd and quantity supplied is the larger Qs; the horizontal gap between them is the excess supply. In the right-hand panel, at P₂ the order is reversed and the gap is excess demand. The arrows show the direction in which the price moves. These two forces explain why the equilibrium is stable: any departure from it sets off a change in price that brings the market back.
Real markets do not always reach equilibrium quickly. Prices printed in catalogues and menus, long-term contracts and a firm’s wish not to annoy loyal customers can all slow the adjustment. When a seller deliberately keeps the price below the market-clearing level, the excess demand can last for months. Sony launched the PlayStation 5 in November 2020 at a fixed list price; consoles sold out for many months and were resold online at prices well above the list price, which showed roughly where the market-clearing price lay.
Changes in market equilibrium
An equilibrium lasts only as long as the conditions behind demand and supply stay the same. When a non-price determinant changes, one of the curves shifts. At the old price there is then a gap between quantity demanded and quantity supplied, and the price moves until a new equilibrium is reached. Analysing a change in a market always follows the same three steps: decide which curve shifts and in which direction, identify the disequilibrium at the old price, and explain how the price moves to the new equilibrium.
An increase or decrease in demand
Suppose incomes rise and the good is a normal good, or a successful advertising campaign makes it more popular. Demand increases, so the demand curve shifts to the right from D₁ to D₂. At the original price P₁, consumers now want to buy Q₃, but firms still supply only Q₁, so there is excess demand of Q₃ − Q₁.
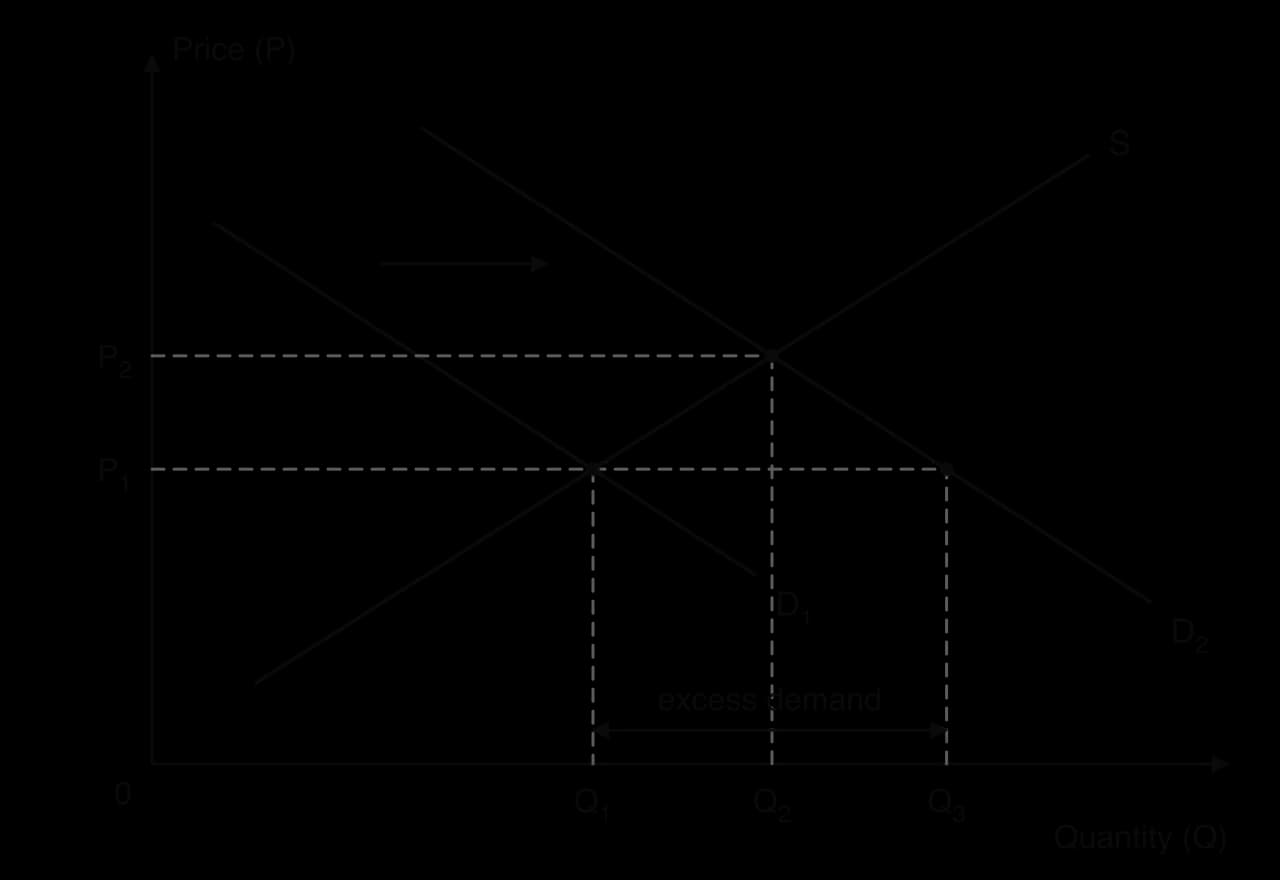
The excess demand pushes the price up. As it rises, quantity supplied extends along the unchanged supply curve, because higher prices make it worthwhile for firms to produce more. At the same time, the higher price causes quantity demanded to contract along the new demand curve D₂. The price stops rising at P₂, where the market clears at Q₂. Compared with the original equilibrium, both the price and the quantity traded are higher.
A decrease in demand works the other way round. If, for example, the price of a substitute falls, the demand curve shifts left. At the original price there is now excess supply, the price falls, quantity supplied contracts and the market settles at a lower price and a lower quantity.
An increase or decrease in supply
Supply changes when a non-price determinant of supply changes: the costs of production, technology, the weather in agriculture, the number of firms, indirect taxes and subsidies. A fall in supply shifts the supply curve to the left; at every price, producers are now willing to sell less.
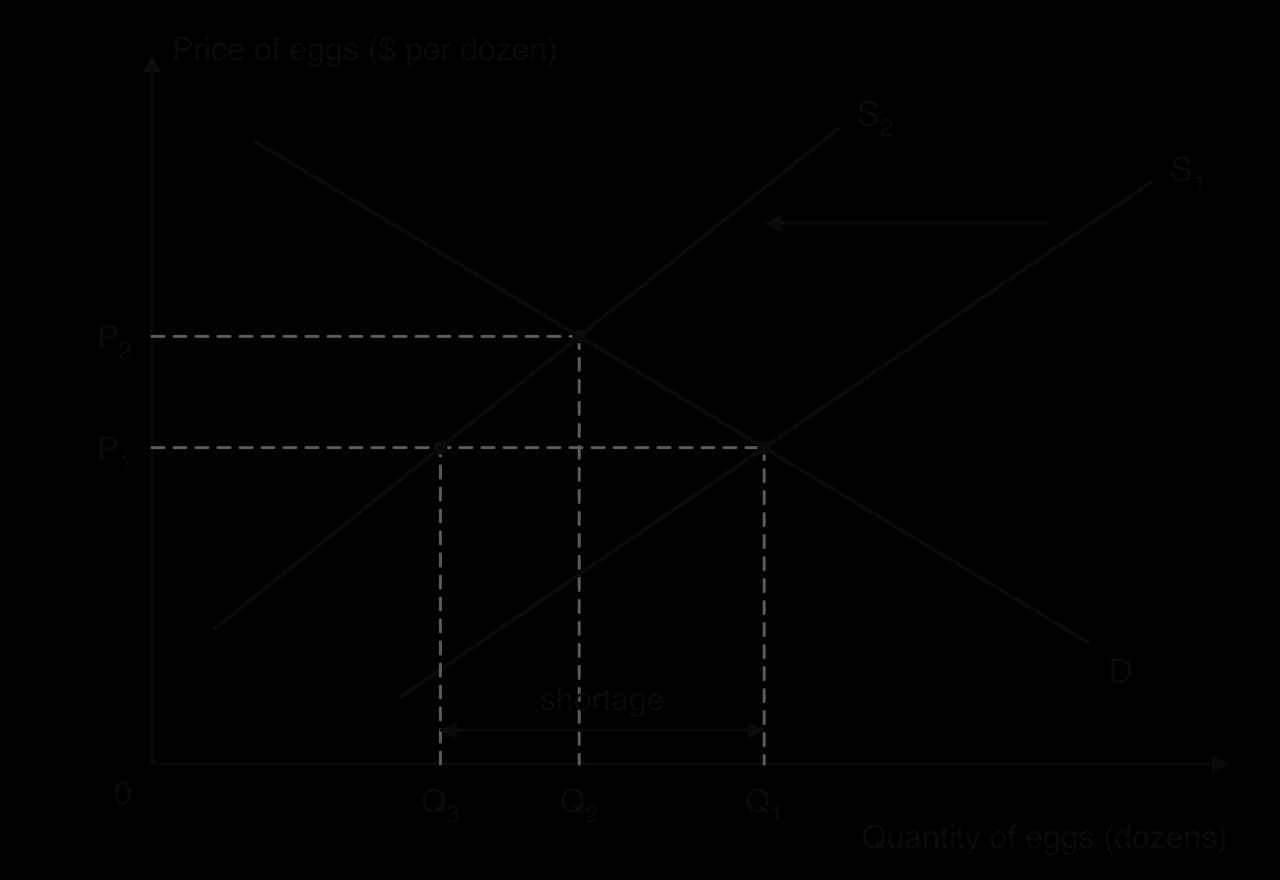
The diagram shows the egg market after many laying hens are lost to disease. At the original price P₁, producers can now supply only Q₃, while consumers still want Q₁, so there is a shortage of Q₁ − Q₃. The price rises; quantity demanded contracts along the demand curve as some consumers buy fewer eggs or switch to other foods, and quantity supplied extends along the new supply curve S₂ as remaining producers find it worthwhile to supply more. The new equilibrium is at the higher price P₂ and the lower quantity Q₂.
An increase in supply, for example from a new technology that lowers costs, shifts the supply curve to the right. At the old price there is excess supply, the price falls, and the market settles at a lower price and a higher quantity. Solar panels are a well-known case: falling production costs have shifted supply to the right year after year, lowering prices and raising the quantity sold.
Change | Shift | At the old price | New equilibrium price | New equilibrium quantity |
|---|---|---|---|---|
Demand increases | D shifts right | Excess demand | Rises | Rises |
Demand decreases | D shifts left | Excess supply | Falls | Falls |
Supply increases | S shifts right | Excess supply | Falls | Rises |
Supply decreases | S shifts left | Excess demand | Rises | Falls |
Changes in both demand and supply
Often demand and supply change at the same time. When both shift, the effect on one of the two variables is certain, while the effect on the other depends on which shift is larger. If demand and supply both increase, both shifts push quantity up, so the equilibrium quantity certainly rises. The demand increase pushes the price up while the supply increase pushes it down, so the change in price is uncertain.
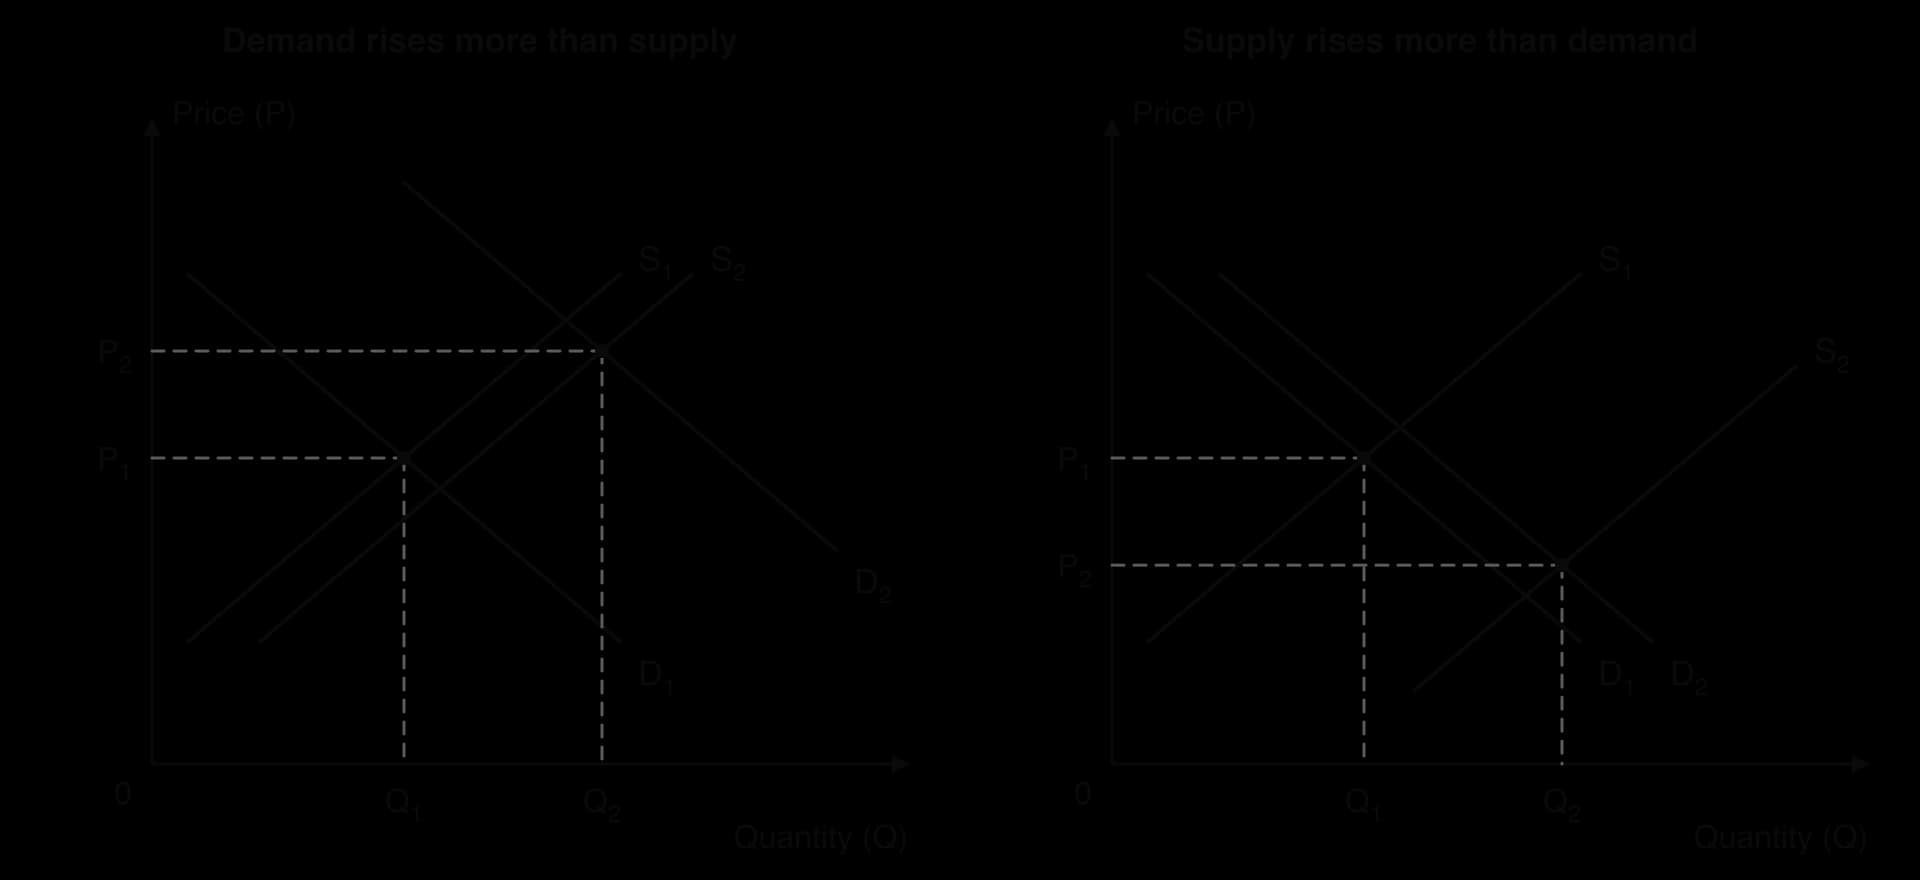
The diagram shows the two possible outcomes. In the left-hand panel, the demand curve shifts further than the supply curve, so the price rises from P₁ to P₂. In the right-hand panel, the supply shift is larger, so the price falls. If the two shifts were exactly equal, the price would not change at all. The same logic applies to the other combinations.
Combination | Effect on equilibrium price | Effect on equilibrium quantity |
|---|---|---|
Demand rises, supply rises | Uncertain (depends on the size of the shifts) | Rises |
Demand falls, supply falls | Uncertain | Falls |
Demand rises, supply falls | Rises | Uncertain |
Demand falls, supply rises | Falls | Uncertain |
The price mechanism
In a market economy, nobody instructs producers how many eggs, phones or haircuts to supply, or decides which consumers receive them. These decisions are made by millions of independent buyers and sellers reacting to prices. The price mechanism is the name for this system, in which changes in prices coordinate the decisions of consumers and producers.
The price mechanism answers the basic economic questions that every society faces because of scarcity: what to produce, how to produce it and for whom. It does so through resource allocation: factors of production move towards goods whose prices and profits are rising and away from goods whose prices and profits are falling. Economists describe three connected functions that make this work.
The signalling function
Prices carry information, and passing it on is their signalling function. A rising price signals to producers that consumers want more of a good than is currently available, and signals to consumers that the good has become scarcer. A falling price sends the opposite signals. The information is condensed into a single number that everyone can see, without anyone needing to know the reason for the change.
Ride-hailing apps such as Uber show signalling in real time. When many people request rides at the same moment, for example after a concert ends, the app raises fares in that area. The higher fare signals to drivers that rides are in demand there and signals to passengers that a ride is currently scarce, so some choose to wait or walk.
The incentive function
A signal alone does not change behaviour; what makes people act on it is self-interest. A higher price raises the revenue and profit that producers can earn from a good, which gives them an incentive to supply more of it, by using existing capacity more intensively, by investing in new capacity or by entering the market. For consumers, a higher price is an incentive to buy less and look for substitutes. This is the reason quantities move along the curves when prices change.
Over time, the incentive function moves resources between industries. Higher egg prices made it profitable for farmers to rebuild their flocks after outbreaks of bird flu; falling prices in a declining industry push firms to move their capital and workers into more profitable uses.
The rationing function
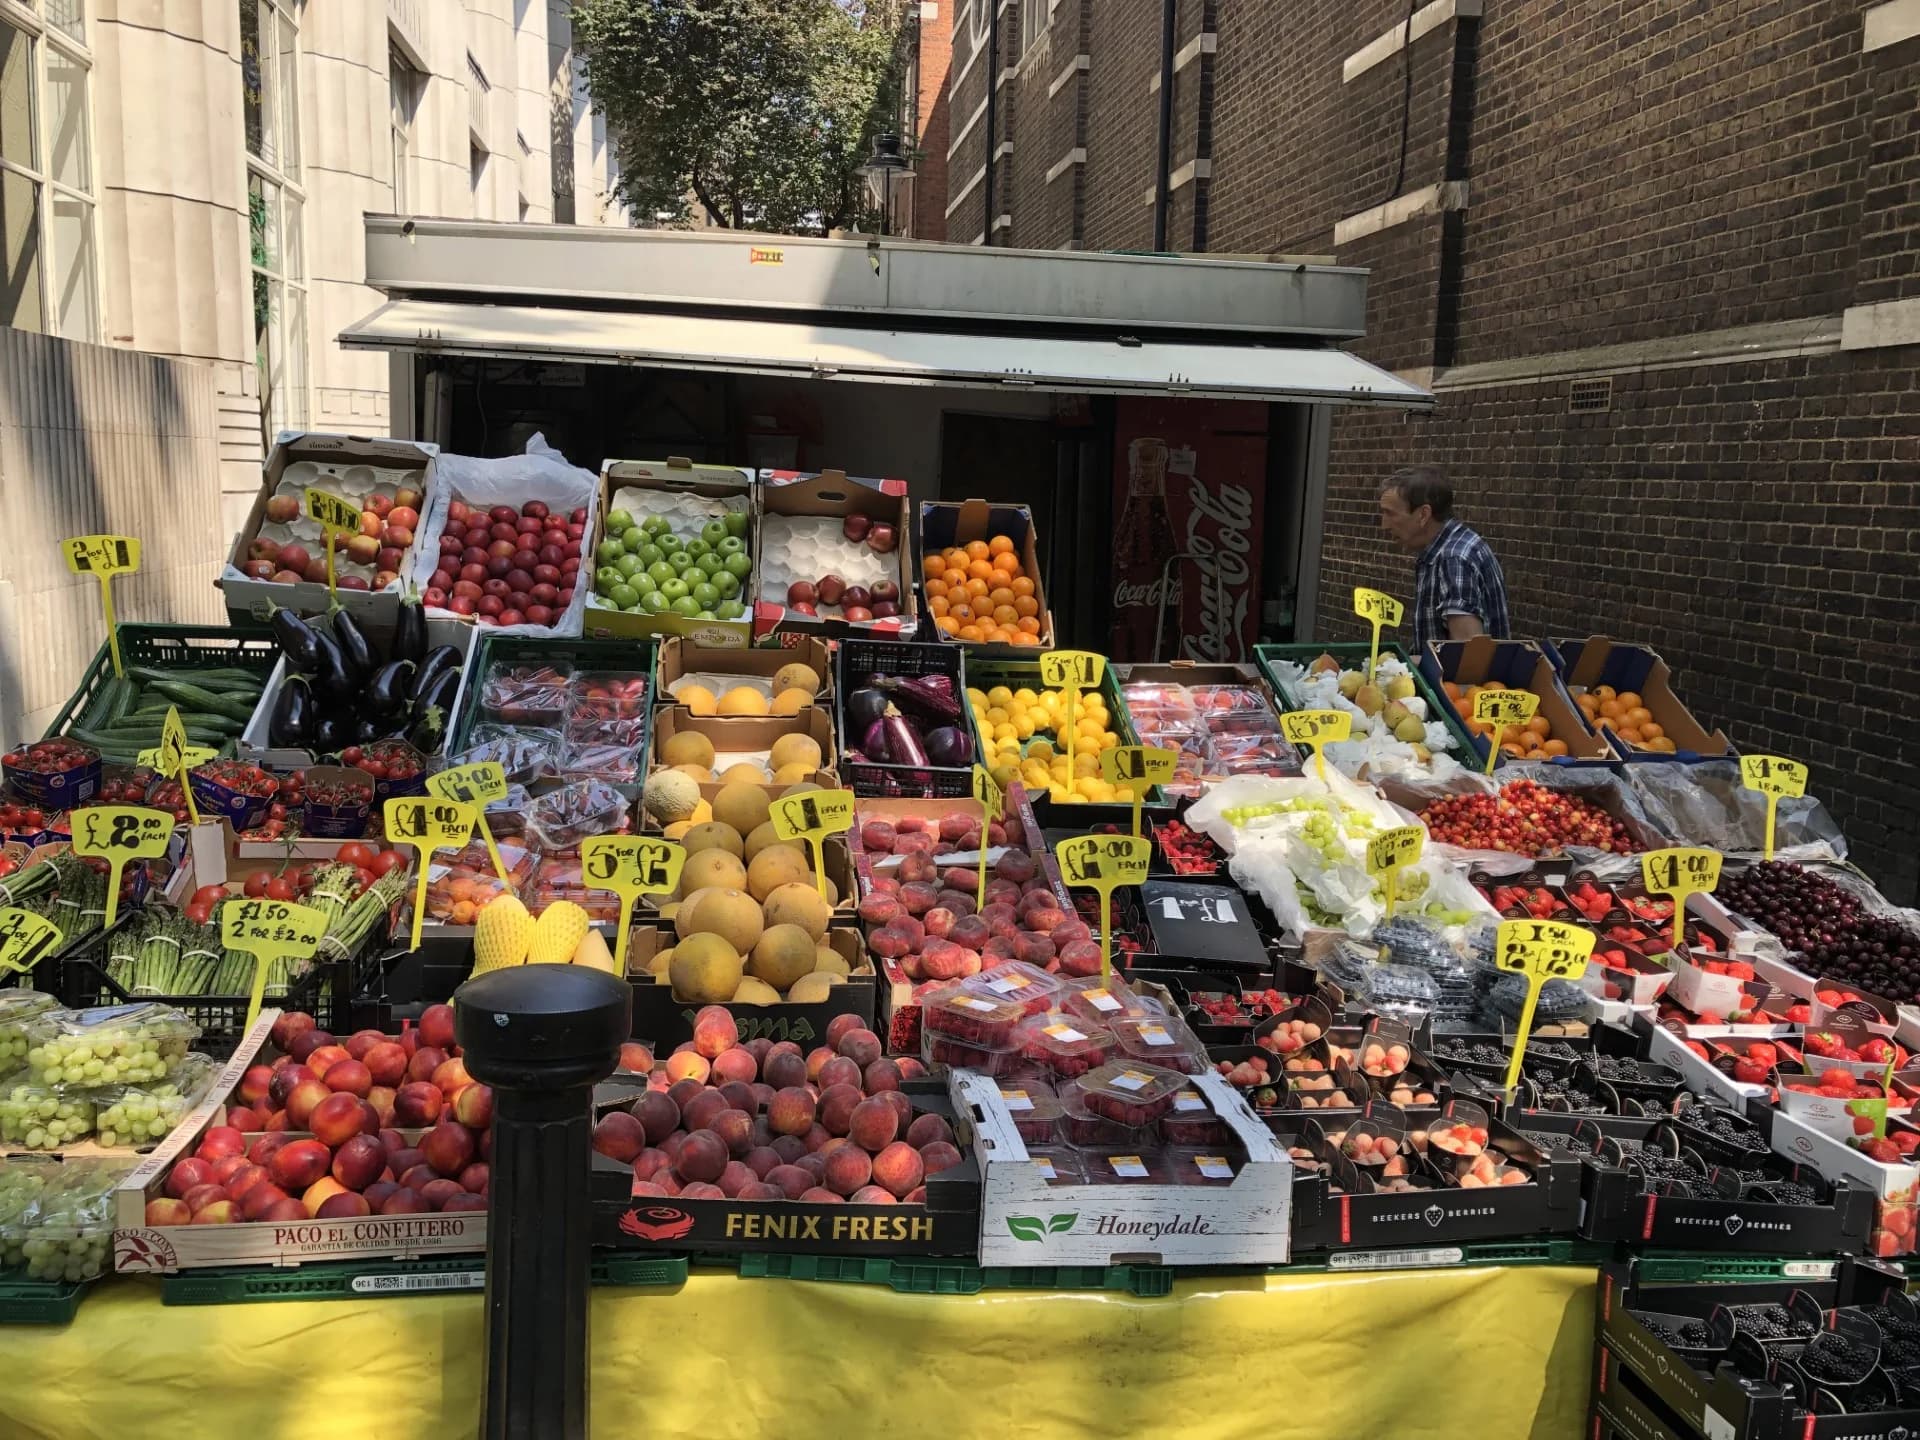
Because resources are scarce, there is never enough of every good for everyone who would like it. Something must decide who gets the goods that are available. In a market, the price does this: it rises until quantity demanded falls to the quantity available, and the good goes to those who are willing and able to pay the market price. Consumers who value the good less than the price, or cannot afford it, go without.
The rationing function matters most when supply falls sharply. During the COVID-19 pandemic, demand for bicycles rose as people avoided public transport, while factory closures limited supply; prices rose and waiting lists grew, and the higher prices decided which buyers got the bikes that were available. When a price is not allowed to ration a good, some other method has to: first come, first served, queues, lotteries, waiting lists or rules set by the seller.
Ticket sales for popular concerts show the alternative. In November 2022 about 3.5 million people registered for Ticketmaster’s presale of tickets for Taylor Swift’s Eras Tour in the US, far more than there were tickets. The face-value price was well below what many fans were willing to pay, so tickets were rationed by a registration system, a queue and luck. The site crashed under the demand, and the general public sale was cancelled because not enough tickets were left. Tickets that reached resale websites were offered at much higher prices, which shows the market-clearing price was well above face value.
Sources: Variety (15 and 17 November 2022); Wall Street Journal (12 December 2022).
Function | What a price rise does | Example |
|---|---|---|
Signalling | Tells producers and consumers that the good has become scarcer or more wanted. | Surge pricing on ride-hailing apps tells drivers where rides are needed. |
Incentive | Makes producing the good more profitable, so firms supply more; encourages consumers to buy less. | Higher egg prices made it worthwhile to rebuild flocks after bird flu. |
Rationing | Reduces quantity demanded to the quantity available, so the good goes to those willing and able to pay. | Bicycles in 2020: higher prices allocated the limited supply. |
 YouTube
How well does the price mechanism allocate resources?
The strength of the price mechanism is that it uses information that no planner could collect: the individual preferences of every consumer and the costs of every producer. Each person acts in their own interest, yet the outcome coordinates the whole market. Adam Smith described this as the invisible hand, and in competitive markets with no spillover effects it produces an allocatively efficient outcome.
It also has clear limits. It rations by ability to pay, which raises questions of equity for essential goods such as housing, food and medicine. It ignores costs and benefits that fall on third parties, such as pollution, so prices can send the wrong signals; this is a form of market failure. It works poorly when firms have market power and can hold prices above the competitive level, and it can produce large, sudden price swings when supply is hit by shocks. These limits are the main reasons governments sometimes intervene in markets.
Consumer surplus, producer surplus and social surplus
Buyers and sellers trade because both expect to gain. Economists measure those gains by comparing what people would have been willing to pay or accept with what they actually pay or receive. The resulting measures, consumer surplus and producer surplus, are used throughout microeconomics to judge the effects of changes in markets and of government policies.
Consumer surplus
Each point on a demand curve shows the maximum price that some consumer is willing to pay for one more unit. This is the value of that unit to the consumer, its marginal benefit. Most consumers who buy a good would have been willing to pay more than the market price. The difference between what they would have paid and what they actually pay is a gain to them.
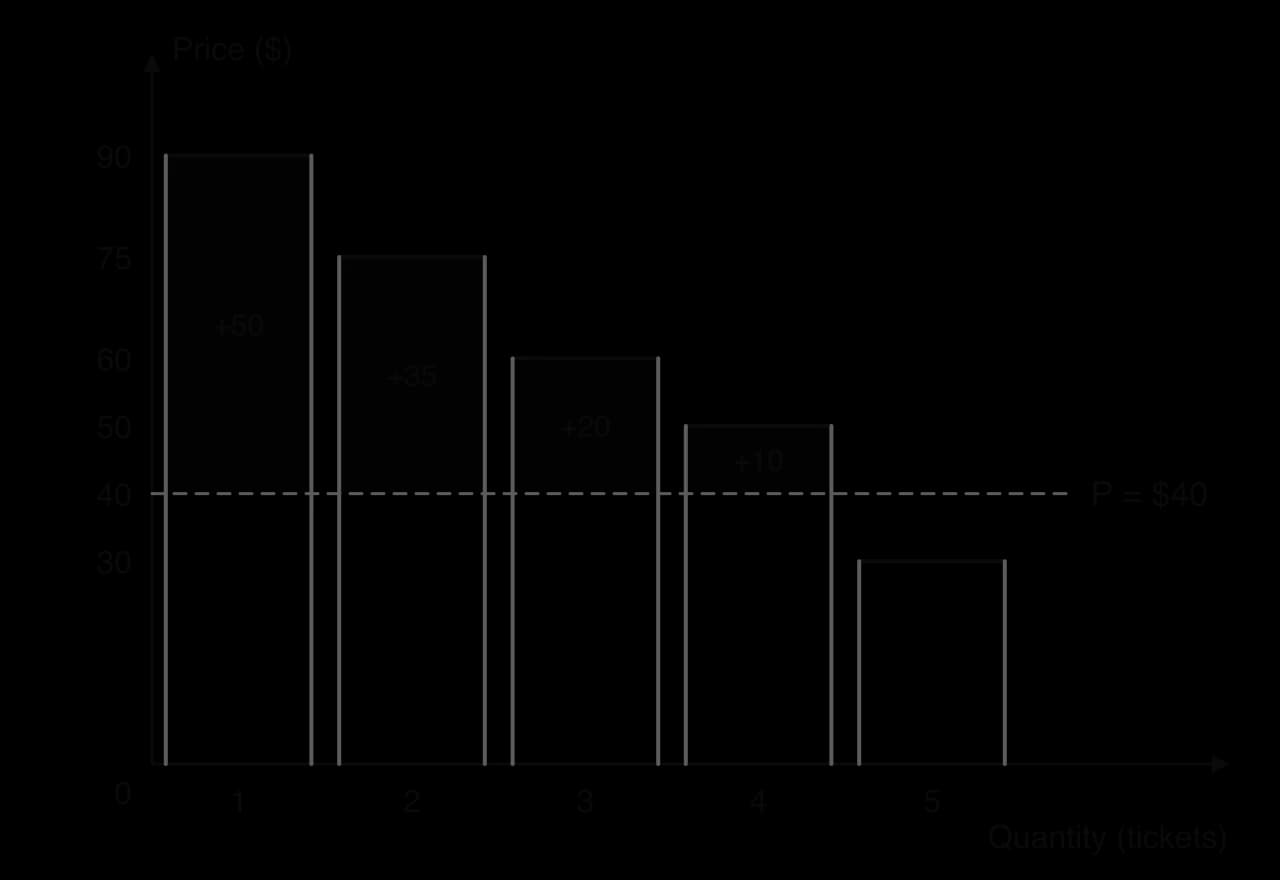
The diagram builds the idea from individual buyers. The height of each bar is one buyer’s willingness to pay. At a price of $40, only the four buyers whose willingness to pay is above $40 buy a ticket, and each gains the amount by which their bar rises above the price line. Added together, the dark areas give the consumer surplus. In a market with thousands of buyers the bars become very thin, and the stepped outline becomes the smooth demand curve.
Consumer surplus can be very large for goods that are cheap or free but highly valued. In large online experiments in 2019, the median user of Facebook needed about $48 to give up the service for one month, although its users pay nothing for it. A free service creates no consumer spending and adds little to measured output, but its users still receive consumer surplus.
Sources: Brynjolfsson, Collis and Eggers, _Proceedings of the National Academy of Sciences (2019)._
Producer surplus
Each point on a supply curve shows the lowest price at which a producer is willing to supply one more unit, which reflects the extra cost of producing it, its marginal cost. When the market price is higher than this minimum, the producer gains the difference on that unit.
Social surplus
Adding the two measures gives the total gain from trade in the market for both groups of participants.
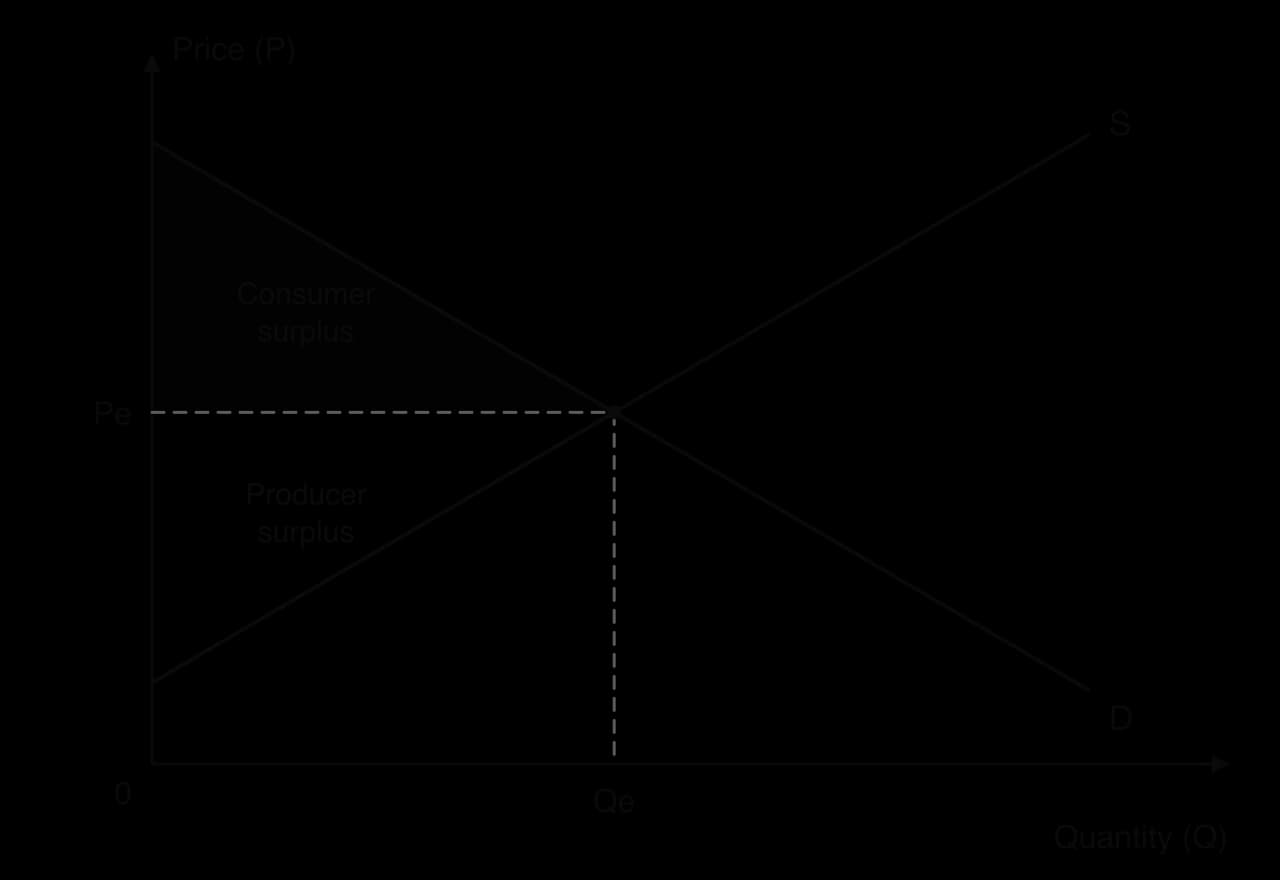
The diagram shows both areas at the competitive equilibrium. The consumer surplus triangle has its corners on the price axis where demand starts, at Pe on the price axis, and at the equilibrium point. The producer surplus triangle sits below it, between Pe and the point where supply meets the price axis. The whole triangle between the demand and supply curves, from the price axis to Qe, is social surplus.
Any change in the market price redistributes surplus between the two groups. A fall in supply that raises the price, for example, takes surplus away from consumers, who pay more and buy less. Producers who still sell gain from the higher price on each unit, but they sell fewer units, so the overall effect on producer surplus depends on the shapes of the curves. This is why consumer and producer surplus are the standard tools for judging who gains and who loses from a change in a market.
 YouTube
Allocative efficiency
Demand as marginal benefit, supply as marginal cost
To judge whether a market produces the "right" amount of a good, economists reinterpret the two curves. The height of the demand curve at any quantity is what consumers are willing to pay for one more unit, which measures the extra satisfaction, or benefit, of that unit. The demand curve is therefore a marginal benefit (MB) curve. The height of the supply curve at any quantity is the minimum price needed for firms to produce one more unit, which reflects the extra cost of producing it. In a competitive market, the supply curve is a marginal cost (MC) curve.
Reading the diagram unit by unit makes the logic clear. For the first unit, MB is high and MC is low, so producing it adds a lot to society’s welfare. As quantity increases, MB falls and MC rises, so each extra unit adds less. At the point where MB = MC, the last unit is worth exactly what it costs to produce. Beyond that point, each extra unit costs more to make than it is worth to the people who consume it.
Why social surplus is maximised at the competitive equilibrium
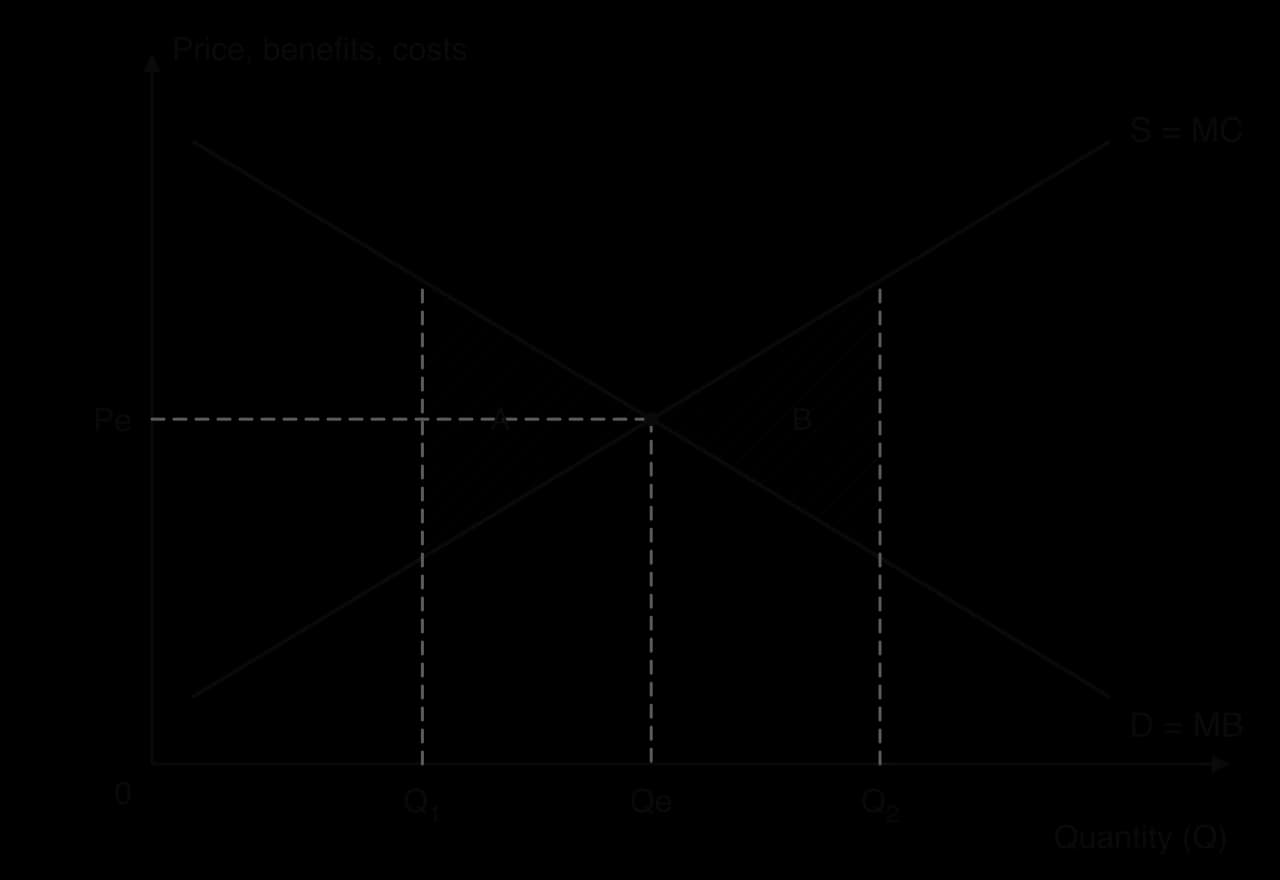
The diagram compares the competitive equilibrium Qe with two other quantities. At a lower quantity Q₁, MB is above MC: consumers value an extra unit at more than it costs to produce. Producing more would add to social surplus, and the units between Q₁ and Qe that are not produced represent lost surplus, the hatched area A. Resources are under-allocated to the good.
At a higher quantity Q₂, MC is above MB for every unit beyond Qe. Each of these units uses resources worth more than the benefit it gives, so producing them reduces social surplus by the hatched area B. Resources are over-allocated to the good and would create more value elsewhere. Only at Qe, where MB = MC, is it impossible to raise social surplus by producing more or less. This is the allocatively efficient quantity.
Lost social surplus of this kind is called welfare loss (or deadweight loss). It is the key measure used to analyse government intervention, such as price controls and taxes, and market failure, such as pollution.
The same idea appears throughout the course in different forms. Where a good creates spillover effects on third parties, the efficient quantity is where marginal social benefit equals marginal social cost. For an individual firm, allocative efficiency means producing where price equals marginal cost. All three conditions express the same principle: produce each unit whose benefit to society is at least as large as its cost.
Limits of the efficiency result
The conclusion that free markets are allocatively efficient depends on strong assumptions. The market must be competitive, with many buyers and sellers who are all price takers. Demand must reflect the full benefit of the good and supply the full cost, so there are no externalities. Buyers and sellers must have good information about what they are trading. When any of these conditions fails, the market equilibrium is no longer where social surplus is maximised, and there is a case for intervention.
Efficiency is also not the same as fairness. A market can be allocatively efficient while the goods go mainly to people with high incomes, because demand reflects ability to pay as well as need. An efficient allocation of medicine or housing may leave poor households without enough of either. Economists keep the two judgments separate: efficiency is about the size of the total surplus, equity is about how it is shared.
Calculating consumer and producer surplus (HL only)
Straight-line demand and supply curves turn surplus into simple geometry. Consumer and producer surplus at the competitive equilibrium are both right-angled triangles, whose area is half the base times the height. The base is the equilibrium quantity; the height is a difference between two prices read from the price axis.
Reading the values from a diagram
A diagram for a surplus calculation gives four values: the equilibrium price Pe and quantity Qe, the price at which the demand curve meets the price axis, and the price at which the supply curve meets it. The first of these intercepts is the highest price any consumer would pay; the second is the lowest price at which any producer would supply. Every height in the calculation is a difference between two of these prices, and the base is always Qe.
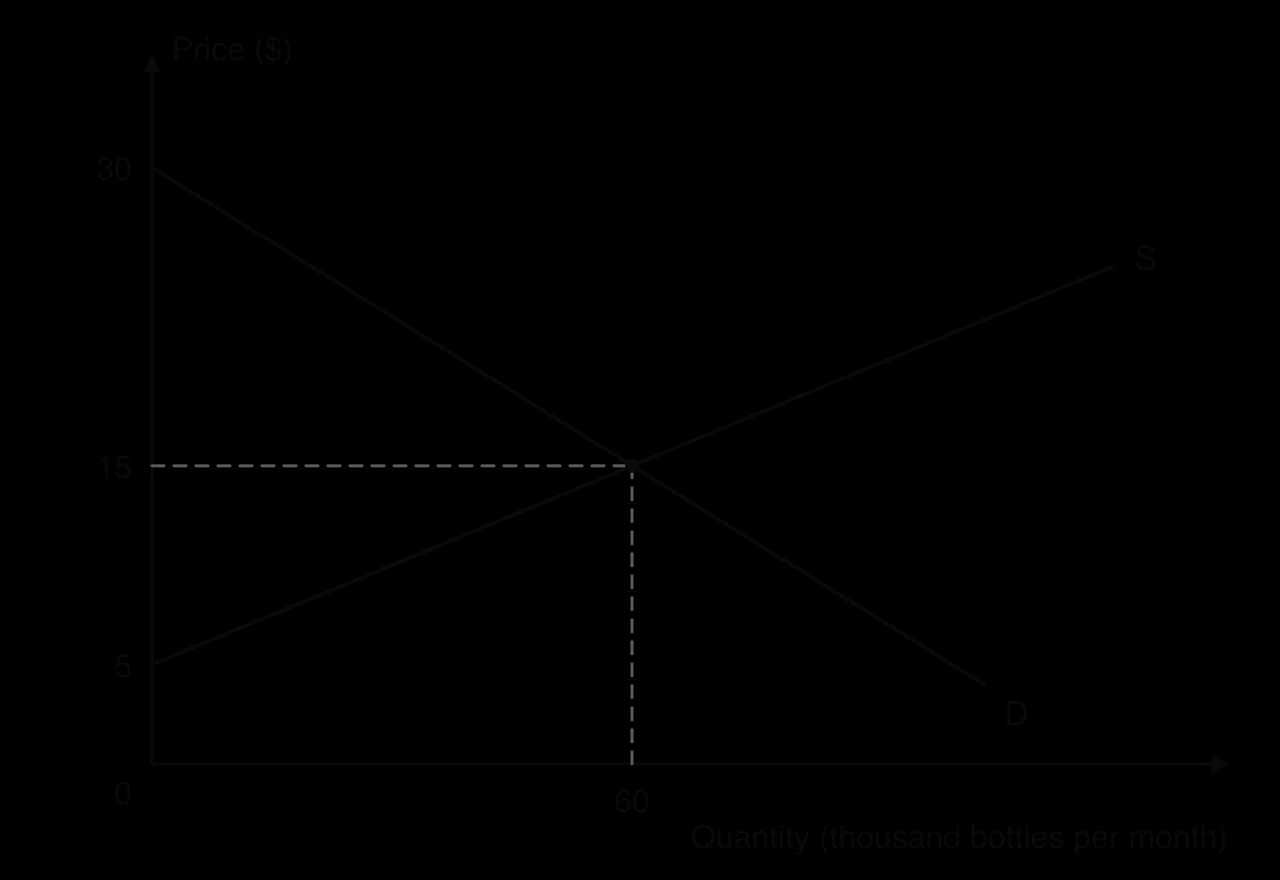
The diagram shows a hypothetical market for a reusable water bottle with all four values labelled. Demand meets the price axis at $30 and supply at $5, and the curves cross at Pe = $15 and Qe = 60 thousand bottles a month.
Calculating consumer and producer surplus from a diagram
The same method measures how surplus changes when a market changes. A new equilibrium is found first, then the triangles are recalculated with the new base and heights, and the two results are compared.
Measuring lost surplus away from equilibrium
If the market for water bottles were somehow limited to 48 thousand bottles, the units from 48 to 60 thousand would not be produced. Suppose the diagram shows that at Q = 48 thousand the demand curve is at $18 (MB) and the supply curve at $13 (MC). The lost social surplus is the triangle between the curves from 48 to 60 thousand: ½ × 12 000 × (18 − 13) = $30 000. Social surplus falls from $750 000 to $720 000. This triangle is the welfare loss used to analyse taxes, price controls and market failure.
Case study: US egg prices and bird flu, 2022–2026
Eggs are a staple food in the United States, eaten by most households and used by bakeries and food manufacturers. Demand for eggs changes little from month to month, and consumers have few close substitutes. Supply depends on the number of laying hens, and a hen takes several months to reach laying age. These features made the US egg market a clear real-world test of demand and supply analysis when an outbreak of highly pathogenic avian influenza ("bird flu") struck commercial flocks from February 2022.
What happened
The US Department of Agriculture (USDA) confirmed the virus in a commercial flock on 8 February 2022. Because the disease spreads quickly, whole flocks are culled once a case is found. By 25 March 2025, flocks containing about 168 million birds had been affected, and egg-laying hens made up around three-quarters of the losses. The average laying flock in 2024 was 5.3% smaller than in 2021.
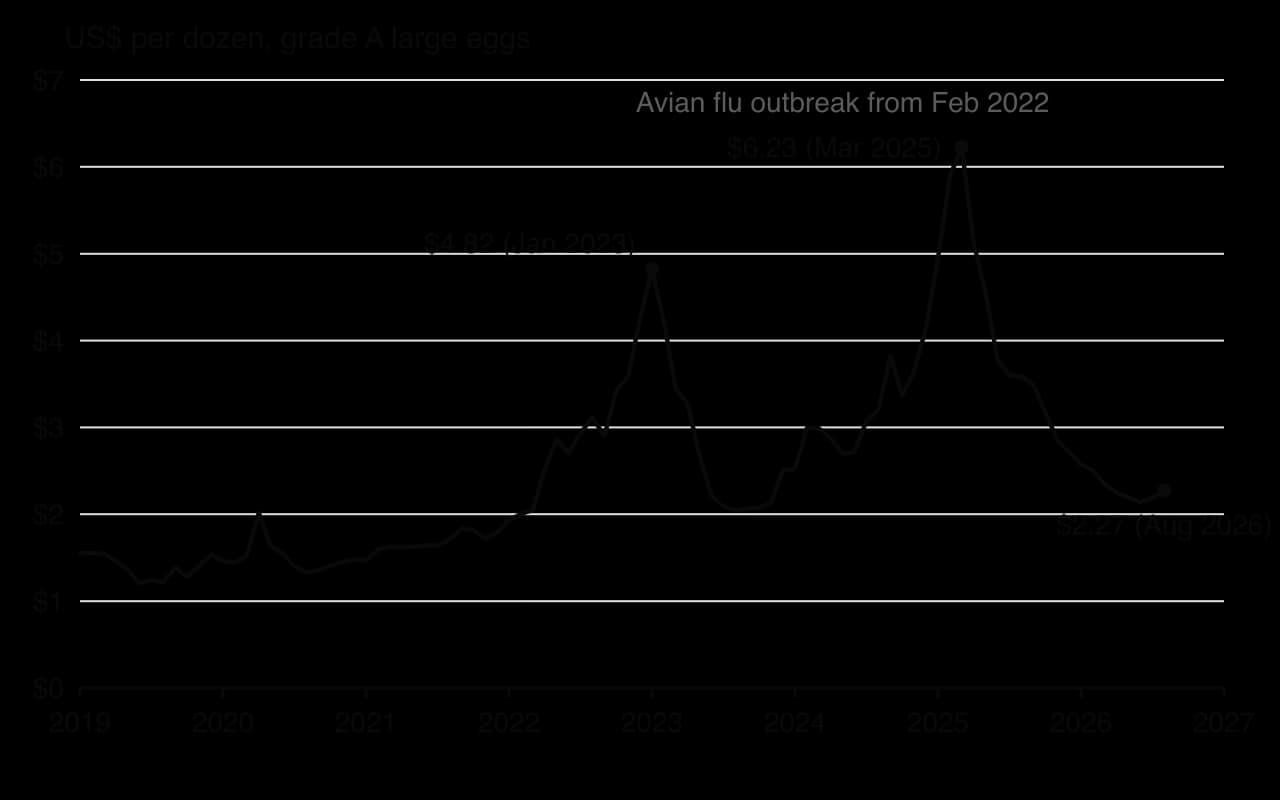
The chart shows the average US retail price of a dozen grade A large eggs. Before the outbreak the price stayed between about $1.20 and $1.80 from 2019 to 2021. It rose to $4.82 in January 2023, fell back as flocks recovered during 2023, and then rose again with a second, larger wave of infections in late 2024 and early 2025, reaching a record $6.23 in March 2025, more than three times the January 2022 price. By August 2026, after a long period without major losses, the price had fallen to $2.27.
Which theory explains it
Each wave of culling was a decrease in supply: the supply curve shifted to the left because fewer hens were laying. At the old price there was excess demand, which the price mechanism removed by raising the price. Because demand for eggs is price inelastic, quantity demanded contracted only a little as the price rose, so the price had to rise a long way to bring quantity demanded down to the reduced quantity available.
All three functions of the price mechanism are visible. The higher price rationed the eggs that were available: households cut back or switched to other foods, and buyers who valued eggs most, including food manufacturers with few alternatives, paid the higher price.
The price also signalled the scarcity to every buyer and producer in the country. And it gave farmers an incentive to restock and rebuild flocks as fast as possible, which shifted supply back to the right and brought the price down. Consumer surplus fell sharply during the peaks, while egg producers whose flocks escaped infection gained from the high prices: one major producer reported a 247% rise in quarterly net income in early 2025.
How the government responded
On 26 February 2025 the USDA announced a plan costing up to about $1 billion. Its parts, and the way each was meant to affect the market, are set out in the table.
Measure (2025) | Size | Intended effect on the egg market |
|---|---|---|
Biosecurity audits and upgrades on farms | About $500 million | Fewer future outbreaks, so supply is less likely to shift left again. |
Higher compensation for culled flocks (per laying hen raised from about $7 to nearly $17 in March 2025) | Up to $400 million | Farmers can afford to restock quickly, shifting supply back to the right. |
Research into vaccines and treatments | About $100 million | Longer-term protection of supply. |
Temporary egg imports (supplies arranged from countries including Türkiye and South Korea) | Not stated | Adds to supply in the US market immediately. |
Each measure aimed to shift supply back to the right, the same outcome the incentive function produces on its own, but faster and with less risk to farmers.
What the case shows, and its limits
The egg market behaved as the competitive model predicts: a supply shock raised the price, the price rationed the smaller supply, and the incentive to restock brought supply and the price back. No government order was needed to share out the eggs or to rebuild flocks. The model also explains why the swings were so large: with price-inelastic demand and supply that cannot respond for months, a given shift in supply produces a large change in price.
The case also shows the model’s limits. Not all of the price rise was necessarily caused by the fall in supply; the US Department of Justice opened an investigation into egg pricing, and the high profits of large producers raised questions about market power. Price rationing also bore hardest on low-income households, for whom eggs are a cheap source of protein, which raises questions of equity. Finally, the speed of recovery depended on biosecurity, government compensation and the virus itself, not on prices alone.
Sources: US Bureau of Labor Statistics via FRED, series APU0000708111 (2026); USDA Animal and Plant Health Inspection Service (2026); Congressional Research Service, IF12949 (April 2025); DTN/Progressive Farmer (26 February 2025).
Exam practice
Competitive market equilibrium is mainly examined through diagrams. Short questions ask for definitions (excess demand, consumer surplus, allocative efficiency) and for a labelled diagram showing a change in a market, explained in words. Paper 1 part (a) questions often ask for an explanation of the price mechanism or of a market change. Part (b) and Paper 2 part (g) questions bring in the limits of the price mechanism and the case for intervention. At HL, Paper 3 sets calculations of consumer and producer surplus from values on a diagram.
Paper 2-style short items (the answers are in the toggle):
Define the term consumer surplus. [2]
Draw a demand and supply diagram to show the effect of a rise in the cost of raw materials on the market for chocolate. [4]
Using the schedules in the worked example on bubble tea, calculate the excess demand at a price of $2. [2]
Explain why the market equilibrium is allocatively efficient. [4]
Show the answers
1. The difference between the highest price consumers are willing and able to pay for a good and the price they actually pay (1 mark for the idea of willingness to pay, 1 mark for the comparison with the price paid). Shown as the area below the demand curve and above the price.
2. Labelled axes (Price of chocolate, Quantity of chocolate), D and S₁, S shifting left to S₂ with an arrow, P₁ and Q₁ at the original equilibrium, P₂ (higher) and Q₂ (lower) at the new one. Explain: higher costs reduce supply, causing excess demand at P₁, so the price rises and quantity demanded contracts.
3. At $2, quantity demanded is 900 and quantity supplied is 300, so excess demand is 900 − 300 = 600 cups.
4. Draw D = MB and S = MC. At Qe, MB = MC: the value of the last unit to consumers equals its cost of production. Below Qe, MB > MC, so producing more would add to social surplus; above Qe, MC > MB, so producing those units reduces it. Social surplus is therefore maximised at Qe.
Summary
Market equilibrium is where quantity demanded equals quantity supplied, at the market-clearing price Pe and quantity Qe.
Above Pe there is excess supply and the price falls; below Pe there is excess demand and the price rises, until the market clears.
A shift in demand moves price and quantity in the same direction; a shift in supply moves them in opposite directions; when both shift, one effect is uncertain.
The price mechanism allocates resources through its signalling and incentive functions, and rations scarce goods to those willing and able to pay.
Consumer surplus is the area below demand and above the price; producer surplus is the area above supply and below the price; together they form social surplus.
Reading demand as MB and supply as MC, the competitive equilibrium is allocatively efficient: MB = MC and social surplus is maximised.
The efficiency result needs competition and no externalities, and it says nothing about whether the outcome is fair.
HL: consumer and producer surplus are calculated from values on a diagram as triangle areas, ½ × Qe × height.
Self-check
- To do:
I can draw a fully labelled market equilibrium diagram and explain why the market clears at Pe.
- To do:
I can explain how excess demand and excess supply move the price back to equilibrium.
- To do:
I can draw and explain the effect of a shift in demand, a shift in supply, and shifts in both.
- To do:
I can explain the signalling, incentive and rationing functions of the price mechanism with real examples.
- To do:
I can show consumer surplus, producer surplus and social surplus on a diagram.
- To do:
I can explain why the competitive equilibrium is allocatively efficient, where MB = MC, and why other quantities create a welfare loss.
- To do:
I can explain the limits of the price mechanism, including equity.
- To do:
I can calculate consumer, producer and social surplus from values on a diagram (HL).
Questions on 2.3
194 exam-style questions on this subtopic, written in the style of the IB papers. The first has its markscheme open. Counted on
Question 1 · ECON-0000425 marks
Every economy must decide how to use limited resources to satisfy the needs and wants of its population.
- (a)
Using a production possibilities curve (PPC), explain the concepts of scarcity, choice and opportunity cost.
10 marks
Markscheme (a)
Answers may include:
Terminology: definitions of scarcity (limited resources relative to unlimited needs and wants), choice (selecting between competing alternatives uses of resources), opportunity cost (the value of the next best alternative forgone), production possibilities curve (the maximum combinations of two goods that can be produced with all resources fully and efficiently employed, given technology).
Explanation: because factors of production are limited, the economy cannot produce beyond its PPC, so combinations outside the curve are unattainable (scarcity); society must choose a point on (or within) the curve, deciding which combination of the two goods to produce (choice); moving along the curve to produce more of one good requires resources to be transferred away from the other, so output of that good must be given up (opportunity cost); a concave curve shows that the opportunity cost rises as more of one good is produced because resources are not equally suited to both goods.
Diagram: a PPC with two goods on the axes; a point outside the curve labelled unattainable; a movement along the curve from point A to point B showing the gain in good X (ΔX) and the loss of good Y (ΔY) as the opportunity cost; may show a point inside the curve to contrast with efficient points.
A maximum of [6] should be awarded if only one or two of the three concepts are explained.
Markbands (best fit)
Level
Marks
Descriptor
0
0
The work does not reach a standard described by the descriptors below.
1
1–2
Little understanding of the specific demands of the question. Relevant economic theory is stated but not relevant. Economic terms are stated but not relevant.
2
3–4
Some understanding of the specific demands of the question. Relevant economic theory is described. Some relevant economic terms are included.
3
5–6
The specific demands of the question are understood but only partially addressed. Relevant economic theory is partly explained. Some relevant terms are used appropriately. Where appropriate, relevant diagram(s) are included.
4
7–8
The specific demands of the question are understood and addressed. Relevant economic theory is explained. Relevant terms are used mostly appropriately. Where appropriate, relevant diagram(s) are included and explained.
5
9–10
The specific demands of the question are understood and addressed. Relevant economic theory is fully explained. Relevant terms are used appropriately throughout. Where appropriate, relevant diagram(s) are included and fully explained.
- (b)
Using real-world examples, evaluate the view that the price mechanism is the best way to allocate scarce resources.
15 marks
Markscheme (b)
Answers may include:
Terminology: price mechanism, signalling, incentive and rationing functions of price, allocative efficiency, market failure, government intervention, planned economy.
Explanation: in competitive markets, changes in relative prices signal where resources are wanted and give producers an incentive to reallocate them; prices ration goods to those most willing and able to pay; at the competitive equilibrium marginal benefit equals marginal cost, so social surplus is maximized and allocative efficiency is achieved, without the information problems faced by central planners.
Diagram(s): demand and supply diagram showing a rise in demand, a higher price and an extension of supply as resources are reallocated; may show an externalities diagram with a welfare loss where the market over- or under-allocates resources.
Synthesis/evaluation: the price mechanism fails where there are externalities, public goods, common pool resources or (for HL candidates) asymmetric information and market power; it allocates according to ability to pay, so outcomes may be inequitable for necessities such as healthcare or housing; prices may be volatile (agricultural markets); government intervention can itself fail (information gaps, shortages under price controls, inefficiency in state enterprises); most real economies are mixed, suggesting that the price mechanism works best for most private goods while government is needed for others; consideration of the word 'best' and of alternatives such as planning or direct provision; a reasoned judgement.
Examples: shortages and queues in the former Soviet Union under central planning; Venezuela's price controls on food from the 2000s and the resulting shortages; the reallocation of resources towards electric vehicles and batteries as relative prices and demand changed; the failure of markets to provide clean air without carbon pricing, such as the EU Emissions Trading System (EU ETS); state provision of healthcare through the UK National Health Service (NHS).
For 'best' questions, a maximum of [12] should be awarded where no alternative methods of allocation are considered.
N.B. Terminology, theory, diagrams and examples given in part (a) and referred to in part (b) should be rewarded.
Examiners should be aware that candidates may take a different approach which, if appropriate, should be rewarded.
Markbands (best fit)
Level
Marks
Descriptor
0
0
The work does not reach a standard described by the descriptors below.
1
1–3
Little understanding of the specific demands of the question. Theory is stated but not relevant. Terms are not relevant. No synthesis or evaluation. Real-world examples are identified but not relevant.
2
4–6
Some understanding of the demands. Relevant theory is described. Some relevant terms are included. Synthesis or evaluation is superficial. A relevant real-world example is identified.
3
7–9
The demands are understood but only partially addressed. Theory is partly explained. Some terms are used appropriately. Relevant diagram(s) are included where appropriate. Synthesis or evaluation is appropriate but lacks balance. Example(s) are identified and partly developed in context.
4
10–12
The demands are understood and addressed. Theory is explained. Terms are used mostly appropriately. Diagram(s) are included and explained. Synthesis or evaluation is appropriate and mostly balanced. Example(s) are identified and developed in the context of the question.
5
13–15
The demands are understood and addressed. Theory is fully explained. Terms are used appropriately throughout. Diagram(s) are included and fully explained. Synthesis or evaluation is effective and balanced. Example(s) are identified and fully developed to support the argument.
Question 2 · ECON-0001325 marks
Consumers, producers and governments all face choices because resources are scarce.
- (a)
Explain how scarcity leads to opportunity cost in the decisions made by consumers, producers and governments.
10 marks
- (b)
Using real-world examples, evaluate the effects on stakeholders of a government subsidy granted to producers in a particular industry.
15 marks
Answer it, then compare with the markscheme.Check this one with a free account
Question 3 · ECON-0002025 marks
Households must meet both their needs and their wants with limited incomes.
- (a)
Explain the difference between needs and wants and why their unlimited nature gives rise to the economic problem of scarcity.
10 marks
- (b)
Using real-world examples, discuss the consequences for stakeholders of a maximum price (price ceiling) set on a staple food.
15 marks
Answer it, then compare with the markscheme.Check this one with a free account
Try a quick-fire question
One of 56 short multiple-choice questions on 2.3. Pick an answer to see why it's right or wrong.
A fall in supply raises the price of a good. What happens to consumer surplus, ceteris paribus?
Flashcards for 2.3
The official deck for this part of the syllabus.
2.3 Competitive market equilibrium · front
Explain why demand and supply curves are drawn on the same diagram.
2.3 Competitive market equilibrium · front
Explain why, at most prices, the plans of buyers and sellers do not match.
- 2.3 Competitive market equilibrium201 cards
Carry on with 2.3 in Augment
With a free account, Augment remembers where you stopped and what you have practiced.