4.4 Market research
Explain why and how organisations carry out market research, compare primary and secondary methods, distinguish qualitative from quantitative data, choose a sampling method and evaluate research, including its ethics.
- IB Business Management
- Part of 4 Marketing
- SL and HL
Key terms introduced here
Each is in the Business glossary, with every other term in the subject.
- Bias
A systematic distortion in research results, caused by the way the sample is chosen or the data is collected, which makes the results unrepresentative of the population.
- Closed question
A question that offers respondents a fixed set of possible answers, such as yes/no, multiple choice or a rating scale, so that results are easy to count and compare.
- Cluster sampling
A sampling method in which the population is divided into areas or groups, some of these clusters are chosen at random, and people are sampled only within the chosen clusters.
- Convenience sampling
A sampling method in which the researcher selects the people who are easiest and quickest to reach, such as passers-by or friends, without trying to represent the population.
- Ethnographic research
A form of observation in which researchers study people in their own everyday surroundings, such as homes or shops, over a period of time, to understand how and why they behave as they do.
- Focus group
A primary research method in which a small group of people, led by a moderator, discusses its opinions of and attitudes to a product, brand, advertisement or idea.
- Informed consent
The agreement of a person to take part in research after being told clearly who is carrying it out, what it involves and how their information will be used.
- Interview
A primary research method in which an interviewer asks an individual respondent questions directly, allowing answers to be explored in depth through follow-up questions.
- Market analysis
A published report on a particular market, usually by a specialist research firm, giving secondary data such as its size, growth, market shares, trends and forecasts.
- Market research
The process of collecting, analysing and interpreting information about a market, its customers and competitors, in order to make better marketing decisions.
- Mystery shopping
A form of observation in which a researcher acts as an ordinary customer to assess the quality of service, products and staff behaviour of a business or its competitors.
- Observation
A primary research method that collects information by watching and recording people’s behaviour, such as how customers shop or use a product, instead of asking them questions.
- Open question
A question that lets respondents answer in their own words rather than choose from fixed options, giving detailed qualitative information that is harder to analyse.
- Population
The entire group of people or organisations that a piece of market research is about and wants to draw conclusions on.
- Primary research
The collection of new, first-hand data for a specific purpose, directly from customers or the market, through methods such as surveys, interviews, focus groups and observations.
- Qualitative research
Research that collects non-numerical information about people’s opinions, feelings, motivations and attitudes, usually through interviews, focus groups, open questions or observation of small numbers of people.
- Quantitative research
Research that collects numerical data, such as how many people buy a product or what percentage prefer a design, which can be measured, counted and analysed statistically.
- Questionnaire
A written set of questions, in a fixed order, used to collect information from respondents in a survey.
- Quota sampling
A sampling method in which the population is divided into groups and a set number of people is chosen non-randomly from each group, usually in proportion to its share of the population.
- Random sampling
A sampling method in which every member of the population has an equal chance of being selected, for example by using a random number generator on a list of the population.
- Sample
A group of people selected from a population to take part in market research, whose answers are used to draw conclusions about the whole population.
- Sample size
The number of people, or other members of the population, included in a sample for market research.
- Sampling
The process of selecting a group of people from a population to take part in market research, so that conclusions about the population can be drawn from the group.
- Sampling error
The difference between a result from a sample and the true value for the whole population, caused by chance because only part of the population was studied; it falls as sample size rises.
- Secondary research
The use of data that already exists, collected by someone else or for another purpose, such as market analyses, government publications, academic journals, media articles and online content.
- Snowball sampling
A sampling method in which existing respondents recommend or recruit further respondents from among their contacts, used to reach small or hard-to-find groups.
- Stratified sampling
A sampling method in which the population is divided into groups (strata) and a random sample is taken from each group, usually in proportion to its size.
- Survey
A primary research method that collects information from a sample of people by asking each of them the same set of questions, usually in a questionnaire.
- Test marketing
Launching a product in a limited geographical area or to a small part of the market for a trial period, to measure customers’ response before deciding on a full launch.
Notes on 4.4 Market research
Learning objectives
Define market research, primary research and secondary research.
Explain why organisations carry out market research and describe the stages of the market research process.
Explain the advantages and disadvantages of surveys, interviews, focus groups and observations.
Explain the advantages and disadvantages of market analyses, academic journals, government publications, media articles and online content.
Distinguish between qualitative and quantitative research.
Explain quota, random and convenience sampling, and how sampling error and bias arise.
Calculate the size of each quota in a quota sample.
Evaluate how an organisation carries out market research, including the ethical issues it raises.
Introduction
Market research is the collection and analysis of information about customers, competitors and markets, used to support marketing decisions. Every business, from a street-food stall to a multinational company, decides what to sell, to whom, at what price and how to promote it, and market research reduces the guesswork in those decisions.
Market research links to all four key concepts. It is a response to change, because tastes, technology and competitors keep moving, and it feeds creativity when it shows needs that no product yet meets. It raises questions of ethics whenever it collects personal data, and it can support sustainability by measuring what customers will pay for greener products before a business commits to making them.
What market research is
A business that knows its customers well can design products they want, set prices they will pay and reach them through the media they use. Market research is the organised way of finding this out. It turns questions such as "Who would buy this?" or "Why are sales falling?" into data that managers can act on.
Some textbooks distinguish market research (research into a particular market) from marketing research (research into any part of marketing, such as the effect of an advertisement). In practice the two terms are used interchangeably.
The information market research provides
Market research answers four broad groups of questions. Each group supports a different set of decisions in the marketing plan.
Area | Typical questions | Decisions it supports |
|---|---|---|
Customers | Who buys the product? How often, where and why? What do they think of it? | Choosing a target market, building a consumer profile, product design |
The market | How large is the market? Is it growing? Which market segments are expanding? | Whether to enter a market, forecasting sales, setting objectives |
Competitors | Who are the main rivals? What are their prices, products and market share? | Pricing, positioning and finding a unique selling point |
The marketing mix | Did the advertising campaign raise awareness? Which package design do shoppers prefer? | Adjusting the marketing mix and measuring its effectiveness |
Large organisations often employ specialist research agencies, such as Ipsos, Kantar or NielsenIQ, which run surveys and tracking panels in many countries. Small businesses usually do their own research, cheaply and informally: a café owner who counts how many people pass the door at lunchtime is carrying out market research.
Why organisations carry out market research
Market research costs time and money, so a business carries it out only when the information is worth more than its cost. The value of research comes from the better decisions it allows. Six main purposes stand out.
To reduce the risk of decisions
Launching a product, entering a new country or changing a price can cost millions. Research reduces the risk of failure by testing the assumptions behind a decision before money is committed. It cannot remove risk completely, because customers may behave differently from what they say, and markets can change after the research is done.
The launch of New Coke in 1985 shows both the purpose and its limits. Coca-Cola changed its formula for the first time in 99 years after taste tests in which, according to the company, nearly 200,000 consumers preferred the new recipe. The tests measured taste but not the emotional attachment people felt to the original drink, and after protests the original formula returned as Coca-Cola Classic on 11 July 1985, 79 days after the launch.
Sources: ABC7/6abc News, "Beverage Backlash: History of New Coke" (2019), quoting The Coca-Cola Company.
To identify customer needs and wants
A business with a market orientation starts from what customers need and then designs products to meet it. Research shows those needs, including ones customers find hard to put into words. It also shows how needs differ between groups, which is the basis for dividing a market into segments and choosing which to target.
To test new products and ideas
Before a full launch, a business can test a concept, a prototype, a name, a price or a package with potential customers. A further step is test marketing: selling the product in one region or one group of stores for a limited time and measuring the results before deciding whether to launch it everywhere.
Test marketing gives evidence of real buying behaviour rather than stated intentions, but it is slow and it shows the product to competitors, who may copy it or react before the full launch.
To monitor competitors
Research into competitors’ prices, products, promotions and market share helps a business decide how to position itself and respond to rivals. Much of this comes from secondary sources such as competitors’ websites, annual reports and media coverage, and some from observation, such as visiting rivals’ stores.
To measure the effectiveness of marketing
After a campaign or a change to the marketing mix, research measures what it achieved: changes in brand awareness, website visits, sales or customer satisfaction. This allows managers to judge whether the marketing budget was well spent and to improve the next campaign.
To forecast and plan
Information on market size and growth, combined with the business’s own sales records, allows managers to forecast future sales. Those forecasts shape production, staffing, cash flow and the marketing budget.
The market research process
Good research follows a sequence of steps, each building on the one before. Skipping a step, especially the first, is a common reason for research producing data that answers the wrong question.
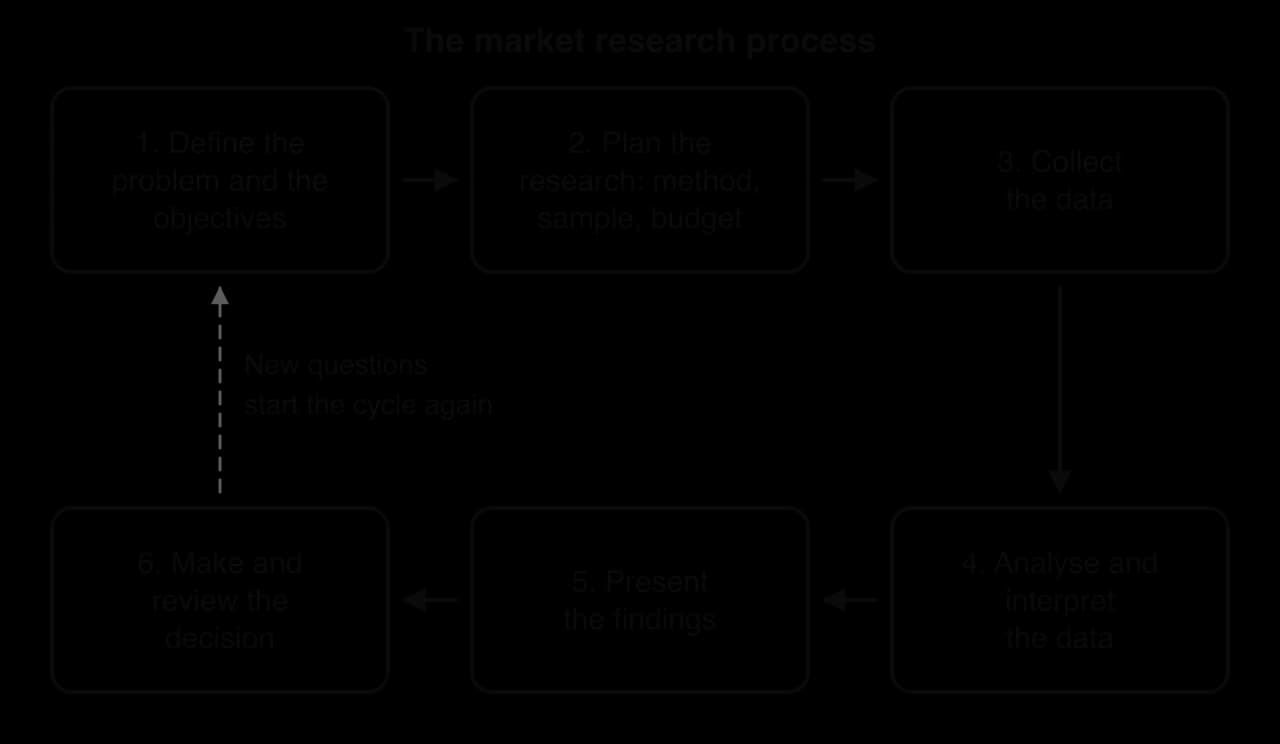
The diagram shows six stages:
Define the problem and the research objectives. A vague problem ("sales are falling") becomes precise objectives ("find out why customers aged 18–24 visit less often than a year ago").
Plan the research. Decide what information is needed, whether existing secondary data can provide it, which primary methods to use, who to ask (the sample), the budget and the timescale.
Collect the data. Carry out the survey, interviews, focus groups or observations, or gather the secondary sources.
Analyse and interpret the data. Summarise the numbers (percentages, averages, charts) and look for patterns and themes in opinions.
Present the findings. Report the results to decision-makers clearly, with their limitations, often with charts or an infographic.
Make and review the decision. Managers act on the findings and later check whether the decision worked, which often raises new questions.
Primary and secondary research
Every market research method collects either new information or information that already exists. This gives the first and most important classification of research methods.
Primary research is designed by the business for its own question, so the data is up to date and exactly relevant. It is also expensive and slow, because the business must design the research, find people to take part and analyse the results itself.
Secondary research is quicker and cheaper, and it is usually the first step in any project: there is little point paying for a survey to find a fact that a government statistics office already publishes free of charge. Its weakness is that the data was not collected for this business’s question, so it may be out of date, too general or of unknown accuracy.
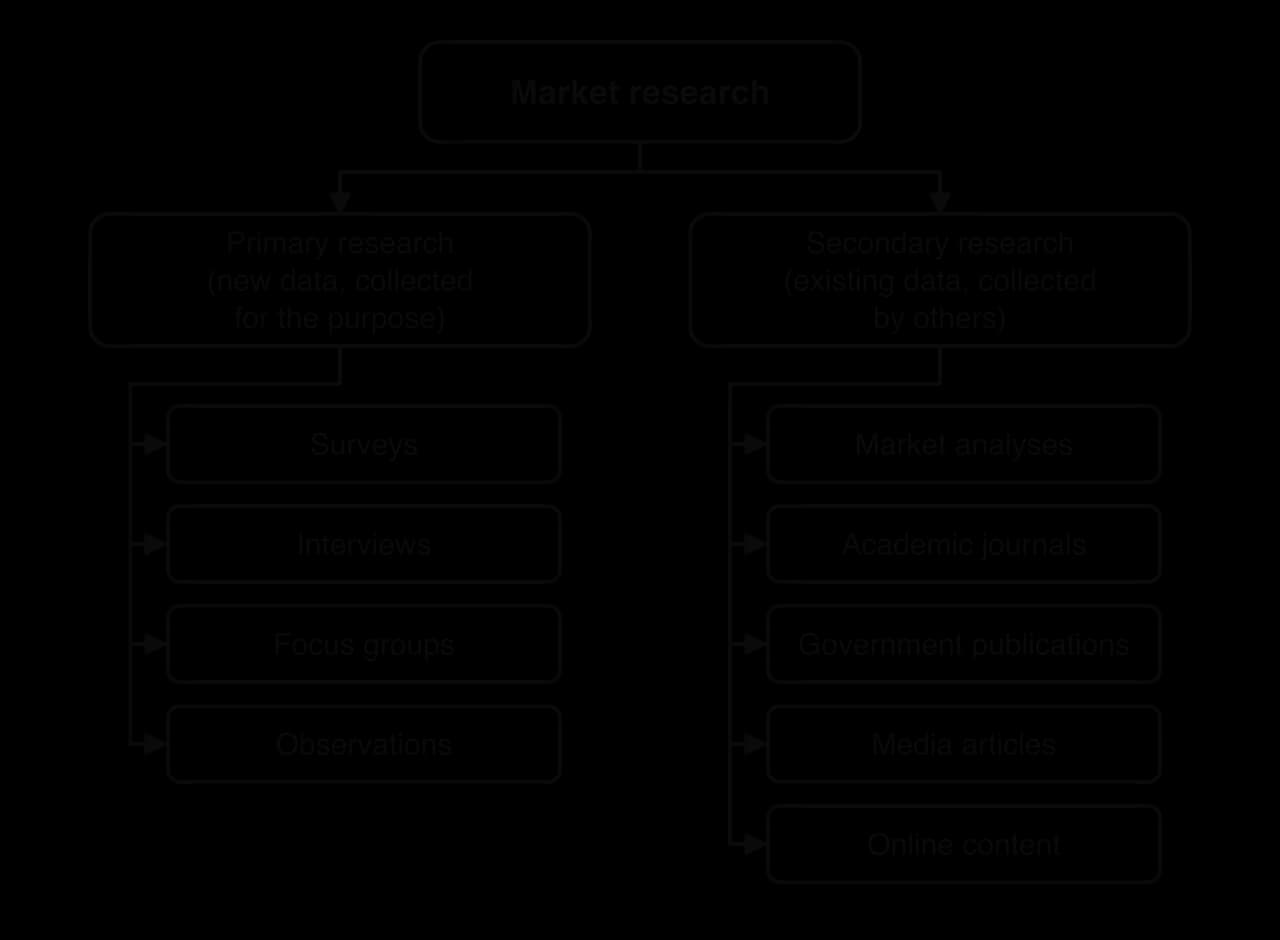
A business’s own records are a further secondary source, sometimes called internal secondary data: past sales figures, customer complaints, loyalty card records and website statistics. They are cheap to use and specific to the business, but they say nothing about people who are not yet customers.
Primary research methods
Four methods of primary research are used most often: surveys, interviews, focus groups and observations. Each suits a different kind of question, and many projects combine two or more.
Surveys
A survey asks a number of people the same set of questions so that their answers can be compared and counted. The set of questions is a questionnaire. Surveys can be carried out face to face (in the street or a store), by telephone, by post or, most often today, online through email links, websites, apps and social media.
The quality of a survey depends largely on its questionnaire. A well-designed questionnaire produces answers that are clear, comparable and honest.
Open and closed questions
Questionnaires use two kinds of question. A closed question offers a fixed set of answers (yes/no, multiple choice, a rating scale), so the results are easy to count and compare. An open question lets the respondent answer in their own words, which gives richer detail and reasons but takes longer to analyse.
Question type | Example | Main advantage | Main disadvantage |
|---|---|---|---|
Closed: yes/no | Bought a sports drink in the past month? Yes / No | Quick to answer and to count | Gives no reasons |
Closed: multiple choice | Brand bought most often: A / B / C / Other | Easy to turn into percentages and charts | Answer options may not cover every view |
Closed: rating (Likert) scale | Satisfaction with delivery time: 1 (very dissatisfied) to 5 (very satisfied) | Measures strength of opinion as a number | People interpret the scale differently |
Open | Any changes that would lead to more frequent visits: … | Shows reasons and new ideas | Slow to analyse; answers hard to compare |
A well-designed questionnaire is short, starts with easy questions, uses simple and neutral wording, asks one thing per question and is tested on a few people (a pilot) before it is sent out. A leading question, which pushes the respondent towards an answer ("Our new menu is excellent, isn’t it?"), produces results that overstate customers’ satisfaction and so mislead managers.
Evaluation of surveys
Advantages | Disadvantages |
|---|---|
Reach many people, so results can be counted and compared (quantitative data). | Closed questions give little insight into the reasons behind answers. |
Online surveys are cheap and fast, with answers analysed automatically. | Response rates are often low, and those who reply may differ from those who do not (non-response bias). |
Answers are comparable because everyone answers the same questions. | Poorly worded questions produce misleading results. |
Anonymous surveys may get more honest answers on sensitive topics. | People may give the answer they think the researcher hopes for rather than describe what they really do. |
Interviews
An interview is a conversation, face to face, by telephone or by video call, in which a trained interviewer asks one person questions. Interviews may be structured (a fixed list of questions, like a spoken questionnaire), semi-structured (key questions with freedom to follow up) or unstructured (an open conversation around a topic). In-depth interviews of 30–60 minutes are common in research with business customers, where a few buyers account for most sales.
Advantages | Disadvantages |
|---|---|
The interviewer can ask follow-up questions and explore reasons in depth. | Expensive and slow per respondent, so samples are small. |
Body language and tone add information. | Interviewer bias: the interviewer’s manner or wording can influence answers. |
Complex or technical topics can be explained. | Answers are hard to compare and to turn into numbers. |
Suits busy business customers and experts who will not fill in a questionnaire. | Respondents may give socially acceptable answers face to face. |
Focus groups
A focus group brings together a small group of people, typically six to ten who share some characteristic of the target market, for a discussion led by a moderator. The group may taste a product, look at advertisements or packaging, or talk about how they use a service. The discussion is usually recorded, and the business’s managers sometimes watch through a one-way mirror or a video link.
The main strength of a focus group is the interaction: one participant’s comment prompts others to agree, disagree or add ideas, which can bring out attitudes that a questionnaire would never reach. The main weakness follows from the same feature. A confident participant can dominate, others may go along with the group (groupthink), and a group of eight people cannot be taken to represent a whole market.
Advantages | Disadvantages |
|---|---|
Discussion brings out feelings, reasons and new ideas (qualitative data). | Small groups are not representative, so findings cannot be generalised to the market. |
Participants can react to prototypes, adverts and packaging. | Dominant members and group pressure can distort opinions. |
Cheaper and quicker than interviewing each person separately. | Results depend on the moderator’s skill and can be interpreted subjectively. |
Useful early in a project, to shape the questions for a later survey. | Participants know they are being studied and may behave unnaturally. |
Observations
Observation means watching and recording what people actually do, rather than asking them. A retailer may watch which way shoppers turn when they enter a store, how long they spend at a shelf and which products they pick up and put back. Online, website and app analytics record clicks, searches and abandoned shopping baskets, a digital form of observation carried out on a huge scale.
Two forms of observation are widely used in marketing. In ethnographic research, researchers spend time with people in their homes, workplaces or shops to understand how a product fits into their daily lives. In mystery shopping, a researcher poses as an ordinary customer to observe and rate the service a business, or its competitor, provides.
Observation is valuable because people often cannot or will not describe their own behaviour accurately. A shopper may say they always compare prices, while observation shows they pick the first brand they see. LEGO’s research for its Friends range relied heavily on watching girls play at home, which showed preferences that the girls themselves did not put into words.
Advantages | Disadvantages |
|---|---|
Records what people actually do, not what they say they do. | Shows what people do but not why they do it. |
Little effort is needed from the people observed. | People who know they are watched may change their behaviour. |
Digital observation (analytics) is cheap and covers huge numbers of users. | Ethnographic research is slow, costly and needs skilled researchers to interpret. |
Can show needs that customers have not recognised themselves. | Raises ethical questions about privacy and consent. |
 YouTube
Comparing the primary methods
No primary method is best in every situation. The right choice depends on the research objective: measuring how many people hold a view calls for a survey; understanding why calls for interviews or focus groups; and finding out what people actually do calls for observation.
Method | Type of data | Typical sample | Cost per respondent | Best for |
|---|---|---|---|---|
Survey | Mainly quantitative | Large (hundreds or thousands) | Low (online) to medium | Measuring how many customers think or do something |
Interview | Mainly qualitative | Small (10–30) | High | Exploring reasons in depth; business customers; experts |
Focus group | Qualitative | Small (6–10 per group) | Medium | Reactions to ideas, adverts and prototypes |
Observation | Both | Small (ethnography) to huge (web analytics) | Low to high | Actual behaviour, including habits people cannot describe |
Secondary research methods
Five main sources of secondary data are open to businesses: market analyses, academic journals, government publications, media articles and online content. They differ in cost, reliability, how up to date they are and how closely they match a business’s needs.
Market analyses
A market analysis is a report on a whole industry or market, usually produced by a specialist research company such as Mintel, Euromonitor International or GlobalData and sold to businesses. A typical report gives the size and growth of the market, the market shares of the leading firms, the main trends in consumer behaviour and forecasts for the next few years.
Market analyses save a business the cost of collecting market-wide data itself, and they are prepared by specialists. They can, however, cost thousands of dollars each, they are available to competitors too, and they cover a whole market rather than one business’s particular customers.
Academic journals
Academic journals publish research by universities and research institutes, checked by other experts before publication (peer review). Journals such as the Journal of Marketing or the Journal of Consumer Research report studies on how consumers make decisions, respond to prices or react to advertising. Their findings are rigorous, but they are often written for specialists, may be several years old and may study general behaviour rather than a particular market.
Government publications
Governments and international organisations publish large amounts of free data: population censuses, household spending surveys, earnings, inflation, trade and internet use. National statistics offices, such as the Office for National Statistics in the UK, the Kenya National Bureau of Statistics or the US Census Bureau, and international bodies such as the World Bank and the International Telecommunication Union (ITU) publish these figures. Such data is usually reliable, based on very large samples and free, but it is general rather than product-specific and is often published a year or more after it was collected.
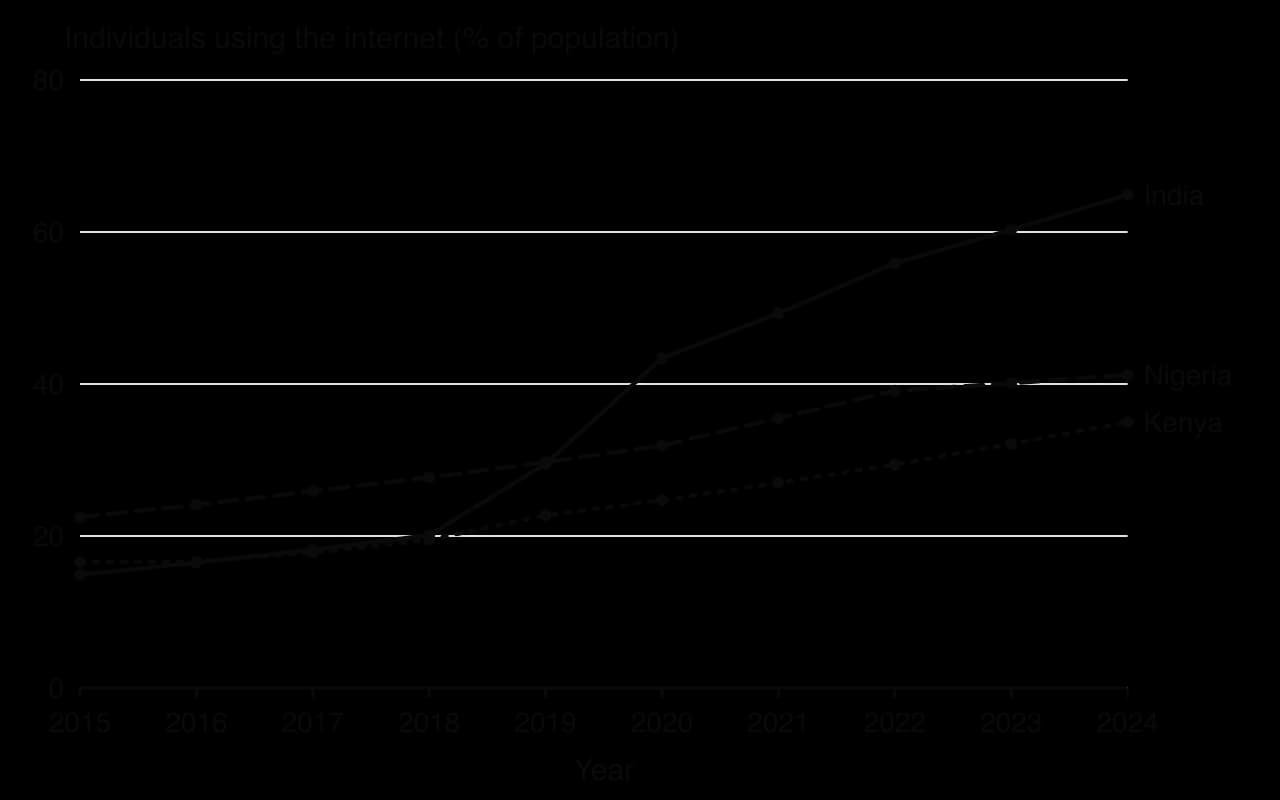
The chart shows how a business can use free secondary data before it plans primary research. A company planning an online survey of consumers in Kenya can see that only about 35% of the population used the internet in 2024. An online survey would therefore reach mainly younger, urban and higher-income people, and the results would be biased unless the business also used face-to-face or telephone methods.
Media articles
Newspapers, magazines, trade journals, television and radio report on companies, markets and consumer trends. Trade magazines, written for people working in one industry (grocery retailing, hotels, technology), are especially useful for news about competitors, new products and changes in regulation. Media articles are cheap and up to date, but journalists may simplify, and some articles reflect the views of the publisher or of the companies that supplied the story.
Online content
The internet holds a huge range of secondary information: competitors’ websites and prices, company annual reports, customer reviews, social media posts, blogs, forums and search data such as Google Trends, which shows how interest in a search term changes over time. Online content is fast and often free, and reviews and social media show what customers say about products in their own words.
The weakness of online content is reliability. Anyone can publish online, reviews can be fake, and people who post comments are rarely typical of all customers, since the most satisfied and the most annoyed are the most likely to write. A business using online content checks who published it, when, and whether other sources agree.
Evaluation of secondary sources
Source | Main strengths | Main limitations |
|---|---|---|
Market analyses | Specialist, market-wide data on size, shares and trends | Expensive; available to rivals; not specific to the business |
Academic journals | Rigorous, peer-reviewed findings | Technical; may be dated; general rather than market-specific |
Government publications | Free, reliable, very large samples | General; often a year or more out of date |
Media articles | Cheap and current; news about competitors and markets | May be simplified or biased; accuracy varies |
Online content | Fast, often free, shows customers’ own views | Reliability unknown; unrepresentative; can be fake |
Comparing primary and secondary research
Primary and secondary research are usually used together. Most projects begin with secondary research, which is cheaper and gives the background (market size, trends, competitors), and then use primary research to answer the questions that existing data cannot.
Criterion | Primary research | Secondary research |
|---|---|---|
Cost | High: design, collection and analysis are paid for by the business | Low or free (market analyses can be costly) |
Time | Slow: weeks or months | Fast: often hours or days |
Relevance | Designed for the exact question | Collected for another purpose; may not fit |
How up to date | Current | May be out of date |
Reliability | Known, because the business controls the method | Depends on the source; method may be unknown |
Confidentiality | Results belong to the business | Available to competitors as well |
Qualitative and quantitative research
The second classification of research concerns the type of data collected, not where it comes from. Some questions need numbers (how many, how often, how much); others need explanations (why, how, what people feel).
Quantitative research usually uses closed questions and large samples, so its results can be expressed as percentages, averages or charts and compared over time. It answers "what" and "how many" questions well, but it gives little insight into the reasons behind the numbers.
Qualitative research answers "why" questions. It can show what customers like about a brand, what puts them off a product or how they describe a problem, in their own words. Because samples are small and answers are interpreted by the researcher, its findings cannot be generalised to a whole market with confidence.
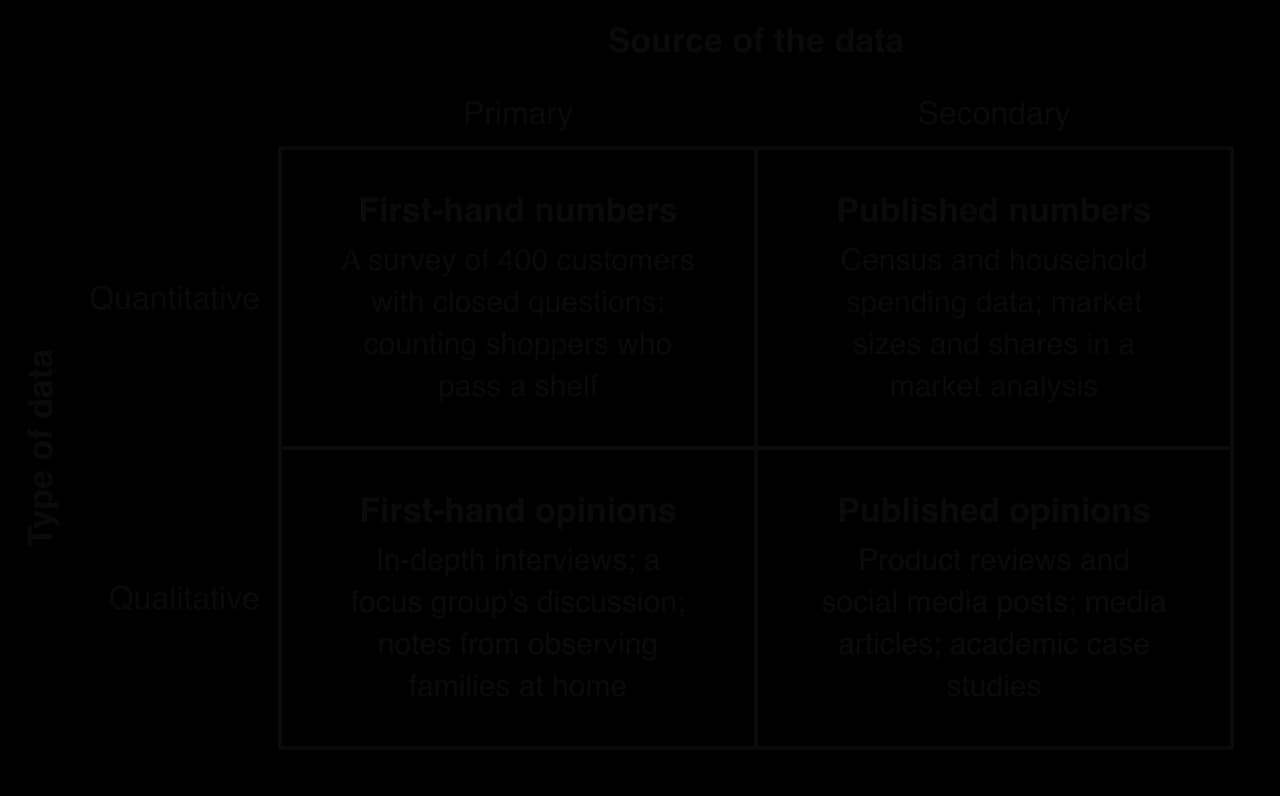
The New Coke taste tests were quantitative: they measured how many people preferred one taste to another. What they missed was qualitative, the feelings and loyalty attached to the original brand. A smaller programme of interviews or focus groups about what Coca-Cola meant to its drinkers might have shown that changing the formula carried a risk that taste scores could not measure.
Quantitative research | Qualitative research | |
|---|---|---|
Data | Numbers, percentages, statistics | Words, opinions, feelings, images |
Typical methods | Surveys with closed questions; sales and web data; counts in observation | Interviews; focus groups; open questions; ethnographic observation |
Sample | Large, chosen to be representative | Small, chosen for relevance |
Strengths | Objective; easy to compare and present; can be generalised if the sample is good | Explains reasons and motivations; finds new ideas and unexpected problems |
Limitations | Shows what, not why; limited by the questions asked | Subjective; costly per person; cannot be generalised with confidence |
Sampling
A business can rarely ask every customer or potential customer for their views. It asks a smaller group and uses their answers to draw conclusions about everyone. How that smaller group is chosen decides how far the conclusions can be trusted.
Population, sample and sample size
The population is the whole group the research is about, such as all the customers of a bank, all teenagers in a city or all the restaurants in a region. It is often called the target population.
A sample is the part of the population that is actually asked or observed. Studying a sample is quicker and cheaper than studying the whole population, which is called a census. A national census of every household, run by a government every ten years or so, shows how expensive studying an entire population is.
The sample size is the number of people in the sample. A larger sample usually gives more reliable results, but each extra respondent costs time and money, and beyond a certain point the gain in accuracy is small. The way the sample is chosen, its sampling method, matters at least as much as its size.
To choose a sample, researchers often need a sampling frame: a list of the members of the population, such as a customer database, a school register or an electoral roll. If the list leaves out part of the population, every sample drawn from it will too.
Random sampling
In random sampling, every member of the population has an equal chance of being selected. Researchers give each member of the sampling frame a number and use a random number generator, or a computer, to pick the sample. Because chance alone decides who is chosen, the researcher cannot favour any group.
Advantages | Disadvantages |
|---|---|
Free from the researcher’s own selection bias. | Needs a complete list of the population, which may not exist. |
Results can be generalised to the population, and the likely sampling error can be calculated. | Expensive and slow if the selected people are spread out or hard to contact. |
Simple to understand and to justify. | By chance, a small random sample may under-represent an important group. |
Quota sampling
In quota sampling, the population is divided into groups (by age, gender, income or location, for example) and the researcher is given a quota: a fixed number of people to find in each group, usually in proportion to the group’s share of the population. Within each group, the interviewer chooses who to ask, often by stopping people in the street until the quota is filled.
Quota sampling is the method most commercial street and online surveys use. It is cheaper and faster than random sampling and needs no list of the population, only knowledge of how the population divides into groups. Because the interviewer, or the willingness of people to join an online panel, decides who is chosen within each group, it is not random and can be biased.
Advantages | Disadvantages |
|---|---|
Ensures that each important group is represented in its correct proportion. | Selection within each group is not random, so interviewers may choose friendly or easy-to-reach people (bias). |
Quicker and cheaper than random sampling; no full list of the population is needed. | Only the characteristics used to set the quotas are controlled; the sample may be unrepresentative in other ways. |
Results are available fast, which suits time-sensitive decisions. | The likely sampling error cannot be calculated reliably. |
The UK general election of 2015 shows the risk. Most opinion polls, run by phone and online with samples matched to the population by age and gender, predicted a near tie between the two main parties; the Conservatives won by 36.9% to 30.4%. An independent inquiry found that the samples had systematically over-represented Labour voters, because the people who were easiest to reach and most willing to take part were not typical of all voters, even within each quota.
Sources: BBC News, "Election 2015: Polling failure caused by unrepresentative samples", 19 January 2016.
Convenience sampling
In convenience sampling, the researcher asks whoever is easiest to reach: friends and family, people passing a stall, the business’s social media followers or the first people to click on a survey link. It is the quickest and cheapest method and is widely used by small businesses and in early, exploratory research.
Advantages | Disadvantages |
|---|---|
Very quick, cheap and simple; suits a small budget. | Usually unrepresentative, so results cannot be generalised to the population. |
Useful for early testing of ideas or a questionnaire (a pilot). | High risk of bias: the people nearby or online may differ from the target market. |
No list of the population is needed. | Gives a false sense of certainty if the results are presented as the market’s view. |
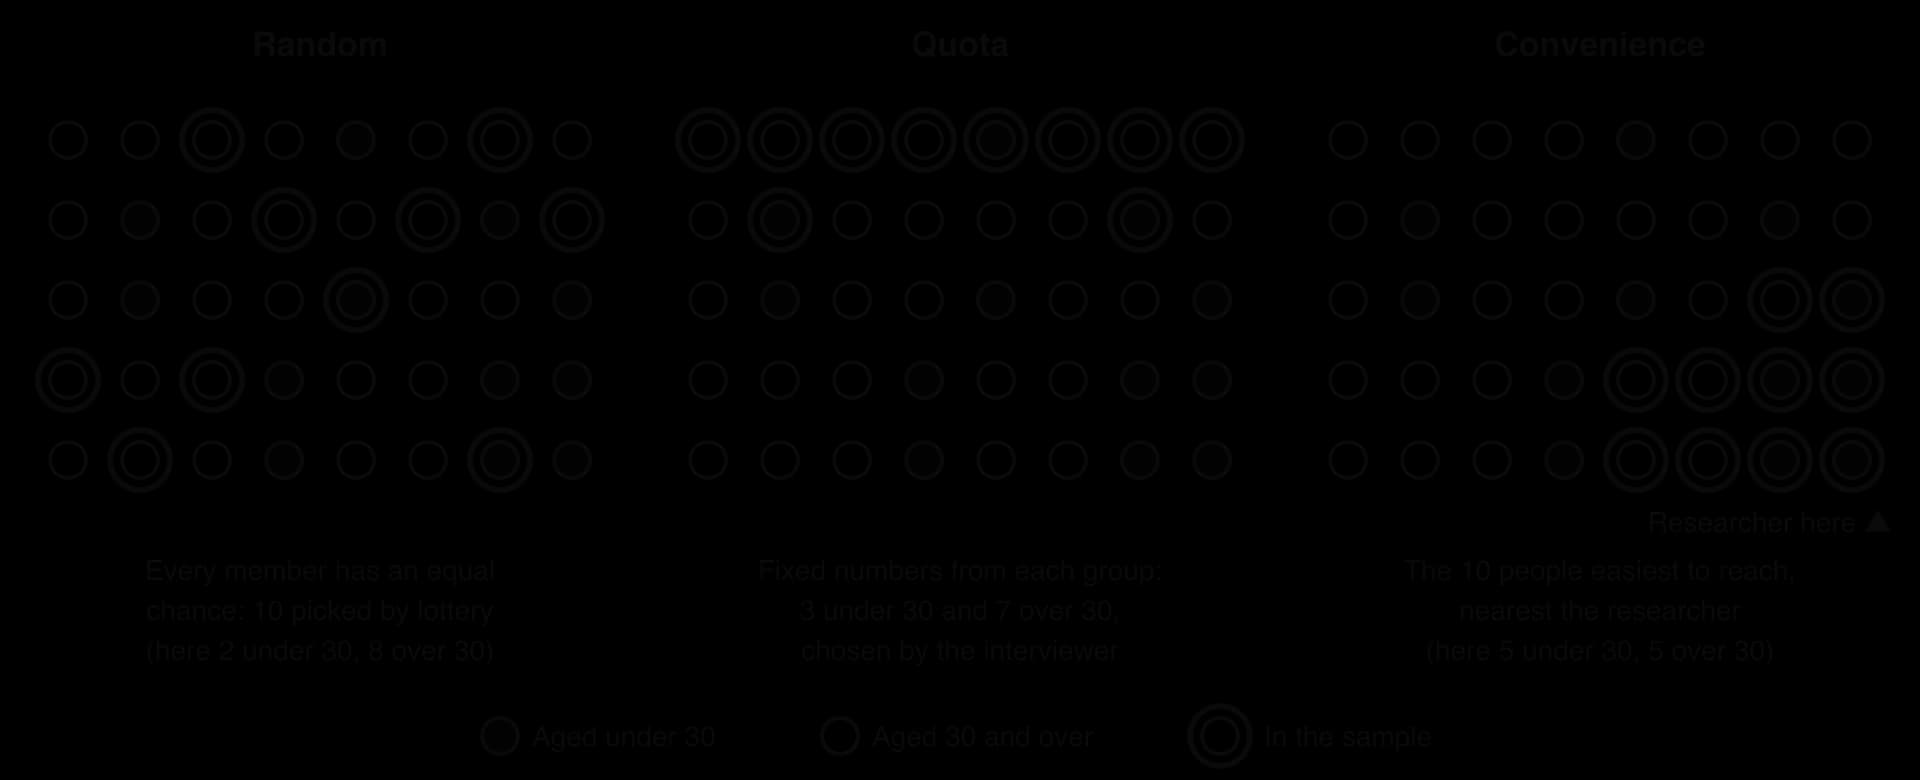
The figure shows the population of 40 people, of whom 12 (30%) are under 30. The random sample happens to include only 2 people under 30, a reminder that chance can still produce an unbalanced small sample. The quota sample matches the population’s age split exactly, but the interviewer filled it with the first people reached. The convenience sample is the cheapest but, because the researcher stood where younger people gathered, half of it is under 30.
Other sampling methods
Three further methods are used in market research. They extend the ideas of random and quota sampling.
Stratified sampling divides the population into groups, as quota sampling does, but then selects people randomly within each group. It combines the representativeness of quotas with the fairness of random selection, but it needs a full list of each group.
Cluster sampling is used when the population is spread over a wide area. The researcher randomly selects a few areas, such as towns, schools or stores, and then surveys people only within them. It saves travel costs, but the chosen clusters may not be typical of the whole population.
Snowball sampling starts with a few suitable respondents and asks each of them to recommend others. It is useful for reaching small or hidden groups, such as owners of rare classic cars or specialist professionals, but the sample consists of people who know each other and may share the same views.
 YouTube
Sampling error and bias
Results from a sample are an estimate of the population’s views, and an estimate can be wrong for two different reasons: chance and bias.
Sampling error cannot be avoided completely, but it gets smaller as the sample gets larger, and for a random sample it can be estimated. A survey of 1,000 randomly chosen people gives a much more precise estimate than a survey of 100, as long as both samples are chosen without bias.
How large is sampling error?
For a random sample, statisticians estimate the likely sampling error with a margin of error. When half the population holds a view, a result is likely (with 95% confidence) to be within this many percentage points of the true value:
Sample size (n) | Approximate margin of error |
|---|---|
100 | ± 9.8 percentage points |
200 | ± 6.9 percentage points |
400 | ± 4.9 percentage points |
1,000 | ± 3.1 percentage points |
Quadrupling the sample from 100 to 400 only halves the margin of error, which is why most national opinion polls stop at about 1,000–2,000 people. The formula applies only to random samples and says nothing about bias.
Bias is a systematic error that pushes results in one direction. It comes from the way the research is designed or carried out, so a larger sample does not remove it.
Selection bias: the sample leaves out or under-represents part of the population, for example an online survey in a country where most people are offline.
Non-response bias: the people who reply differ from those who do not, for example when only the most loyal or the most dissatisfied customers answer.
Response bias: respondents give inaccurate answers, because of leading questions, a wish to please the interviewer or embarrassment.
Interviewer bias: the interviewer’s manner, wording or choice of whom to approach influences the results.
The best-known example is the 1936 US presidential poll by the magazine The Literary Digest. It mailed about 10 million mock ballots, mostly to its readers and to car and telephone owners, and received about 2.4 million replies, which predicted a clear win for Alf Landon. Franklin D. Roosevelt won in a landslide. Later research found that non-response bias was the main cause, because voters who disliked Roosevelt were much more likely to reply, while George Gallup predicted the winner correctly with a far smaller sample.
Sources: Squire, P. (1988), "Why the 1936 Literary Digest Poll Failed", Public Opinion Quarterly 52(1); Freedman, D., Pisani, R. and Purves, R. (2007), Statistics, 4th edition.
Choosing a sampling method
The right method depends on what the research is for and on the resources available. Random sampling is most accurate but most demanding; convenience sampling is least demanding but least reliable; quota sampling is the usual compromise in commercial research.
Factor | Random | Quota | Convenience |
|---|---|---|---|
Representativeness | High | Medium: groups are right, selection within them is not random | Low |
Cost and time | High | Medium | Low |
List of population needed? | Yes | No (only group sizes) | No |
Risk of bias | Low | Medium | High |
Suits | Important decisions; known populations such as a customer database | Commercial surveys and opinion polls on a budget | Pilots, early ideas, very small businesses |
The ethics of market research
Market research collects information about people, often personal, and sometimes without their full awareness. This makes ethics central to how it is carried out. Research that deceives or harms people damages the trust between a business and its customers, and in many countries it is also illegal.
Privacy and data protection
Businesses must protect the personal data they collect, keep it securely, use it only for the purpose stated and delete it when it is no longer needed. In the European Union and the UK, the General Data Protection Regulation (in force since May 2018) sets these rules and allows large fines; many other countries, including Brazil, India and South Africa, have similar laws. Ethical researchers also collect only the data they need and anonymise results so that individuals cannot be identified.
Informed consent
People taking part in research should know who is collecting the data, what it is for and how it will be used, and should agree freely to take part. This is informed consent. It matters most when the data is sensitive (health, finance, religion), when people are observed or tracked online, and when the participants are children, whose parents or guardians must give consent.
The Cambridge Analytica scandal shows what happens when consent is missing. A researcher’s personality quiz app collected the Facebook data of up to 87 million people, including friends of quiz users who had never downloaded the app, and some of the data was used for political advertising. In October 2018 the UK Information Commissioner’s Office fined Facebook £500,000, the maximum under the law then in force, for allowing developers access to people’s information "without sufficiently clear and informed consent".
Sources: BBC News, "Facebook fined £500,000 for Cambridge Analytica scandal", 25 October 2018.
Honesty and the use of findings
Two further ethical issues concern honesty. Selling under the pretence of research ("sugging"), where a call or email presented as a survey turns into a sales pitch, misleads people; fundraising in the same way is called "frugging". The Market Research Society’s code of conduct bans both. Research findings can also be misused: a business may publish only the favourable results of a survey, or use a tiny sample to support an advertising claim. ESOMAR, the global association of research professionals, publishes a similar international code that requires honesty, consent and the protection of participants.
Sources: Market Research Society, Code of Conduct (2023), rule 4.
Ethics is only one of the key concepts that market research touches. The table summarises how each of the four applies.
Key concept | How it applies to market research |
|---|---|
Change | Research tracks changes in tastes, technology and competition; online and mobile data have changed how research itself is done. |
Creativity | Observation and qualitative research can show unmet needs that lead to new products; creative research design reaches groups that surveys miss. |
Ethics | Privacy, informed consent (especially for children), honesty in presenting findings and avoiding manipulation. |
Sustainability | Research measures demand for sustainable products and whether customers will pay more for them, and checks that sustainability claims match what customers understand. |
Evaluation: why and how organisations carry out market research
Market research gives managers evidence rather than opinion, but evidence of a particular kind: what a sample of people said or did at a particular time. Its value depends on how well it is designed and how carefully its results are interpreted.
Benefits
Reduces the risk of costly failures by testing ideas before money is committed.
Keeps the business close to its customers’ changing needs, supporting a market orientation.
Provides evidence that can persuade investors, lenders and senior managers to back a plan.
Measures the results of marketing spending, so budgets can be moved to what works.
Shows competitors’ strengths and weaknesses, helping a business find a distinctive position.
Limitations
Cost and time. Good primary research is expensive and slow; by the time results arrive, the market may have moved or a competitor may have launched first.
Reliability. Results are only as good as the sample and the questions. Biased samples, leading questions and small groups produce confident but wrong conclusions.
Stated versus actual behaviour. People often say they will buy a product, or pay more for an ethical one, and then do not.
Past views may not predict future behaviour. Research describes current or past views; it may not predict reactions to a product that is genuinely new, because customers find it hard to imagine what they have never seen.
Interpretation. The same data can support different conclusions, and managers may use research to confirm a decision they have already made.
What the value of market research depends on
Whether research is worth its cost, and which methods suit, depends on the situation. The most important factors are:
The size of the risk. A multinational launching a new product line can justify years of research; a market stall testing a new flavour can simply try it for a week.
The budget and size of the business. Small businesses rely on secondary sources, their own records, convenience samples and observation; large ones can afford random samples, agencies and ethnographic studies.
The type of question. "How many?" needs quantitative research with a representative sample; "why?" needs qualitative methods.
The type of market. In business-to-business markets with few customers, in-depth interviews with the main buyers may be enough; consumer markets need larger samples.
How fast the market changes. In fast-moving markets such as fashion and technology, quick, cheap research repeated often may be more useful than one slow, thorough study.
How new the product is. Research tests improvements to existing products well; for radical innovations, observation of behaviour and test marketing tell managers more than asking people what they want.
In most cases the strongest approach is a combination: secondary research for the background, qualitative research to understand customers and shape the questions, and quantitative research on a well-chosen sample to measure how far the findings apply. Managers still have to judge what the results mean, so the businesses that gain most from research treat its findings as evidence to weigh alongside their own experience, with the limits of the sample and the method in mind.
Case study: LEGO Friends and research into how girls play
By the late 2000s the LEGO Group, the Danish toy maker, had recovered from a financial crisis in the early 2000s by focusing on construction sets that mainly appealed to boys, such as LEGO City and LEGO Star Wars. Previous attempts to attract girls had either failed or been only modestly successful, and LEGO’s managers wanted to understand why before trying again.
How LEGO researched the market
Starting in 2007, LEGO sent small teams of designers, marketers and outside consultants to shadow girls and interview their families over a period of months in Germany, South Korea, the UK and the USA. The approach was mainly ethnographic rather than based on focus groups. The teams watched girls play in their own homes and talked to them and their parents about their toys and routines. Including design and testing, the project took four years.
The research produced qualitative findings that a questionnaire would have been unlikely to show. Girls did like to build, but differently from boys: they preferred "stops along the way", starting to tell stories and rearrange the model before it was finished, rather than building straight through to match the picture on the box. Many wanted a figure they could identify with, which the square LEGO minifigure did not offer. And they cared about beauty, which LEGO’s researchers broke down into harmony, friendlier colours and a high level of detail.
The greatest concern for girls really was beauty.
— Hanne Groth, LEGO market research manager, quoted in Bloomberg Businessweek, "Lego Is for Girls", December 2011
Each finding shaped the product. The Friends sets, set in a fictional town called Heartlake City, came with pieces bagged so that girls could start playing before finishing the whole model, six new colours (bright pink was already in the LEGO palette), and a new "mini-doll" figure, taller and more detailed than the minifigure, with five named main characters and backstories. LEGO launched 23 products in the UK on 26 December 2011 and in the USA on 1 January 2012, after the Christmas rush, so that retailers would give the range its own shelf space, supported by a US$40 million global marketing campaign.
The results
LEGO Friends sold far more than forecast. By mid-2012 LEGO had sold twice as many Friends sets as it expected for the first half of the year and had to increase production, and in its 2012 annual results it said the range had performed twice as well as expected. In the USA, sales of the range were about three times higher than LEGO had expected. Group revenue rose by 25% in 2012, with LEGO naming Friends as one of the main reasons alongside LEGO Star Wars, LEGO City and LEGO Ninjago.
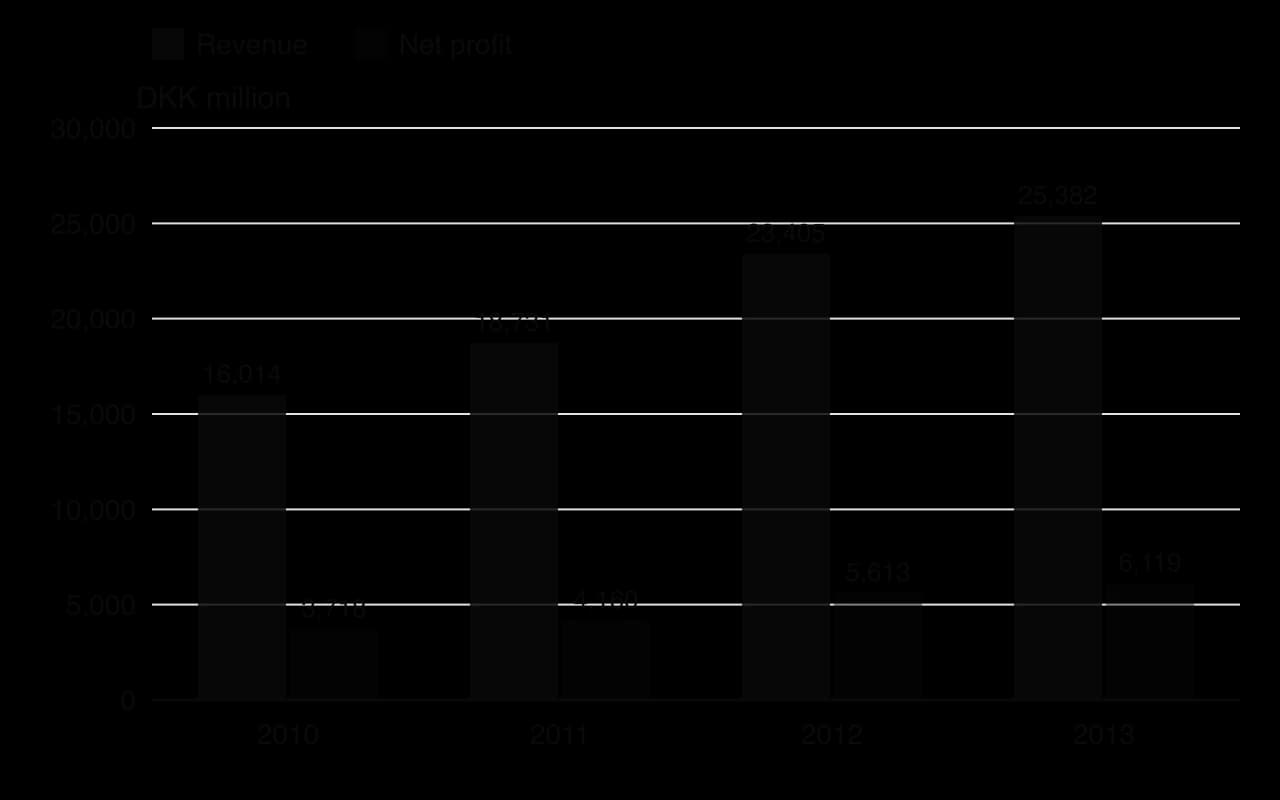
The chart shows LEGO’s revenue and net profit in the years around the launch. The 2012 figure is shown as first reported; LEGO’s 2013 report restated 2012 revenue as DKK 23,095 million. The research did not create the growth on its own, but it allowed LEGO to enter a segment it had failed to reach several times before, at a lower risk than a launch based on guesswork.
Criticism and limits
The research-led design was also criticised. Campaign groups said the pink and purple sets, the beauty salon and the café reinforced gender stereotypes, and a US petition by the SPARK movement asking LEGO to change its marketing gathered more than 50,000 signatures. The criticism points to a tension in research-led design. By designing around what girls in 2007–2011 said and did, LEGO risked reinforcing the patterns that earlier toy marketing had helped to create.
The case shows the strengths of qualitative, observational research. Watching children play in their own homes showed needs that girls could not have described in a survey, and it gave designers specific, usable ideas. It also shows the limits: the research was slow and costly, it described current behaviour rather than how attitudes might change, and good research did not settle the ethical question of whether the business should simply give customers what they appear to want.
Sources: Bloomberg Businessweek, "Lego Is for Girls", 14 December 2011; The Guardian, "Lego’s ‘sexist’ Friends range for girls spurs 35% profit rise", 31 August 2012; LEGO Group interim results press release, August 2012; The Copenhagen Post, 21 February 2013; LEGO Group press releases on its annual results for 2011 (1 March 2012), 2012 (21 February 2013) and 2013 (27 February 2014); Associated Press, 28 February 2013.
Explain why LEGO chose ethnographic observation rather than a large survey to research how girls play.
Explain one limitation of LEGO’s research in drawing conclusions about girls in all of its markets.
To what extent does the success of LEGO Friends show that market research reduces the risk of launching a new product?
Exam practice
Market research appears in Paper 1 and Paper 2 at SL and HL, usually as short structured questions (define, explain, distinguish, calculate a quota) and as part of 10-mark extended responses on marketing decisions, where you are asked to evaluate or recommend research methods for the business in the case.
Definitions earn full marks when they are precise and not circular: "a focus group is a group that focuses on a product" earns nothing.
A calculation like this is often followed by a part asking why the quota sample might still be unrepresentative.
Distinguishing questions ask for the difference between two concepts, with both sides made explicit.
Summary
Market research collects and analyses information about customers, markets and competitors to reduce the risk of marketing decisions.
It follows a process: define the problem and objectives, plan, collect, analyse, present, then decide and review.
Primary research collects new data (surveys, interviews, focus groups, observations); secondary research uses existing data (market analyses, academic journals, government publications, media articles, online content).
Quantitative research measures how many; qualitative research explains why. Source (primary or secondary) and type (quantitative or qualitative) are separate classifications.
A sample represents a population. Random sampling gives everyone an equal chance; quota sampling fixes the number from each group; convenience sampling takes whoever is easiest to reach.
Sampling error comes from chance and falls as the sample grows; bias is systematic and is not cured by a larger sample.
Ethical research respects privacy and data protection, obtains informed consent and reports findings honestly.
The value of research depends on the size of the risk, the budget, the question, the market and how new the product is; combining methods is usually strongest.
Self-check
- To do:
I can define market research, primary research and secondary research.
- To do:
I can explain why organisations carry out market research and describe the market research process.
- To do:
I can explain the advantages and disadvantages of surveys, interviews, focus groups and observations.
- To do:
I can explain the advantages and disadvantages of the five secondary sources.
- To do:
I can distinguish between qualitative and quantitative research and give an example of each.
- To do:
I can explain quota, random and convenience sampling, and the difference between sampling error and bias.
- To do:
I can calculate the quota for each group in a quota sample.
- To do:
I can evaluate the research methods an organisation uses, including their ethical issues, and recommend a suitable combination.
Questions on 4.4
66 exam-style questions on this subtopic, written in the style of the IB papers. The first has its markscheme open. Counted on
Question 1 · BM-0020020 marks
Loxley Acoustics
[1] Loxley Acoustics (LA) is a private limited company in Sheffield, United Kingdom, founded in 2012 by two acoustic engineers, Owen Pryce and Hamid Qureshi. LA designs and assembles wired studio headphones. Its products have won several engineering awards, and Owen describes LA’s approach as “build the best headphone we can, then find the people who appreciate it”. LA spends 11 % of its revenue on research and development (R&D) but has never carried out any formal market research.
[2] For many years LA sold most of its output to recording studios and professional musicians. Since 2022, however, sales have been flat. Retailers report that younger buyers want wireless headphones with noise cancelling, long battery life and a choice of colours. LA’s headphones are available only in black and only with a cable.
[3] In 2025 the board appointed Lerato Mokoena, previously a marketing director at a consumer electronics firm, as chief executive officer (CEO). Lerato wants LA to become market oriented. She has proposed spending £180 000 on a programme of primary market research, including surveys of 2 000 headphone buyers and focus groups in five cities, before LA designs its first wireless range.
[4] Owen and Hamid are worried. They argue that customers “do not know what they want until they hear it”, that the research would take six months and that £180 000 is almost half of LA’s annual profit. Hamid suggests that LA could instead use secondary data from market analyses and online product reviews, which would cost less than £10 000.
- (a)
Define the term primary market research.
2 marks
Markscheme (a)
Award [1] for a partial definition that shows some understanding, e.g. “research that a business does itself” or a vague reference to collecting new data.
Award [2] for a full definition, e.g. the collection of first-hand (new) data by or for a business, directly from customers or the market, for a specific purpose that it has set, for example through surveys, interviews, focus groups or observation.
To award [2] the definition must convey that the data is new (first-hand) and collected for the business’s own specific purpose. Award [0] for a tautological answer that only repeats the term.
Candidates are not expected to word their definition exactly as above.
- (b)
Explain two advantages to LA of being product oriented (paragraph 1).
4 marks
Markscheme (b)
Possible advantages include:
Technical quality and reputation: by focusing on building “the best headphone we can”, LA has won engineering awards, which gives it credibility with professional studios and musicians.
Innovation driven by expertise: spending 11 % of revenue on R&D and being led by acoustic engineers allows LA to create products that customers may not yet imagine, which can give a first-mover advantage.
Premium prices: a product that is technically superior can command a high price from buyers who value sound quality, such as recording studios.
Lower spending on market research: LA has saved the cost of formal research and can concentrate its resources on design and engineering, where its strengths lie.
Accept any other relevant advantage applied to LA.
Mark as 2 + 2. For each advantage, award [1] for identifying a relevant advantage of product orientation and [1] for explaining it in the context of LA.
Award a maximum of [2] for a theoretical answer with no reference to LA.
- (c)
Explain two reasons why LA’s sales may have been flat since 2022 (paragraph 2).
4 marks
Markscheme (c)
Possible reasons include:
Changing customer tastes: younger buyers want wireless headphones with noise cancelling and long battery life, but LA sells only wired headphones, so it is missing the growing part of the market.
Product orientation: LA designs products without researching customer needs, so it has not noticed or responded to the shift in demand reported by retailers.
A narrow, mature customer base: LA sells mainly to recording studios and professional musicians, a segment that may not be growing and whose members replace headphones infrequently.
Limited choice: LA’s headphones are available only in black, while buyers want a choice of colours, so rivals offering variety may be gaining sales.
Accept any other relevant reason supported by the case.
Mark as 2 + 2. For each reason, award [1] for identifying a relevant reason and [1] for explaining it with reference to LA.
- (d)
Discuss whether LA should spend £180 000 on Lerato’s programme of primary market research before designing its wireless range.
10 marks
Markscheme (d)
Arguments for the primary research programme:
LA has never carried out formal market research and is moving into a new segment (wireless headphones for younger consumers) where its engineers have no experience; primary research reduces the risk of designing a product nobody wants.
The data would be specific to LA’s questions (preferred features, colours, price points, battery life) and confidential, unlike secondary data that competitors can also read.
A survey of 2 000 buyers gives quantitative data that can be analysed statistically, while focus groups in five cities give qualitative insight into why buyers choose brands.
It supports Lerato’s aim of making LA market oriented, which may reverse three years of flat sales.
Compared with the cost of developing, manufacturing and launching a whole new range, £180 000 may be a small price for reducing the risk of failure.
Arguments against (or for Hamid’s alternative):
£180 000 is almost half of LA’s annual profit, a large opportunity cost for a private limited company with limited funds.
Six months of research delays the launch while rivals continue to win younger buyers; speed to market may matter more.
Secondary data from market analyses and online reviews would cost less than £10 000 and could already show the features buyers value, since the wireless market is well established.
Owen’s view has some merit: in a technical product, customers may not be able to describe innovations they have never experienced, so research may lead to a “me-too” product with no USP.
The owners’ resistance may cause conflict with the new CEO, harming morale among LA’s engineers.
Possible conclusion: a balanced judgement, for example that LA should start with low-cost secondary research to define the market, then use a smaller, targeted round of primary research (such as focus groups only) to test prototypes, combining its engineering strength with customer insight. A judgement for or against the full programme can gain full marks if it is supported.
Limitations of the case that strong answers may note: there is no data on the expected return from the wireless range, the size of the wireless market, LA’s cash position, or how reliable the retailers’ reports are.
Marks should be allocated according to the markbands below.
Additional guidance:
One-sided responses (only for or only against the programme): maximum [5].
Responses with no reference to LA’s situation (e.g. the £180 000 cost, almost half of annual profit, the six-month delay, Hamid’s alternative): maximum [4].
Responses without a conclusion are usually limited to [6].
Markbands (10-mark extended response, Papers 1 and 2)
Marks
Level descriptor
0
The response does not reach the standard described below.
1–2
Little understanding of what the question demands. Business management tools and theories are barely used, or are irrelevant or inaccurate. Little or no reference to the stimulus material. No arguments are made.
3–4
Some understanding of what the question demands. Some use of tools and theories, but mostly inaccurate or not relevant. Use of the stimulus is superficial, often no more than the name of the organisation or person. Arguments are mostly unsubstantiated.
5–6
Understands what the question demands but addresses it only partially. Some relevant, accurate use of tools and theories. Some relevant use of the stimulus beyond names, but it does not effectively support the argument. Arguments are substantiated but mostly one-sided.
7–8
Mostly addresses what the question demands. Mostly relevant, accurate use of tools and theories. The stimulus generally supports the argument, with some lapses in clarity or relevance. Arguments are substantiated and show some balance.
9–10
Clear focus on what the question demands. Relevant, accurate use of tools and theories. Relevant stimulus material is integrated effectively to support the argument. Arguments are substantiated and balanced, and the limitations of the case or stimulus material are explained.
A response with no judgement or conclusion is unlikely to reach the top band of a discuss, evaluate, examine or recommend question.
Question 2 · BM-00236HL only · 12 marks
Marumitsu Foods
Marumitsu Foods (Marumitsu) is a Japanese company that makes rice crackers and seaweed snacks, sold mainly in convenience stores in Japan. Its best-selling product, “Nori Crunch”, contains fish extract and is sold in 120 g packs priced at the equivalent of INR 290.
Marumitsu plans to launch in India in 2027. Market research carried out in Mumbai and Bengaluru found strong interest in Japanese food among young urban consumers, but also concerns about price and ingredients.
Table 1: Results of Marumitsu’s survey of 1 200 consumers aged 18–35 in Mumbai and Bengaluru
Question | Response |
|---|---|
Would try a Japanese snack brand | 64 % |
Follow a vegetarian diet | 38 % |
Prefer spicy or masala flavours in snacks | 57 % |
Usual price paid for a pack of snacks | INR 20–60 |
Buy snacks mostly from small neighbourhood shops (kirana stores) | 71 % |
- (a)
Using Table 1, calculate how many respondents follow a vegetarian diet (show all your working).
2 marks
- (b)
Using Table 1, explain three changes Marumitsu could make to its marketing mix for the Indian market.
6 marks
- (c)
Explain one advantage and one disadvantage for Marumitsu of adapting its products for India rather than selling the same products it sells in Japan.
4 marks
Answer it, then compare with the markscheme.Check this one with a free account
Question 3 · BM-006366 marks
Port Antonio Juice Co. (PAJ) is a small Jamaican business that bottles fresh fruit juices. Until 2024 it bottled whatever fruit its farmers delivered. In 2025 the owner, Marcia Bennett, paid for a survey of 400 shoppers in Kingston and Montego Bay. It found that shoppers wanted less sugar, smaller bottles for lunchboxes and juices that combine Jamaican fruits such as sorrel and soursop. The survey cost JMD 1.2 million, about a quarter of PAJ’s annual profit.
- (a)
Explain two ways in which the survey findings could help PAJ become more market oriented.
4 marks
- (b)
Outline one limitation for PAJ of relying on the survey findings.
2 marks
Answer it, then compare with the markscheme.Check this one with a free account
Flashcards for 4.4
The official deck for this part of the syllabus.
4.4 Market research · front
Define market research.
4.4 Market research · front
State the four broad areas that market research provides information about.
- 4.4 Market research156 cards
Carry on with 4.4 in Augment
With a free account, Augment remembers where you stopped and what you have practiced.