Explain economies and diseconomies of scale, distinguish internal from external growth, and evaluate the reasons to grow or stay small and each method of external growth, from mergers to franchising.
Each is in the Business glossary, with every other term in the subject.
The purchase by one business of a controlling interest (more than 50% of the shares) in another business, which then becomes part of the buyer; friendly when the target's board agrees.
Integration with a business at an earlier stage of production, such as a supplier of raw materials or components, to secure and control supplies.
A government body that investigates mergers, acquisitions and business behaviour, and can block or set conditions on deals that would reduce competition and harm consumers.
A merger or acquisition between businesses in unrelated industries, usually to spread risk across different markets.
Increases in average cost (cost per unit) that occur when a business, or an industry in an area, grows beyond a certain scale of operation.
The reductions in average cost (cost per unit) that a business gains as it increases its scale of operation.
Increases in average cost that a business suffers because its industry has grown too large in an area, for example through congestion or rising land and labour costs.
Describe the main ways of measuring the size of a business.
Explain the internal and external economies of scale that lower a business’s average costs as it grows.
Explain the internal and external diseconomies of scale that raise average costs when a business becomes too large.
Explain the difference between internal (organic) and external (inorganic) growth.
Evaluate the reasons for businesses to grow and the reasons for them to stay small.
Distinguish between horizontal, vertical (backward and forward) and conglomerate integration.
Evaluate mergers and acquisitions, takeovers, joint ventures, strategic alliances and franchising as methods of external growth.
Recommend a suitable method of growth for a business in a given situation.
Most businesses start small and many try to grow. Growth can lower costs, raise profits and make a business more secure, but it also brings new problems of control, communication and finance, and some owners choose to stay small on purpose. Businesses grow for financial, strategic and personal reasons, growth changes their costs, and it can take many forms, from opening new outlets to buying a rival.
Growth is a clear case of the key concept of change. Each method of growth changes who owns and controls the business, and decisions such as closing factories after a takeover or exploiting market power raise questions of ethics. Growth that relies on borrowing or on paying too much for another company may not be sustainable.
134 exam-style questions on this subtopic, written in the style of the IB papers. The first has its markscheme open. Counted on
Kalinda Surf Wax
[1] Kalinda Surf Wax (KSW) is a partnership based in Byron Bay, Australia, owned by Jarrah Collins and Linh Dao. Since 2012 KSW has made surfboard wax from beeswax and coconut oil, sold in recyclable cardboard tins through 60 independent surf shops along the east coast of Australia. KSW’s brand is well known among local surfers, and its wax has won two industry awards for grip in warm water.
[2] For the past three years KSW’s sales volume has hardly changed, at about 180 000 tins a year. Two larger competitors have launched cheaper waxes, and surf-shop owners report that most surfers in the region already buy KSW or a rival brand. Profit is still healthy, but Jarrah worries that the product is close to the end of its maturity stage.
[3] Jarrah wants to extend the product life cycle by selling KSW wax in Indonesia and Portugal, two growing surf markets. This would mean finding distributors abroad, translating the packaging and paying for export shipping. Linh prefers to modify the product: she has developed a “cold-water” formula and a wax for stand-up paddle boards, which could be sold through the existing surf shops. Her version would need AUD 45 000 of new equipment and some retraining of KSW’s six production workers.
[4] The partners have AUD 70 000 of retained profit available and do not want to borrow. Both agree that KSW must not lose its reputation for high quality and natural ingredients.
Define the term product life cycle.
2 marks
Award [1] for a partial definition that shows some understanding, e.g. “the stages a product goes through” with no further detail.
The official deck for this part of the syllabus.
State five measures of the size of a business.
Why do different measures of business size give different answers?
With a free account, Augment remembers where you stopped and what you have practiced.
Reductions in average cost that a business gains from the growth of its industry, often in one location, rather than from its own growth.
Growth achieved by joining with, buying or cooperating with another business, through mergers, acquisitions, takeovers, joint ventures, strategic alliances or franchising; also called inorganic growth.
Reductions in average cost from raising finance more cheaply, such as borrowing at lower interest rates, because lenders see a large business as less risky.
Integration with a business at a later stage of production, closer to the final customer, such as a manufacturer buying a retailer.
An agreement in which a franchisor sells a franchisee the right to trade under its brand name, using its products and business methods, in return for fees and royalties.
A business or person that buys a franchise and runs an outlet under the franchisor's brand, following its rules and paying fees and royalties.
The business that owns a brand and business model and sells franchises, giving franchisees the right to trade under its name in return for fees and royalties.
A merger or acquisition between businesses in the same industry and at the same stage of production, such as two car makers.
Increases in average cost caused by a business's own size, mainly through problems of communication, coordination, control, motivation and bureaucracy.
Reductions in average cost that a business gains from increasing its own scale of operation, such as technical, purchasing, financial, managerial, marketing and risk-bearing economies.
Growth achieved by a business expanding its own operations with its own resources, for example by selling more, launching new products or opening new outlets; also called organic growth.
An agreement between two or more businesses to create and jointly own a new, separate business for a shared project, sharing its costs, risks, control and profits.
A curve showing the lowest average cost of producing each level of output when all inputs, including the scale of operation, can be changed; usually drawn U-shaped.
Reductions in average cost from employing specialist managers, whose expertise improves efficiency and whose salaries are spread over a large output.
The total market value of a publicly held company's shares, found by multiplying the current share price by the number of shares issued.
Reductions in average cost from spreading the fixed costs of advertising, promotion and distribution over a larger volume of sales.
The agreement of two businesses, usually of similar size, to combine into a single new business owned by the shareholders of both.
The lowest level of output at which a business achieves the lowest possible average cost on its long-run average cost curve.
Reductions in average cost from buying inputs in bulk, which allows a large business to negotiate discounts and better credit terms from suppliers.
The ability of a large business to spread risk across many products and markets, so that a loss in one area can be absorbed by the others.
A regular payment made to the owner of a brand, patent or other intellectual property for the right to use it, usually a percentage of sales revenue.
A business whose number of employees, and often its sales revenue or assets, is below limits set by a government; in the European Union, fewer than 250 employees.
The division of work into separate tasks, each carried out by a worker or team that concentrates on it, which raises skill and output per worker.
An agreement between two or more independent businesses to cooperate and share resources to achieve shared objectives, without creating a new business.
The extra value created when two businesses combine, because together they can achieve lower costs or higher revenues than they could separately.
The purchase of a controlling interest in another company; a hostile takeover is one opposed by the target's board, so the buyer offers to buy the shares directly from its shareholders.
Reductions in average cost from using larger, more efficient or more specialised equipment and production methods, which only become worthwhile at high levels of output.
A merger or acquisition between businesses in the same industry but at different stages of production, such as a manufacturer and its supplier or its retailer.
Scope: This subtopic is the same at SL and HL. It covers internal and external economies and diseconomies of scale, the difference between internal and external growth, the reasons to grow and to stay small, and five methods of external growth (mergers and acquisitions, takeovers, joint ventures, strategic alliances and franchising), with evaluation of each.
Before asking why a business grows, it helps to be clear about what “bigger” means. There is no single measure of size. A software company with 300 employees can sell more than a hotel chain with 5,000, and a start-up with no profits can be worth more on the stock market than an old manufacturer. Each measure answers a slightly different question, so managers, investors and governments choose the one that fits their purpose.
Measure | What it shows | Limitation |
|---|---|---|
Number of employees | How large the workforce is; used by governments to define small businesses. | Capital-intensive firms (an oil refinery, a software company) can be very large with few employees. |
Sales revenue | The value of the goods and services sold in a year. | Says nothing about costs or profit; affected by price levels in different industries. |
Market share | The business’s sales as a percentage of total sales in its market. | Depends on how the market is defined; a small firm can lead a small niche. |
Capital employed | The long-term finance invested in the business (non-current liabilities plus equity). | Service businesses may need little capital yet be large in sales and staff. |
Market capitalisation | The total value of a company’s shares on the stock exchange. | Only for publicly held companies; changes daily with the share price. |
Profit | How much the business earns after costs. | A poor measure of size: a large firm can make a loss and a small firm a high profit. |
Market capitalisation is calculated from the share price and the number of shares issued. It applies only to a publicly held company, whose shares are traded on a stock exchange, so it cannot measure a sole trader or most privately held companies.
Most businesses in every country are small. Governments group them as small and medium-sized enterprises (SMEs), usually by number of employees and sometimes also by revenue or assets, so that they can target support such as lower tax rates, grants and simpler reporting rules. The thresholds differ between countries. The European Union, for example, uses the definitions in the table.
EU category | Employees | Sales revenue | or balance sheet total |
|---|---|---|---|
Medium-sized | fewer than 250 | up to €50 million | up to €43 million |
Small | fewer than 50 | up to €10 million | up to €10 million |
Micro | fewer than 10 | up to €2 million | up to €2 million |
Sources: European Commission, “SME definition”, accessed 2026.
When a business increases its scale of operation (its size and capacity, such as the number of factories, outlets or machines), its total costs rise. Its average cost, the cost of producing one unit, can fall. A bakery that doubles its output may need a bigger oven and more flour, but it does not need twice as many managers, twice as many delivery vans or twice as much advertising. The cost of each loaf therefore falls.
Lower average costs give a business a choice. It can keep its price the same and earn a higher profit margin on each unit, or cut its price to win customers from rivals while keeping the same margin. Either way, economies of scale are one of the main reasons why large businesses are hard for new firms to compete with.
Economies of scale come from two sources. Some arise inside the business because of its own size: these are internal economies of scale. Others arise outside it, because the whole industry in an area has grown: these are external economies of scale. The distinction matters because a business controls the first kind but can gain the second only by choosing where to locate.
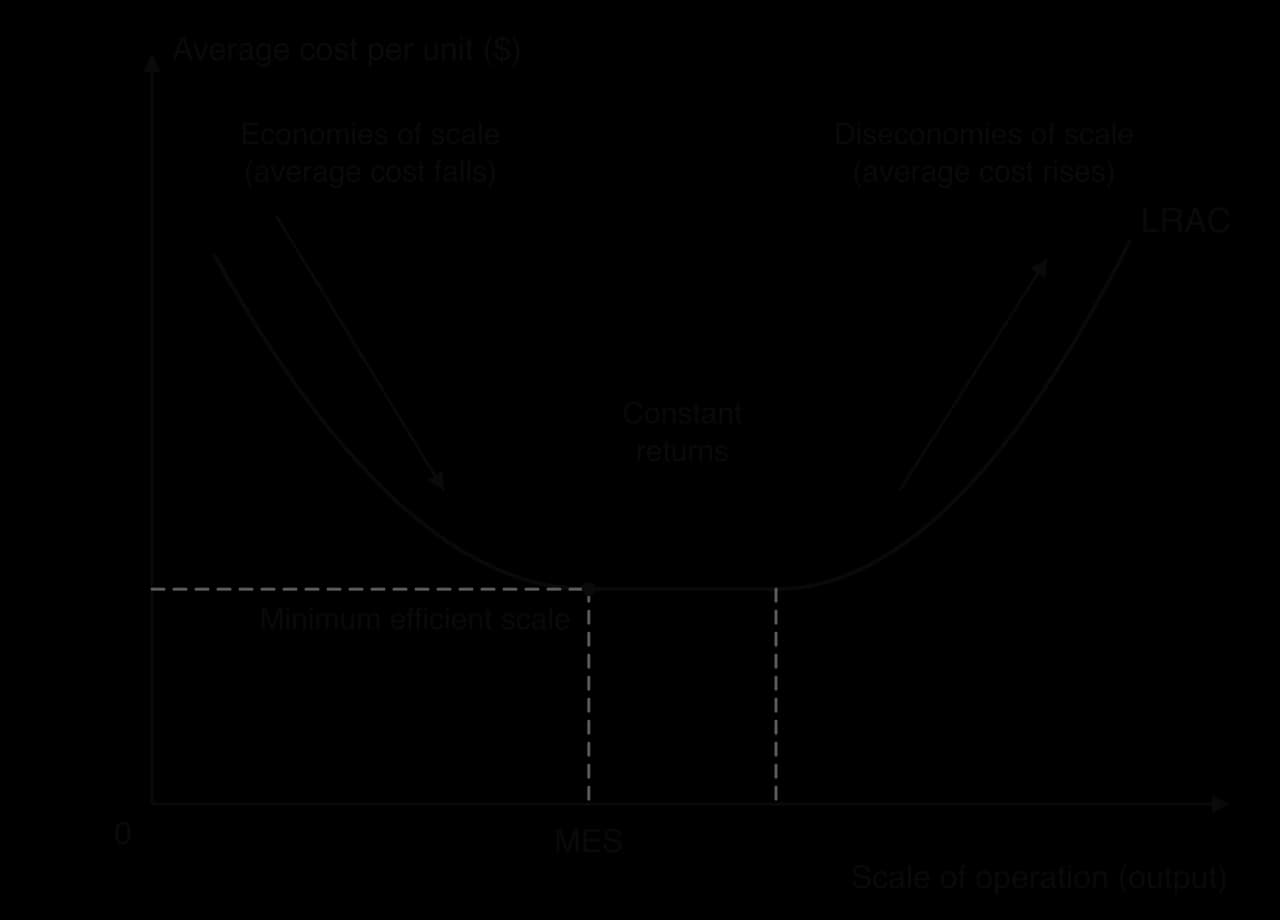
The long-run average cost curve (LRAC) shows the lowest average cost at which a business can produce each level of output when it is free to change all its inputs, including the size of its premises and the number of machines. Economies of scale make the curve fall as scale increases. At very large scales, diseconomies of scale make it rise again, so the curve is often drawn as a U shape or, as in the figure, with a flat section in the middle.
The figure shows three ranges. To the left of the minimum efficient scale, a business that grows lowers its average cost. In the flat range, growth leaves average cost unchanged, so a business gains nothing in cost terms by expanding further. To the right, each increase in scale raises average cost.
The minimum efficient scale is the smallest scale at which average cost reaches its lowest level. It differs widely between industries. In car manufacturing or semiconductor production the minimum efficient scale is very large, which is why those industries have a few huge producers. In hairdressing or accountancy it is small, so many small firms can survive alongside large ones.
Internal economies of scale are usually grouped into seven types. A large business normally gains several at once.
Large businesses can afford specialised, high-capacity machinery and production lines that small businesses cannot use fully. A large machine often costs less per unit of output than several small ones, and its cost is spread over a much bigger output. Container shipping shows the effect clearly: the largest container ships carry many times the cargo of older ships but need crews of a similar size, so the cost of moving each container falls.
Suppliers offer discounts on large orders, because selling in bulk lowers their own costs per unit. A supermarket chain buying for thousands of stores can negotiate much lower prices for each product than an independent shop. Large buyers can also demand better credit terms, such as more time to pay.
Banks see large, established businesses as less risky borrowers because they have more assets to offer as collateral and a longer trading record. They therefore lend to them at lower interest rates. Large companies can also raise share capital by selling shares to the public, a source that sole traders and small private companies cannot use.
A small business owner often handles marketing, accounts, hiring and production alone. A large business can employ specialist managers for each function, such as a finance director, a marketing manager and an HR team. Specialists make better decisions in their area and the cost of each manager is spread over a much larger output.
The cost of a national television campaign or a sponsorship deal is broadly the same whether the business sells one million units or ten million. A large business spreads that cost over more sales, so its marketing cost per unit is lower. It can also promote several products under one well-known brand.
In a large business, work can be divided into small, repeated tasks, each done by a worker trained for it. This specialisation (the division of labour) raises the speed and skill of each worker, so output per worker rises and the labour cost per unit falls. A small business cannot divide work this finely because it has too few staff.
A large business can spread its risks by selling many products in many markets. If one product fails or one market falls into recession, the others continue to earn revenue. This makes its earnings more stable, which lowers its cost of borrowing and allows it to take on risky projects, such as research and development, that a small business could not survive failing.
Type | Source of the cost saving | Example |
|---|---|---|
Technical | Bigger, specialised machinery; fixed costs spread over more output | A car plant with robotic assembly lines |
Purchasing | Bulk-buying discounts and better credit terms | A supermarket chain buying for thousands of stores |
Financial | Cheaper loans; access to share capital | A publicly held company issuing new shares |
Managerial | Specialist managers for each function | A finance director and an HR team |
Marketing | Advertising and distribution costs spread over more sales | A national television campaign for a whole product range |
Specialisation | Division of labour raises output per worker | Workers trained for one stage of production |
Risk-bearing | Many products and markets spread the risk of failure | A food company selling in 100 countries |
External economies of scale arise when an industry grows in one area. Every business in that area benefits, whatever its own size. Over time, a cluster of firms in the same industry attracts specialist suppliers, trained workers, research institutions and good transport links, all of which lower the costs of the firms located there.
A pool of skilled labour. Workers with the right skills move to the area and local colleges train more of them, so firms spend less on recruitment and training. Silicon Valley in California has a large pool of software engineers for this reason.
Specialist suppliers nearby. Suppliers of components and services set up close to their customers, which cuts delivery times and transport costs. The electronics markets and component makers of Shenzhen, China, allow hardware firms to source parts within hours.
Better infrastructure. Governments and private firms invest in roads, ports, power and broadband where an industry is concentrated.
Shared knowledge and research. Universities, research centres and trade associations in the area share ideas and train staff, and workers who move between firms spread new methods.
These advantages explain why industries cluster in an industrial cluster, such as financial services in London, film-making in Mumbai or watchmaking in western Switzerland. A small business can enjoy external economies of scale by locating in such a cluster, even if it never grows.
Growth does not lower average cost forever. Beyond a certain size, a business becomes harder to manage and its average cost starts to rise. These are diseconomies of scale. Like economies of scale, they can be internal (caused by the business’s own size) or external (caused by the growth of the industry in an area).
In a large organisation, messages pass through many layers of the hierarchy and many departments. They are slower to arrive, can be distorted on the way and may be lost among the large volume of emails and reports. Poor communication leads to mistakes, duplicated work and slow decisions, all of which raise costs.
As a business adds products, sites and countries, senior managers find it harder to make sure every part works towards the same objectives. Departments may pursue their own goals, and monitoring performance requires extra layers of managers and systems, which add to costs. After the 1998 merger of Daimler-Benz and Chrysler, the combined company still ran largely separate product lines years later, so few of the cost savings it had promised were achieved.
Workers in a very large organisation can feel like a small part of a machine, far from the people who make decisions and with little sense that their work matters. This alienation reduces motivation, which shows up as lower productivity, more absence and higher labour turnover. Each of these raises the labour cost per unit.
Large organisations rely on rules, forms and procedures to keep control. Too much bureaucracy slows decisions, makes the business less flexible and less responsive to customers, and adds administrative staff whose costs must be covered. A small rival can often react to a change in the market far more quickly.
When too many firms crowd into one location, the advantages of the cluster turn into costs. Roads and ports become congested, so deliveries are slower. Competition for land pushes up rents. Firms compete for the same skilled workers, which drives up wages and makes it harder to keep staff. Office rents in central London and the cost of housing for workers in the San Francisco Bay Area are well-known examples of costs that rise as an industry concentrates.
They depend on the industry. Economies of scale are large where fixed costs are high (car making, airlines, chip manufacturing, streaming platforms) and small in personal services. A small firm in a low-MES industry is not at a cost disadvantage.
Diseconomies can be managed. Decentralising decisions, giving teams more autonomy, using digital communication tools and keeping business units small can delay diseconomies of scale.
Technology is changing the minimum efficient scale. Cloud computing, online advertising and contract manufacturing let small firms rent capacity that once required a large business, which lowers the minimum efficient scale in many industries.
Lower costs are not the only goal. A business may accept higher average costs to offer personal service, higher quality or faster delivery, if customers will pay for them.
Economies of scale matter most when a business competes mainly on price in an industry with high fixed costs. Their size should not be assumed: a business that grows without strong management systems may reach diseconomies of scale sooner than it expects, and the cost advantage it hoped for may never arrive.
 YouTube
A business can grow in two broad ways. It can expand its own operations, using its own resources, or it can join with or buy another business. The first is internal growth and the second is external growth. The choice affects how fast the business grows, how much it costs, how much risk it takes and how much control the owners keep.
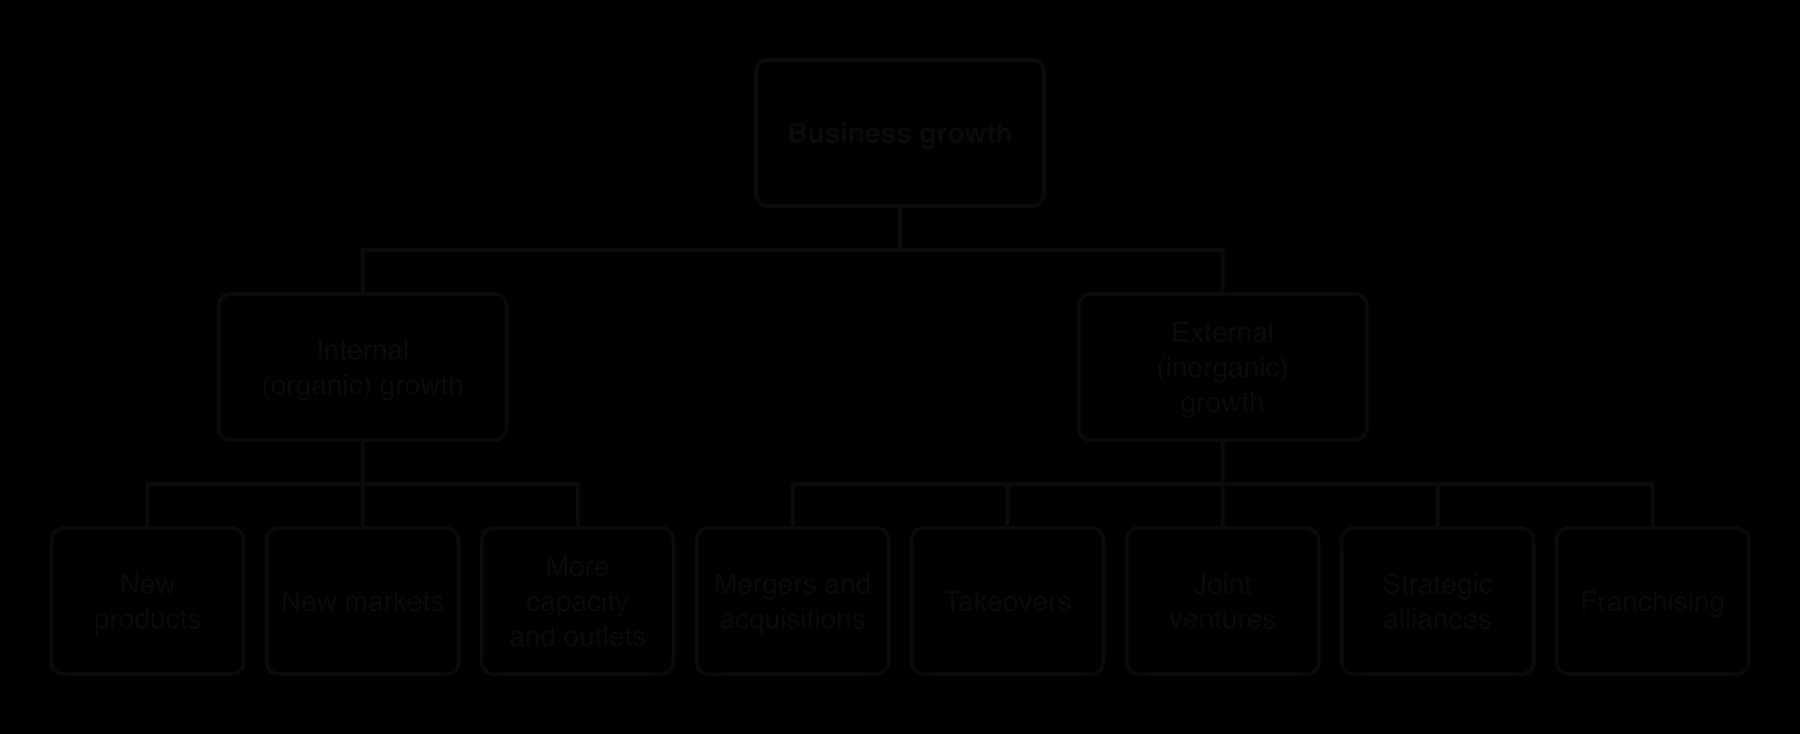
A business can grow internally in several ways:
Selling more of its existing products to existing customers, through promotion, better distribution or lower prices.
Launching new products, developed through its own research and design.
Entering new markets, such as a new region, a new country or a new customer segment, often by selling online.
Increasing capacity, by investing in more machinery, a larger factory or more staff.
Opening new outlets that the business owns and runs itself. Uniqlo, the Japanese clothing retailer, has built its international chain mainly by opening its own stores.
These options correspond to the strategies of the Ansoff matrix, which classifies growth by whether the products and the markets are new or existing.
External growth is much faster. Buying a competitor can double a business’s size overnight, bringing customers, brands, staff, factories and knowledge that would take years to build. It is also more expensive and more risky, because two organisations with different cultures, systems and staff must be combined.
Factor | Internal (organic) growth | External (inorganic) growth |
|---|---|---|
Speed | Slow and gradual | Fast: size, brands and customers are gained at once |
Cost | Spread over time; often financed from retained profit | Large sums at once; often needs loans or new shares |
Risk | Lower: the business grows at a pace it can manage | Higher: overpaying, culture clash, hidden problems in the other business |
Control | The owners keep full control | Shared with partners, or diluted if shares are issued to pay |
Culture | Existing culture and methods continue | Two cultures must be combined; staff may resist |
Knowledge | Builds on what the business already knows | Brings in new skills, technology and market knowledge |
Competition | Rivals remain | Can remove a rival and raise market share |
Internal growth suits a business that wants to keep control, has limited finance or is in a stable market where speed matters less. External growth suits a business that must grow quickly, for example to enter a new market before rivals or to gain a technology it cannot develop itself, and that has the finance and management capacity to integrate another organisation. Many businesses combine both.
Businesses grow for financial reasons, for strategic reasons and sometimes for the personal reasons of their managers. Most growth decisions involve several of these at once.
Economies of scale. Growth lowers average costs, which raises profit margins or allows lower prices.
Higher profits. More sales usually mean more total profit, which rewards owners and provides funds for investment.
Greater market share and market power. A larger share of the market gives a business more influence over prices, more bargaining power with suppliers and retailers, and more protection from competitors.
Survival. Small firms are more likely to fail and easier to take over. A larger business has more resources to survive a recession or a new competitor.
Diversification of risk. Growing into new products or markets spreads risk, so a fall in demand in one area hurts less.
Brand recognition. A larger business is better known, which builds customer trust and makes new products easier to launch.
Managerial motives. Managers may want growth because pay, status and power often rise with the size of the business they run, even when growth does not raise profits for the owners.
The last reason shows that growth objectives can conflict. When a business is run by managers rather than its owners (the divorce of ownership and control in a publicly held company), managers may pursue growth that benefits them more than the shareholders, for example by paying too much for an acquisition.
Growth is not the right objective for every business. Many owners choose to stay small, and in some markets a small business has advantages that a large one lacks.
Niche markets. A small business can serve a niche market that is too small to interest large firms, such as handmade instruments or specialist travel.
Personal service. Customers may value knowing the owner, getting advice and having products made to order. A small firm can offer this more easily.
Cost control. A small business avoids diseconomies of scale: communication is direct, there is little bureaucracy and the owner can watch every cost.
Flexibility. Small firms can change products, prices and methods quickly when the market changes.
The owner’s objectives. Many owners value independence, a manageable workload or a good work–life balance more than maximum profit.
Lack of finance. Growth needs investment. Small firms find it harder and more expensive to borrow and cannot sell shares to the public.
Government support. Many countries give small businesses lower tax rates, grants or simpler regulations, which can be lost when a firm grows past a threshold.
The size of the market. If the market itself is small, such as a village or a narrow product category, there is no room to grow.
The Morgan Motor Company of Malvern, England, founded in 1910, shows a deliberate choice to stay small. In 1990 the business adviser Sir John Harvey-Jones urged the family owners to raise output and clear their long waiting list. Morgan kept its low output, arguing that the waiting list protected it in recessions and kept its cars exclusive. It still makes only several hundred cars a year.
Sources: Morgan Motor Company; The Times, September 2025.
Whether growth is the right choice depends on the business and its situation. The main factors are:
The owners’ objectives. A family business may value control and independence; shareholders of a publicly held company usually expect growth in profits and dividends.
The market. Growth makes sense in a large or growing market with economies of scale; staying small makes sense in a niche where customers value personal service.
Finance. Growth needs funds. A business with weak cash flow that grows too fast risks running out of cash even while its sales rise.
Management capacity. Growth needs managers and systems that can cope with a larger organisation; without them, diseconomies of scale arrive quickly.
Competition. If rivals grow and gain economies of scale, a small firm that competes on price may be forced out, unless it differentiates its product.
Growth brings real benefits in industries where scale lowers costs and where customers buy mainly on price. It is not an objective in itself: a business that grows faster than its finance, management and culture can support may end up weaker than it was. A small business with a clear niche, loyal customers and good profit margins can be more successful than a larger rival.
Mergers and acquisitions (often shortened to M&As) are the most common forms of external growth. In both, two businesses end up under one owner, but they differ in how this happens.
In a merger, the two companies agree that combining is in their shared interest. Stellantis was formed on 16 January 2021 when the French car maker Groupe PSA (Peugeot, Citroën) merged with Fiat Chrysler Automobiles, creating a group with 14 car brands. The partners expected large annual cost savings from sharing vehicle platforms, engines and purchasing.
The buyer in an acquisition is usually larger than the target. The target’s shareholders sell their shares, usually for cash or for shares in the buying company, and the target’s board recommends that they accept. The buyer normally pays a premium above the target’s current share price to persuade shareholders to sell.
Businesses combine in the hope that the combined business will be worth more than the two separately. This extra value is called synergy. It can come from cost savings (one head office instead of two, economies of scale, closing duplicate sites) or from higher revenue (selling each firm’s products to the other’s customers).
Mergers and acquisitions are classified by the relationship between the two businesses. The figure places a chocolate maker in its chain of production and shows the four directions in which it can integrate.

Horizontal integration is the most common type. It increases market share, removes a competitor and gives large economies of scale, because the two businesses do the same things and duplicate costs can be cut. The PSA–Fiat Chrysler merger was horizontal. Because it reduces competition, it is the type most often examined by competition authorities.
Vertical integration can go in two directions along the chain of production, towards suppliers or towards customers.
Backward vertical integration secures supplies, controls their quality and cost, and captures the profit the supplier used to make. Tesla makes many of its own components, including battery packs, rather than buying them all from suppliers.
Forward vertical integration gives a business control over how its products are sold and priced, and direct contact with customers. Tesla also sells its cars through its own showrooms and website rather than through independent dealers. Vertical integration can, however, make a business less flexible: it is tied to its own supplier or outlets even when cheaper or better ones are available.
Conglomerate integration spreads risk across unrelated markets, so a downturn in one industry is balanced by others. India’s Tata Group, founded in 1868, includes businesses in steel, cars, IT services, chemicals and salt, tea, hotels and an airline. Conglomerates gain few economies of scale between their divisions, and managers may lack expertise in industries they do not know.
Sources: Stellantis N.V. and FCA press releases, January 2021; Tata Sons, Annual Report FY2026.
Speed. The buyer gains customers, brands, staff and capacity immediately.
Economies of scale and synergies. Combining operations cuts duplicate costs and raises bargaining power.
Market share and reduced competition. Horizontal deals remove a rival.
Access to new markets. Buying a company in another country brings local knowledge, distribution and brands.
New technology, skills or intellectual property that would take years to develop.
Security of supply or distribution through vertical integration.
Diversification through conglomerate integration.
Overpaying. Buyers often pay a large premium over the target’s market value, based on forecasts of synergies that may not be achieved.
Culture clash. Two organisations with different values, management styles and ways of working may not fit together; staff may resist change and key employees may leave. Differences in organisational culture are among the most common reasons why combinations fail.
Integration costs and diseconomies of scale. Combining IT systems, brands and sites is expensive and slow, and the larger business can suffer communication and coordination problems.
Job losses and stakeholder conflict. Savings often come from closing sites and cutting jobs, which harms employees and local communities and can damage the business’s reputation.
Finance and debt. Large deals are often financed by loans, which raise interest costs and risk, or by issuing shares, which dilutes the ownership of existing shareholders.
Regulatory approval. Competition authorities can block a deal or approve it only with conditions.
Large mergers and acquisitions are reviewed by a competition authority, such as the Competition and Markets Authority (CMA) in the UK, the Federal Trade Commission (FTC) in the USA or the European Commission in the EU. They can block a deal that would reduce competition and harm consumers, or allow it on condition that the businesses sell some operations or make promises about their behaviour.
Mergers and acquisitions give the fastest growth and can transform a business’s position in its market. They carry the highest risks of any growth method: the buyer pays in advance for benefits that depend on successful integration later. The DaimlerChrysler merger shows the danger: valued at about US$38 billion in 1998, it ended in 2007 when Daimler agreed to sell most of Chrysler to the investment firm Cerberus for about US$6 billion.
Whether a merger or acquisition succeeds depends on the price paid compared with the value of the synergies, how similar the two cultures are, how well integration is planned and communicated, how the deal is financed, and whether regulators allow it. Horizontal deals in the same industry usually offer the clearest cost savings; conglomerate deals spread risk but offer few synergies.
Sources: DaimlerChrysler AG; BBC News, May 1998; Daimler AG and Cerberus Capital Management, May and August 2007.
The main forms of inorganic growth, and the reasons why many mergers and takeovers disappoint their buyers, are summarised in a short revision video.
 YouTube
In everyday business language, a takeover is any acquisition. The term is most often used when the buyer gains control without the agreement of the target’s managers. Because the shares of a publicly held company are traded on the stock exchange, a buyer can make an offer directly to the shareholders, and if it buys more than half of the shares it gains control whatever the board thinks.
Only publicly held companies can face a hostile takeover. In a sole trader, a partnership or a privately held company, shares cannot be bought without the owners’ consent, which is one reason why many family businesses stay private. To defend themselves, the boards of target companies can try to persuade shareholders that the offer is too low, look for a friendlier buyer, or point to the risks of the deal.
The US food company Kraft’s takeover of Cadbury, the British chocolate maker, began as a hostile bid. Cadbury’s board rejected Kraft’s first offer of about £10.2 billion in September 2009, saying it undervalued the company. In January 2010 the board agreed to a raised offer of 840 pence per share, valuing Cadbury at about £11.5 billion, financed partly by £7 billion of borrowing. Soon after the deal, Kraft announced the closure of Cadbury’s Somerdale factory near Bristol, which it had earlier suggested might be kept open, with the loss of about 400 jobs.
Sources: Cadbury plc and Kraft Foods announcements, September 2009–February 2010.
For the buyer | For the target and its stakeholders |
|---|---|
Fast growth and market share; a rival removed | Shareholders usually gain from the premium paid for their shares |
Control of brands, factories and staff | Managers may lose their jobs; the business loses independence |
Risk of overpaying in a bidding contest; heavy borrowing | Employees and communities may face closures and job losses |
Hostile deals make integration harder: managers and staff may resist | Decisions move to the buyer’s head office, often in another country |
Hostile takeovers can discipline poorly run companies, because managers who fail to use the business’s assets well risk being replaced. They also raise ethical questions: promises made during a bid may not be kept, and the costs of the deal often fall on employees and communities who had no say in it. A takeover is most likely to succeed when the buyer pays a price it can justify, has a clear plan for integration and keeps the key people it needs.
A joint venture lets two or more businesses work together on one project without merging. The partners create a new business, which they own and control jointly, and share its costs, risks and profits. Each partner remains an independent company.
Joint ventures combine the strengths of the partners. One may bring technology, another local knowledge, distribution or government contacts. They are common in entering foreign markets, where a local partner understands customers, rules and suppliers, and in very costly projects such as oil exploration or aircraft engines, where no single firm wants to carry the whole risk.
Sony Honda Mobility shows both the logic and the risk. Sony and Honda created it as a 50:50 joint venture in October 2022 to make electric cars under the Afeela brand, combining Honda’s experience of building cars with Sony’s strengths in software, entertainment and sensors. In March 2026, after trial production had begun in Ohio, the partners cancelled production of the first model, and in April 2026 they announced a restructuring in which most staff returned to Sony and Honda.
Sources: Sony Group Corporation and Honda Motor Co., October 2022; Reuters and The Verge, March–April 2026.
Advantages | Disadvantages |
|---|---|
Costs and risks are shared between the partners | Profits are shared too |
Each partner gains skills, technology or market knowledge it lacks | Partners may disagree about objectives, investment or strategy |
Faster and cheaper than building the capability alone | Different cultures and management styles can slow decisions |
Partners keep their independence; the venture can be ended | A partner may learn the other’s know-how and become a competitor |
Can meet host-country rules that require local ownership | Control is divided, so neither partner can act alone |
A joint venture suits a project that needs resources from more than one business, has a clear and shared goal and is too risky or costly for one partner alone. It works best when the partners trust each other, agree in advance how decisions and profits will be shared, and plan how the venture will end. When the partners’ objectives drift apart, a joint venture can be harder to manage than full ownership.
A strategic alliance is a looser form of cooperation. The businesses agree to work together on certain activities, such as research, marketing or distribution, but they do not create a new company and remain fully independent.
Star Alliance, formed in 1997 by Air Canada, Lufthansa, Scandinavian Airlines, Thai Airways International and United Airlines, is a well-known example. Its member airlines (around 25) remain separate companies but coordinate timetables, sell seats on each other’s flights (codesharing), share airport lounges and let passengers earn and use frequent-flyer points across the network. Each airline can offer its customers destinations it does not fly to itself.
Sources: Star Alliance, “About us”, accessed 2026.
Joint venture | Strategic alliance | |
|---|---|---|
New business created? | Yes, jointly owned by the partners | No |
Ownership and investment | Partners invest capital in the new business | Partners share resources but keep separate ownership |
Control | Shared through the new business’s board | Each partner keeps control of its own business |
Commitment | Higher; harder to end | Lower; easier to end or change |
Typical use | A major shared project or market entry | Shared marketing, research, distribution or networks |
Strategic alliances are the cheapest and most flexible method of external growth. They give access to a partner’s customers, products or expertise with little investment and can be ended relatively easily. The weaknesses follow from the same looseness: commitment can be weak, the benefits are shared, partners may leave for a rival alliance, and a partner can gain access to sensitive information. An alliance suits businesses that want the benefits of scale or a wider network in a limited area while keeping their independence.
Franchising lets a business grow by allowing other people to open outlets under its name. The owner of the brand sells the right to use its business model, and the buyer invests its own money in opening and running an outlet. Fast food, hotels, convenience stores, gyms and car rental are commonly franchised.
The two parties to the agreement have their own names.
The franchisor provides the brand, the products, the format of the outlet, training, marketing and often the supplies. It sets strict rules on quality and appearance so that every outlet gives the same experience. The franchisee owns and runs the outlet, employs its staff and keeps the profit after paying the franchisor.
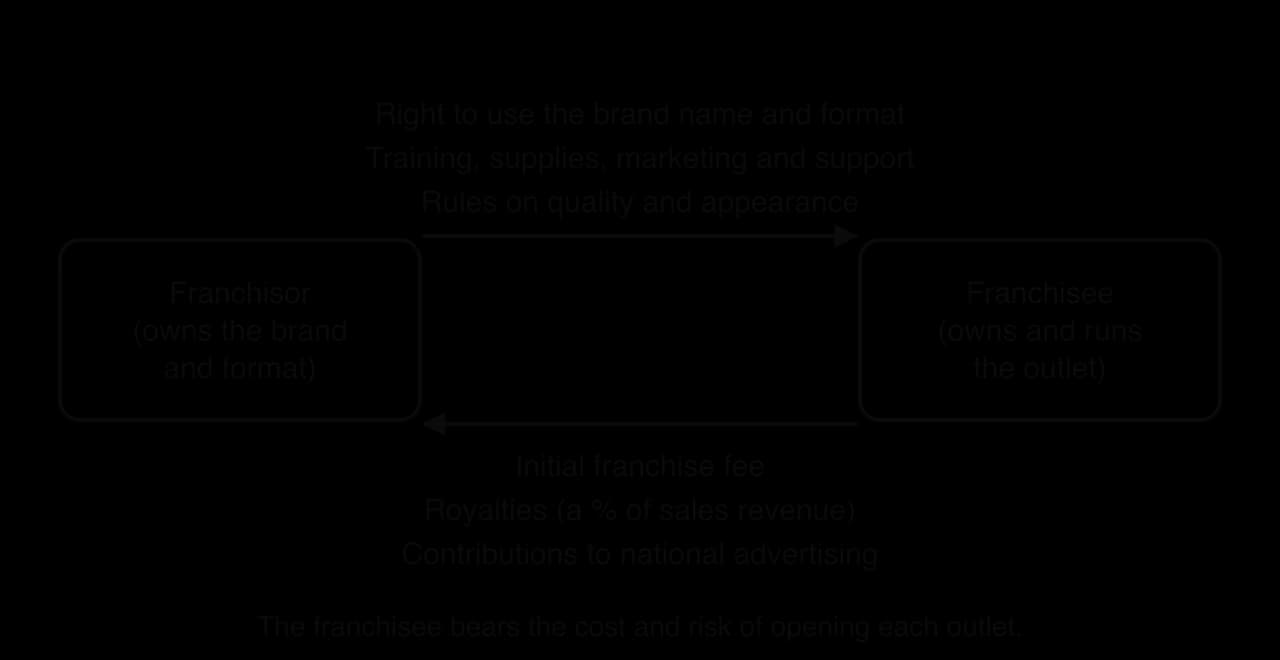
A franchisee usually pays an initial franchise fee to join, followed by a royalty, normally a percentage of its sales revenue, for as long as the agreement lasts. Many franchisees also pay a contribution towards national advertising and must buy supplies from the franchisor or approved suppliers.
McDonald’s shows how far franchising can take a business. At the end of 2025 about 95% of its more than 45,000 restaurants were run by franchisees, who pay McDonald’s rent, royalties and fees. This allowed McDonald’s to expand into more than 100 countries much faster than it could have by financing every restaurant itself.
Sources: McDonald’s Corporation, Annual Report 2025.
Advantages | Disadvantages | |
|---|---|---|
For the franchisor | Rapid growth with little capital, because franchisees pay for outlets; steady royalty income; franchisees are motivated owners; local franchisees know their area | Profits from each outlet are shared; less control over day-to-day operations; one poor franchisee can damage the whole brand; conflict over fees and rules |
For the franchisee | A proven business model and a known brand lower the risk of failure; training, supplies and national advertising are provided; easier to obtain a bank loan | High initial fee and royalties paid even when the outlet makes a loss; little freedom over products, prices or design; the franchisor can refuse to renew the agreement |
Franchising suits businesses with a strong brand and a format that can be copied exactly, such as a restaurant menu or a hotel standard, and that want to grow quickly without raising large amounts of capital. It suits less well businesses whose success depends on unique skills or close control of quality. For franchisees, it offers a safer start than an independent business, at the cost of independence and a share of the revenue.
Each method of growth offers a different balance of speed, cost, risk and control. The table compares them, from internal growth (full control, slow) to strategic alliances (fast and cheap, little control).
Method | Speed | Cost to the business | Risk | Control kept |
|---|---|---|---|---|
Internal growth | Slow | Spread over time | Low to medium | Full |
Merger or acquisition | Fast | Very high | High | Full (acquisition) or shared (merger) |
Hostile takeover | Fast | Very high, often with a premium | Very high | Full, but staff may resist |
Joint venture | Medium | Shared | Shared | Shared |
Strategic alliance | Fast | Low | Low to medium | Each partner keeps its own |
Franchising | Fast | Low for the franchisor | Low for the franchisor; brand risk | Limited over outlets |
The best method depends on the business’s objectives (how fast it needs to grow and how much control it wants), its finances, its size and legal form, the market it wants to enter, and the attitude of regulators. Tools such as SWOT analysis and STEEPLE analysis help managers compare the options. The table links growth to the four key concepts.
Key concept | How it applies to growth |
|---|---|
Change | Growth changes ownership, structure and culture; employees and managers must adapt, and resistance is a common cause of failed integration. |
Creativity | Joint ventures and alliances combine ideas from different businesses; acquisitions can bring in new technology and designs. |
Ethics | Promises to employees and communities in takeovers, job losses after mergers, and the use of market power after horizontal integration raise moral questions. |
Sustainability | Growth financed by heavy borrowing, or that outpaces management capacity, may not last; economies of scale can also make greener technology affordable. |
Microsoft, the US technology company that makes the Xbox console and runs the Game Pass subscription service, agreed on 18 January 2022 to buy Activision Blizzard, the publisher of Call of Duty, World of Warcraft and the mobile game Candy Crush. It offered $95 per share in cash, valuing the deal at $68.7 billion. When the deal was completed, Microsoft recorded a total purchase price of $75.4 billion, making it one of the largest acquisitions in the history of the technology industry.
Microsoft gave several motives. It said the deal would make it the world’s third-largest gaming company by revenue, behind Tencent and Sony. Activision Blizzard had nearly 400 million monthly active players in 190 countries, and its mobile games gave Microsoft a strong position in the largest part of the gaming market. Adding Activision’s games to Game Pass, which then had more than 25 million subscribers, was expected to attract new subscribers. In the terms of growth theory, this was external growth by acquisition: largely horizontal (two game publishers), with a vertical element, because Microsoft also owns the console and subscription platforms through which games reach players.
The acquisition needed approval from competition authorities in many countries, and it took 21 months. In December 2022 the US Federal Trade Commission went to court to block it, arguing that Microsoft could withhold popular games such as Call of Duty from rival consoles and services. The European Commission approved the deal in May 2023 after Microsoft offered to license its games to cloud gaming services.
The UK’s Competition and Markets Authority blocked the original deal in April 2023 because it would strengthen Microsoft’s position in the young market for cloud gaming. Microsoft restructured the deal by selling the cloud-streaming rights to Activision’s games to the French publisher Ubisoft under a 15-year licence, and the CMA approved the new version on 13 October 2023. The acquisition was completed the same day.
Measure | Value |
|---|---|
Offer price per share (January 2022) | $95.00, in cash |
Announced value of the deal | $68.7 billion |
Total purchase price recorded | $75.4 billion |
Of which goodwill | $51.0 billion |
Of which other intangible assets (games, brands, technology) | $22.0 billion |
Time from announcement to completion | 21 months (18 January 2022 to 13 October 2023) |
Gaming jobs cut, January 2024 | about 1,900 of 22,000 |
Sources: Microsoft Corporation, press release, 18 January 2022; Microsoft Annual Report 2024 (Note 8, business combinations); UK Competition and Markets Authority, October 2023; European Commission, May 2023; NBC News and GameSpot, January 2024.
About two-thirds of the price (about $51.0 billion of $75.4 billion) was recorded as goodwill: the amount paid above the value of the identifiable assets, which reflects the synergies and future growth that Microsoft expected. This shows the main risk of an acquisition. The buyer pays in advance, and the payment is justified only if the expected synergies arrive.

The chart shows the immediate effect on size. Microsoft’s gaming revenue rose from $15.5 billion in the year to June 2023 to $21.5 billion in the year to June 2024, an increase of about $6.0 billion or 39%. Microsoft reported that its Xbox content and services revenue grew by 50%, of which 44 percentage points came from the acquisition. Most of this growth was therefore bought, not organic, which is the defining feature of external growth. In FY2025, the second year, gaming revenue grew by about 9% to $23.5 billion.
In January 2024, about three months after completion, Microsoft announced that it would cut about 1,900 of the 22,000 jobs in its gaming division, mainly at Activision Blizzard and Microsoft’s other studios, to reduce areas of overlap. This is the cost-saving side of synergy, and it shows the stakeholder conflict that acquisitions often bring: shareholders gain from lower costs while employees lose their jobs. The FTC used the job cuts in its continuing case, but in May 2025 a US appeals court rejected its challenge and the FTC dropped the case.
The case shows the strengths of acquisition as a growth method (immediate scale, famous brands and a strong position in mobile gaming) and its weaknesses (a very high price, most of it goodwill; nearly two years of regulatory uncertainty; conditions imposed by regulators; and job losses). Its limits as evidence are that revenue measures size, not profit, and that only a few years have passed: whether Microsoft paid too much will depend on profits over the next decade, which the published figures do not yet show.
Sources: Microsoft Corporation, Annual Reports 2024 and 2025; Microsoft press release, January 2022; NBC News, January 2024; The Verge, May 2025.
Explain why Microsoft chose external growth rather than developing its own mobile games.
Analyse why competition authorities in the UK, the EU and the USA reached different decisions on the same acquisition.
To what extent does the increase in gaming revenue show that the acquisition was a success?
Growth questions appear in both Paper 1 and Paper 2. Short questions ask you to define a type of growth or integration, to explain economies or diseconomies of scale in the context of the case, or to distinguish between two methods. Extended questions ask you to evaluate a growth method or to recommend one, using the case throughout.
Short explanation questions reward two distinct points, each developed and applied.
Calculations on economies of scale are usually simple, but always show the formula and comment on the result.
Business size can be measured by employees, sales revenue, market share, capital employed or market capitalisation; each gives a different answer.
Economies of scale lower average cost as scale rises: internal ones (technical, purchasing, financial, managerial, marketing, specialisation, risk-bearing) come from the firm’s own size, external ones from the growth of its industry in an area.
Diseconomies of scale raise average cost: internally through communication, coordination, motivation and bureaucracy problems, externally through congestion and rising land and labour costs.
Internal (organic) growth is slower, cheaper and lower-risk and keeps control; external (inorganic) growth is faster but costlier, riskier and harder to integrate.
Businesses grow for lower costs, profit, market power, survival, diversification, brand recognition and managers’ ambitions; many stay small for niches, personal service, flexibility, control and the owners’ objectives.
Integration can be horizontal, vertical (backward or forward) or conglomerate.
Mergers, acquisitions and takeovers give fast growth at high cost and risk; joint ventures and strategic alliances share resources with partners; franchising gives rapid growth with little capital but less control.
The best method depends on objectives, finance, control, the market, culture and regulators.
I can describe five measures of business size and explain why they can disagree.
I can explain the seven internal economies of scale and give an example of each.
I can explain external economies and diseconomies of scale and how they differ from internal ones.
I can draw and label the long-run average cost curve, including the minimum efficient scale.
I can explain the difference between internal and external growth.
I can evaluate the reasons for a business to grow or to stay small in a given case.
I can distinguish horizontal, backward vertical, forward vertical and conglomerate integration.
I can evaluate mergers, acquisitions, takeovers, joint ventures, strategic alliances and franchising.
I can recommend a method of growth for a business and justify it with the case.
Award [0] for a tautological answer that only repeats the term.
Candidates are not expected to word their definition exactly as above.
Explain two pieces of evidence that KSW’s surf wax is in the maturity stage of its product life cycle (paragraph 2).
4 marks
Evidence may include:
Sales have levelled off: sales volume has been roughly constant at about 180 000 tins a year for three years, so growth has stopped.
Market saturation: surf-shop owners report that most surfers already buy KSW or a rival, so there are few new customers left to win.
Increased competition: two larger rivals have entered with cheaper waxes, typical of a mature market where firms compete on price.
Healthy profit: profit remains high because development costs have been recovered, which is typical of maturity (the product is a likely cash cow).
Accept any other relevant evidence from the case.
Mark as 2 + 2. For each piece of evidence, award [1] for identifying it from the case and [1] for explaining why it indicates maturity.
Award a maximum of [2] for a description of the maturity stage that makes no use of KSW’s case.
Discuss whether KSW should extend the life of its product by entering new markets abroad (Jarrah’s option) or by modifying the product (Linh’s option).
10 marks
Jarrah’s option: new markets in Indonesia and Portugal
For: Indonesia and Portugal are growing surf markets, so KSW could move into a market where the product is at an earlier stage of its life cycle and sales can grow again; the existing product, process and brand are used, so no new production equipment is needed; geographical diversification spreads risk away from the saturated east-coast market.
Against: KSW has no experience abroad and must find reliable distributors; translating packaging and export shipping raise costs and may absorb much of the AUD 70 000; it is a small partnership, so managing at a distance is difficult; established local and global brands may compete strongly; the award-winning warm-water grip suits Indonesia but may suit Portugal’s colder water less well.
Linh’s option: product modification (cold-water and paddle-board waxes)
For: it uses KSW’s existing distribution through 60 surf shops and its strong local brand (brand extension), so launch costs are lower; the AUD 45 000 is within the AUD 70 000 available, so no borrowing is needed; it adds new reasons for existing customers to buy (winter surfing, paddle boarding) and widens the product portfolio.
Against: it still targets the same saturated regional market, and new variants may cannibalize sales of the original wax; the equipment and retraining of six workers carry risk and could disrupt production; demand for cold-water wax in a warm-water region may be limited; quality must be maintained to protect the brand.
Other points: Ansoff (market development vs product development, both riskier than penetration); the two strategies are not mutually exclusive in the longer term; both must protect the reputation for natural ingredients.
Possible conclusion: for example, Linh’s option may be preferred because it is cheaper, lower-risk and within KSW’s funds; or Jarrah’s option may be preferred because only new markets offer real growth. Any well-supported judgement can earn full marks.
Limitations that strong answers may note: there is no market research on demand in Indonesia or Portugal or for the new formulas; the costs of exporting are not given; no data on competitors’ prices or KSW’s margins.
Marks should be allocated according to the markbands below.
Additional guidance:
If only one option is discussed, even with balance, award a maximum of [5]; one option, one-sided, a maximum of [3].
A response that makes no use of the data or case details the question refers to cannot be awarded more than [4].
A response with no conclusion or judgement will typically not be awarded more than [6].
Markbands (10-mark extended response, Papers 1 and 2)
Marks | Level descriptor |
|---|---|
0 | The response does not reach the standard described below. |
1–2 | Little understanding of what the question demands. Business management tools and theories are barely used, or are irrelevant or inaccurate. Little or no reference to the stimulus material. No arguments are made. |
3–4 | Some understanding of what the question demands. Some use of tools and theories, but mostly inaccurate or not relevant. Use of the stimulus is superficial, often no more than the name of the organisation or person. Arguments are mostly unsubstantiated. |
5–6 | Understands what the question demands but addresses it only partially. Some relevant, accurate use of tools and theories. Some relevant use of the stimulus beyond names, but it does not effectively support the argument. Arguments are substantiated but mostly one-sided. |
7–8 | Mostly addresses what the question demands. Mostly relevant, accurate use of tools and theories. The stimulus generally supports the argument, with some lapses in clarity or relevance. Arguments are substantiated and show some balance. |
9–10 | Clear focus on what the question demands. Relevant, accurate use of tools and theories. Relevant stimulus material is integrated effectively to support the argument. Arguments are substantiated and balanced, and the limitations of the case or stimulus material are explained. |
A response with no judgement or conclusion is unlikely to reach the top band of a discuss, evaluate, examine or recommend question.
Kestrel E-Bikes
[1] Kestrel E-Bikes (Kestrel) is a private limited company based in Utrecht, the Netherlands. It was founded in 2016 by Daan Visser and Femke de Groot, two engineers who designed a lightweight electric cargo bike for parents carrying children around the city. Kestrel assembles 9 000 bikes a year in a small factory and sells them online and through 40 independent bicycle shops in the Netherlands and Belgium.
[2] Demand has grown quickly. Kestrel’s order book is full for the next seven months and some customers have cancelled their orders because of the waiting time. Kestrel buys its battery packs in small quantities from a supplier in Germany and pays a higher price per pack than its larger rivals. Daan believes that Kestrel’s average costs are too high for it to compete on price as the market becomes more crowded.
[3] Daan and Femke have set a strategic objective of selling 30 000 bikes a year within four years. They are considering two ways of growing:
[4] Option 1: build a second, larger assembly line next to the existing factory and recruit 60 more workers. This would be financed by a bank loan and retained profit, and would take about two years to complete.
[5] Option 2: acquire Velomaas, a struggling family-owned bicycle maker in Rotterdam. Velomaas has a modern factory that is only half used, an experienced workforce of 85 people and a network of 120 retailers in Germany and France. Velomaas makes traditional bicycles, has had three different managing directors in five years, and its workers fear that Kestrel would close their factory.
[6] Femke is worried that rapid growth could change Kestrel’s informal, close-knit way of working, where every employee knows the founders personally and suggests design improvements.
Define the term economies of scale.
2 marks
With reference to Kestrel, explain two internal economies of scale that Kestrel could gain by producing 30 000 bikes a year.
4 marks
Explain two diseconomies of scale that Kestrel might face as it grows (paragraphs 5 and 6).
4 marks
Discuss whether Kestrel should choose Option 1 (internal growth) or Option 2 (acquiring Velomaas) to achieve its strategic objective.
10 marks
Hollis Brickworks
Hollis Brickworks (Hollis) is a public limited company that makes clay bricks at a single site in Leicestershire, England. Its kilns run 24 hours a day. Over the past ten years Hollis has expanded the site three times, adding larger kilns and automated cutting machines. Table 1 shows the company’s estimated annual total costs at different levels of output.
Hollis currently produces 40 million bricks a year. A national house builder has offered Hollis a five-year contract that would raise annual output to 50 million bricks. To meet it, Hollis would have to run older back-up kilns, hire agency staff for night shifts and add a fourth layer of supervisors.
Table 1: Estimated annual total costs of Hollis at different levels of output
Output (million bricks) | 10 | 20 | 30 | 40 | 50 |
|---|---|---|---|---|---|
Total costs (£000) | 3 000 | 5 200 | 7 200 | 9 200 | 12 500 |
Average cost per brick (£) | 0.30 | 0.24 | 0.23 |
Using Table 1, calculate the average cost per brick at an output of 20 million bricks and of 50 million bricks (show all your working).
2 marks
State the level of output at which Hollis’s average cost is lowest.
1 mark
With reference to Hollis, explain two internal economies of scale that could explain the fall in average cost as output rises from 10 million to 40 million bricks.
4 marks
Using Table 1 and the information in paragraph 2, explain why Hollis’s average cost rises if output increases to 50 million bricks.
3 marks