
Calculate the payback period, average rate of return and (HL) net present value of investment projects, and combine the results with qualitative factors to evaluate and recommend between them.
Each is in the Business glossary, with every other term in the subject.
The average annual profit of an investment, after deducting its initial cost, expressed as a percentage of the initial cost: ((total returns − capital cost) ÷ years of use) ÷ capital cost × 100.
The running total of a project's net cash flows from year 0 onwards, showing at each point how much of the initial cost has been repaid.
The number by which a future cash flow is multiplied to find its present value, which depends on the discount rate and the number of years until the cash flow arrives.
The process of converting future cash flows into their present values, by reducing them to allow for the time value of money.
Spending on capital assets, such as machinery, buildings or technology, now in the expectation of earning returns over several years in the future.
The use of quantitative techniques to assess whether an investment project is financially worthwhile, by comparing its expected returns with its cost, and to compare competing projects.
The sum of the present values of an investment's future net cash flows minus its initial cost; a positive value means the project earns more than the discount rate.
Define investment, investment appraisal and opportunity cost.
Calculate the payback period of a project from its forecast net cash flows.
Calculate the average rate of return (ARR) of a project.
Calculate the net present value (NPV) of a project using discount factors (HL).
Evaluate the payback period, the average rate of return and (HL) net present value as methods of investment appraisal.
Explain the qualitative factors that affect investment decisions.
Recommend an investment between competing projects using quantitative results and qualitative factors.
Investment appraisal is the use of quantitative methods to judge whether a planned investment, such as a new machine, a new factory or a new product, is worth its cost, and to compare competing projects. Investment decisions commit large sums of money for many years and are hard to reverse, so a poor choice can weaken a business for a long time; the Danish energy company Ørsted, for example, cancelled two large wind farms off New Jersey in 2023 after rising costs and interest rates sharply reduced their expected returns.
Investment links to all four key concepts. Businesses invest to respond to change in technology, demand and regulation; new products and processes come from creativity; the forecasts behind an investment involve judgment that raises questions of ethics when managers present them to lenders or shareholders; and many of today's largest investments, in renewable energy, electric vehicles or recycling, are made in the name of sustainability.
81 exam-style questions on this subtopic, written in the style of the IB papers. The first has its markscheme open. Counted on
Sunbird Laundromats is a chain of nine self-service laundries in Durban, South Africa, owned by Thandiwe Mkhize. Electricity is Sunbird’s largest cost after rent, and power cuts force the laundries to close for several hours a week. Thandiwe plans to install solar panels and batteries at all nine sites for R1 200 000. She expects electricity savings of R320 000 a year, and the panels have a life of 15 years.
Calculate the payback period for the solar panels (show all your working).
2 marks
The official deck for this part of the syllabus.
Define investment.
Give three examples of assets a business might buy as an investment.
With a free account, Augment remembers where you stopped and what you have practiced.
The value of the next best alternative given up when a choice is made.
The length of time it takes for the net cash flows from an investment to repay its initial cost.
The value today of a sum of money to be received in the future, found by discounting it at a chosen interest rate.
The principle that a sum of money is worth more now than the same sum in the future, because money available now can earn interest or a return in the meantime.
Scope: Investment appraisal is part of the finance unit at SL and HL. Both levels calculate and evaluate the payback period and the average rate of return and weigh them against qualitative factors to recommend an investment. HL also calculates and evaluates net present value, using the discount factors provided.
In business, an investment is the purchase of assets that will be used for several years, such as machinery, vehicles, buildings, technology or a new product line, in the expectation of earning returns in the future. It is a form of capital expenditure: the money is spent now, and the benefits arrive over the years that follow, as extra revenue, lower costs or both.
Businesses invest for many reasons: to replace worn-out or out-of-date equipment, to increase capacity when demand grows, to cut costs through automation, to launch new products, to enter new markets, or to meet new legal or environmental standards. Each reason produces a project whose costs and returns can be estimated.
Appraisal matters for four reasons. Investments usually involve large amounts of money compared with the size of the business. Their returns come over many years, so they depend on forecasts that may be wrong. They are often difficult to reverse: a specialised machine or a factory may be hard to sell for anything near its cost. Finally, money spent on one project cannot be spent on another, so every investment has an opportunity cost.
For an investment, the opportunity cost is the return the business could have earned on the best alternative use of the money: another project, repaying a loan, or simply keeping the cash in a bank account and earning interest. A project is worth doing only if it will earn more than this alternative, and the methods of investment appraisal are ways of measuring whether it does.
Every method starts from the same data: the initial cost of the project and a forecast of its net cash flow in each year of its life, meaning the cash the project brings in during the year minus the cash it costs to run in that year. The initial cost is shown in year 0 (the start of the project, "now") as a negative figure. Any residual value, the amount for which the asset can be sold at the end of its life, is added to the net cash flow of the final year.
Estimating the net cash flows is the hardest part of appraisal. The inflows include the extra sales revenue the project brings, any costs it saves (such as lower wages or energy bills after automation) and the residual value at the end. The outflows include the extra running costs: materials, staff, maintenance, insurance, energy and training. Only the cash flows that change because of the project are included; costs the business would pay anyway, such as the rent of its head office, are left out.
Solano Juice Co, a juice producer (hypothetical data), has $400,000 to invest and is considering two projects with an expected life of five years. Project A is an automated bottling line, which cuts labour costs from the first year. Project B is a network of juice kiosks in railway stations, which will take time to become known and so brings in most of its cash in later years. The table gives the forecast net cash flows of each project.
Year | Project A: bottling line, net cash flow ($) | Project B: kiosks, net cash flow ($) |
|---|---|---|
0 | (400,000) | (400,000) |
1 | 120,000 | 50,000 |
2 | 130,000 | 80,000 |
3 | 140,000 | 120,000 |
4 | 100,000 | 160,000 |
5 | 80,000 | 200,000 |
Total net cash flow (years 1–5) | 570,000 | 610,000 |
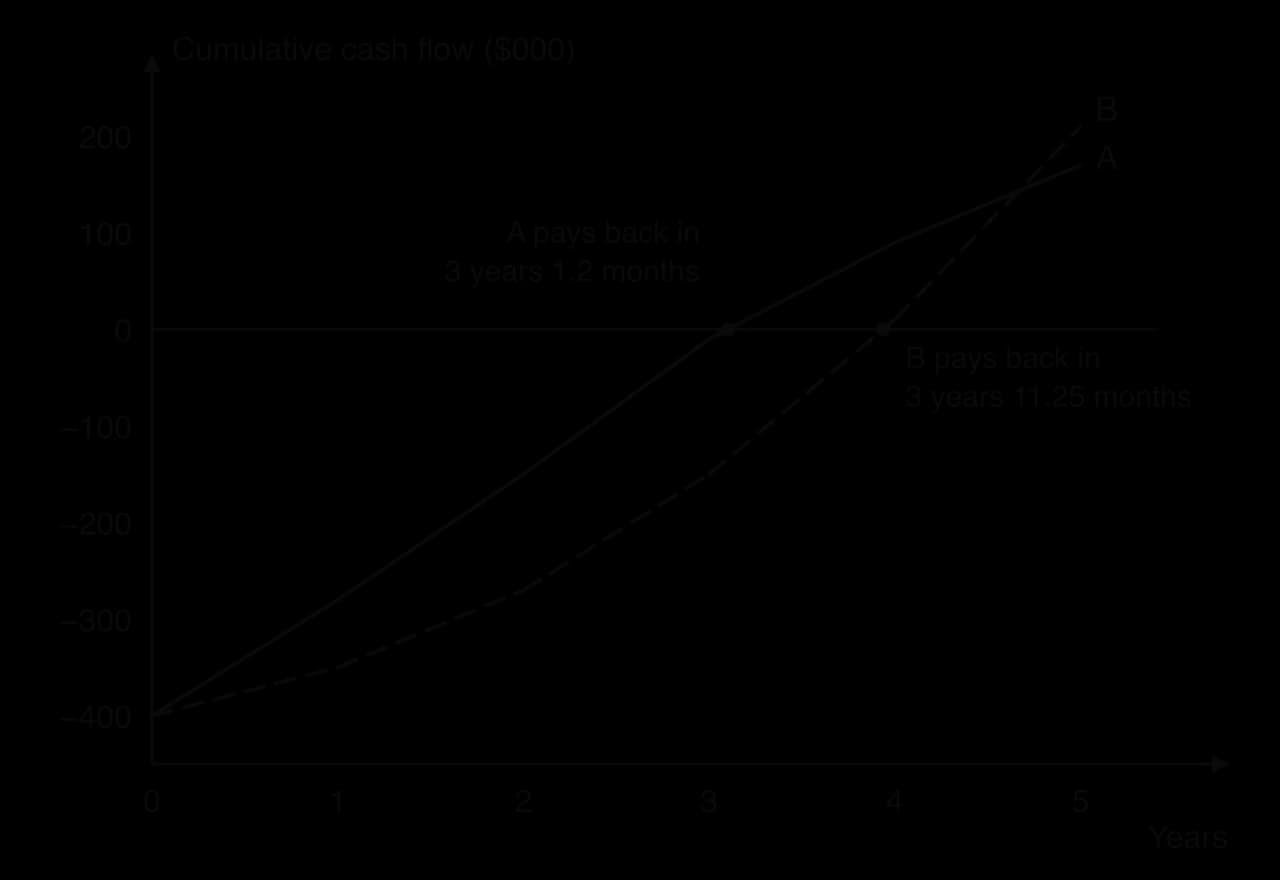
The payback period is the length of time a project takes to repay its initial cost from its net cash flows. A business that is short of cash, or that operates in a fast-changing market, wants its money back quickly, so it prefers a shorter payback period. Many businesses set a maximum acceptable payback period, for example three years, and reject projects that take longer.
The payback period is found from the cumulative cash flow, the running total of the project's net cash flows, starting from the negative initial cost in year 0. The cumulative figure becomes less negative each year as cash comes in, and payback happens at the point where it reaches zero.
Payback rarely happens exactly at the end of a year. When it happens during a year, the number of months into that year is found by assuming that the year's net cash flow arrives evenly, at the same rate each month. The cash still needed at the start of the year (the income needed to complete payback) is divided by the net cash flow per month of that year (its contribution per month).
The same result can be written as (income needed ÷ net cash flow in that year) × 12, which is quicker to calculate.
The graph shows the same calculation. Each year's net cash flow raises the line, a steeper section means a larger cash flow, and the payback period is the point where the line crosses the horizontal axis. Everything to the right of the crossing point is cash earned after the cost has been repaid.
Project B can be appraised in the same way. Its cumulative cash flow is −$350,000 after year 1, −$270,000 after year 2 and −$150,000 after year 3, and becomes +$10,000 after year 4. Payback happens during year 4: the income needed is $150,000 and year 4 brings in $160,000.
Project B therefore has a payback period of 3 years and 11.25 months, almost a year longer than Project A, because its largest cash flows come late in its life.
 YouTube
Advantages | Limitations |
|---|---|
Simple and quick to calculate and easy for managers and lenders to understand. | Ignores all cash flows after the payback point, so a project with large later returns, such as Project B, can look worse than it is. |
Shows how quickly the money comes back, which matters when cash is short or the business has borrowed to invest. | Does not measure profitability: two projects with the same payback period can earn very different total returns. |
Earlier cash flows are easier to forecast, so a short payback carries less risk. | Ignores the timing of cash flows within the payback period, and the fact that money received later is worth less than money received now. |
Suits fast-changing markets, where products and technology may be out of date within a few years. | The maximum acceptable payback period is a matter of judgment and can lead to good long-term projects being rejected. |
The payback period is most useful for businesses with a weak liquidity position, for small firms that need to recover their money quickly, and for projects in markets where demand or technology changes rapidly, such as consumer electronics or fashion. It is least useful for long-lived projects such as buildings, power stations or new medicines, whose main returns come late. Because it measures speed rather than profitability, it is normally used alongside another method.
The average rate of return (ARR) measures the average yearly profit of a project as a percentage of its initial cost. Where the payback period asks how quickly the money comes back, the ARR asks how profitable the project is over its whole life. It is calculated in three stages: the total net return over the project's life (total returns minus the capital cost), the average return per year, and that average as a percentage of the capital cost.
In the formula, total returns are the sum of the project's net cash flows over its life (including any residual value), capital cost is the initial cost, and years of use is the life of the project. Total returns minus capital cost is the profit the project earns over its whole life; dividing by the years of use gives the average profit per year.
An ARR is judged against a benchmark. The business may compare it with the interest it would pay on a loan to finance the project, or with the interest it could earn by saving the money instead (the opportunity cost); with a target ARR set by its managers; with the ARR of other projects; or with the return it earns on its existing assets. If Solano Juice Co could borrow at 7%, both projects earn more than the cost of borrowing; if its target is 10%, only Project B is acceptable.
Advantages | Limitations |
|---|---|
Uses all the cash flows over the whole life of the project, unlike the payback period. | Ignores the timing of the cash flows: a return in year 5 counts the same as a return in year 1, although it is riskier and worth less. |
Measures profitability as a percentage, so it can be compared directly with interest rates, a target return or other projects. | Treats returns as if they were spread evenly, which they rarely are. |
Easy to understand and familiar to managers and investors. | Depends on forecasts of cash flows several years ahead, which become less reliable the further into the future they go. |
Can be compared with the business's cost of finance to see whether a project covers it. | Says nothing about how long the money is tied up, so it can favour a project that leaves the business short of cash for years. |
The ARR is most useful when projects of similar length are compared and when the business is more concerned with long-term profitability than with how quickly its cash comes back. Its main weakness, that it ignores the timing of returns, is the issue that net present value addresses.
The ARR looks similar to return on capital employed (ROCE), and both express a profit as a percentage of the money invested. The difference is in scope: ROCE measures the return on all the capital of the whole business in one year, from its published accounts, while ARR measures the expected average return of a single project over its life, from forecasts. A business might accept a project only if its ARR is higher than its current ROCE, so that the investment raises the business's overall return.
When the two methods give the same answer, the decision is straightforward. Often they do not, because they measure different things. Solano Juice Co's projects show the conflict clearly: Project A pays back faster, while Project B earns a higher average return.
Method | Project A (bottling line) | Project B (kiosks) | Better project |
|---|---|---|---|
Payback period | 3 years 1.2 months | 3 years 11.25 months | A |
Average rate of return | 8.50% | 10.50% | B |
The choice depends on what the business values most. A business with little cash, high borrowing or an uncertain market would favour Project A, because it recovers its money sooner and its returns depend less on forecasts four or five years ahead. A business with strong liquidity and a long-term focus would favour Project B, because it is more profitable over its life. Project B's returns are also riskier: kiosks depend on footfall in stations and on customers learning about the brand, while savings from automation are more predictable.
Neither the payback period nor the ARR allows for the fact that money received in the future is worth less than the same amount received today. This idea is the time value of money. A dollar today is worth more than a dollar in five years for three reasons: a dollar today could be saved or invested and would grow with interest in the meantime; inflation reduces what a future dollar will buy; and a promised future dollar might never arrive, so it carries risk.
If money in a bank earns 10% a year, $909.10 saved today grows to $1,000 in one year ($909.10 × 1.10 = $1,000). So $1,000 received in one year has the same value as $909.10 today. That value today is the present value of the future sum, and the process of converting a future sum into its present value is called discounting.
Discounting therefore runs compound interest in reverse: instead of asking what money saved today will grow to, it asks what a future sum is worth today.
The rate used is the discount rate. A business usually chooses one based on the interest it would pay to borrow the money, the return it could earn elsewhere (the opportunity cost), or a target return that also allows for risk. Discounting is done by multiplying each future cash flow by a discount factor for the chosen rate and the year in which the cash flow arrives. The factors come from a discount table, so no compound interest has to be calculated.
Each factor is the present value of $1 received at the end of a given year. At a rate r (as a decimal), $1 in n years is worth 1 ÷ (1 + r)ⁿ today. At 10%, the factor for year 1 is 1 ÷ 1.10 = 0.9091 and for year 2 it is 1 ÷ 1.10² = 0.8264, the figures in the table rounded to four decimal places.
The formula is not needed for calculations, because the factors are given, but it explains why the factors fall faster at high rates and for distant years.
The discount table gives the factors for common rates. Each factor is less than 1, and the factors get smaller the further into the future the cash flow arrives and the higher the discount rate.
Years | 4% | 6% | 8% | 10% | 20% |
|---|---|---|---|---|---|
1 | 0.9615 | 0.9434 | 0.9259 | 0.9091 | 0.8333 |
2 | 0.9246 | 0.8900 | 0.8573 | 0.8264 | 0.6944 |
3 | 0.8890 | 0.8396 | 0.7938 | 0.7513 | 0.5787 |
4 | 0.8548 | 0.7921 | 0.7350 | 0.6830 | 0.4823 |
5 | 0.8219 | 0.7473 | 0.6806 | 0.6209 | 0.4019 |
6 | 0.7903 | 0.7050 | 0.6302 | 0.5645 | 0.3349 |
7 | 0.7599 | 0.6651 | 0.5835 | 0.5132 | 0.2791 |
8 | 0.7307 | 0.6271 | 0.5403 | 0.4665 | 0.2326 |
9 | 0.7026 | 0.5919 | 0.5002 | 0.4241 | 0.1938 |
10 | 0.6756 | 0.5584 | 0.4632 | 0.3855 | 0.1615 |
The factor 0.6209 for year 5 at 10%, for example, means that $1,000 received in five years is worth $620.90 today. The chart shows how the present value of the same $1,000 falls the later it arrives.

Net present value (NPV) brings these ideas together. Each year's net cash flow is discounted to its present value, the present values are added, and the initial cost is subtracted. The initial cost is paid now, in year 0, so it is not discounted.
The result is interpreted by its sign. A positive NPV means the project earns more than the discount rate: after allowing for the time value of money, it is worth more than it costs, so it adds value to the business. A negative NPV means the project earns less than the discount rate, so the money would be better used elsewhere (for example, saved at that rate). When projects compete for the same funds, the one with the higher NPV adds more value.
Discounting changes the comparison between the two projects. Project B's cash flows are larger in total, but most of them arrive in years 4 and 5, when the discount factors are smallest, so they lose more of their value when discounted.
A higher discount rate gives smaller discount factors, so it reduces the present value of every future cash flow and lowers the NPV. Cash flows far in the future are hit hardest. A rise in interest rates, which raises the rate a business uses, can therefore turn a project with a positive NPV into one with a negative NPV, even if nothing else about it has changed.
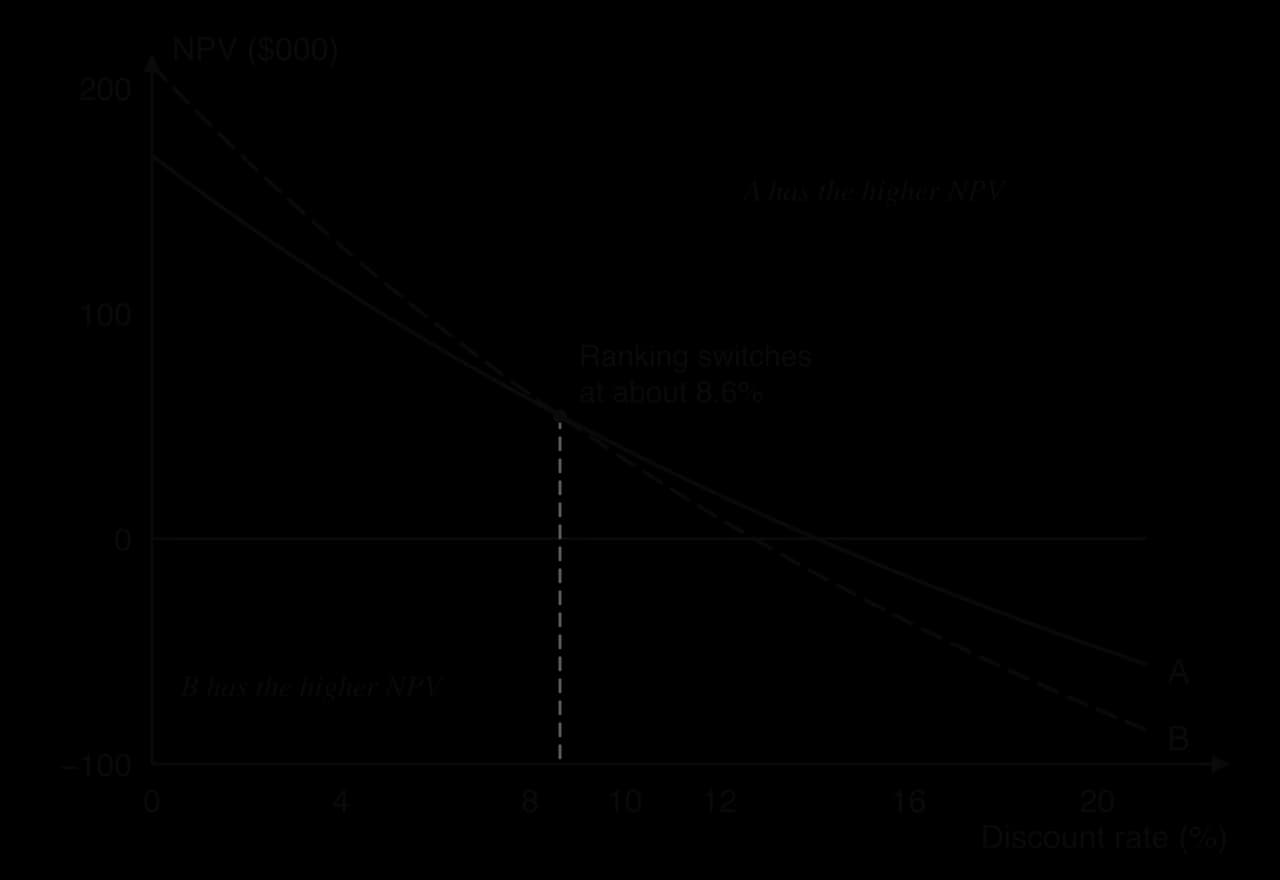
Solano Juice Co's projects show the effect. At 8%, Project B's NPV ($63,855) is higher than Project A's ($61,637); at 10%, Project A is ahead; at 20%, both NPVs are negative (A −$48,332, B −$75,791), so neither project would be worth doing. Projects with long lives and late returns, such as power stations, infrastructure and new technologies, are especially sensitive to the discount rate.
 YouTube
Advantages | Limitations |
|---|---|
Takes the time value of money into account, so it allows for when each cash flow arrives. | More complex to calculate and to explain to non-financial managers than payback or ARR. |
Uses all the cash flows over the life of the project. | The result depends on the discount rate, which is a matter of judgment and may change, as it did when interest rates rose from 2022. |
Gives a clear decision rule: a positive NPV adds value, a negative NPV does not. | Like every method, it depends on forecasts of cash flows several years ahead. |
The discount rate can be raised to allow for risk, giving riskier projects a tougher test. | NPV is an amount in dollars, so it does not show the return relative to the size of the investment; a large project can have a larger NPV than a small one that earns a higher rate. |
NPV is generally regarded as the most complete of the three methods, because it uses all the cash flows and allows for their timing. It is widely used for large, long-lived projects, often with several discount rates to show how sensitive the result is. Its precision can be misleading, though: an NPV calculated to the dollar is only as reliable as the forecasts and the discount rate behind it. In practice, businesses use NPV together with the payback period, which shows liquidity risk, and with qualitative factors.
The results of investment appraisal are one input into an investment decision rather than the decision itself. Every result rests on forecasts and assumptions, and many of the most important consequences of an investment cannot be measured in cash flows. Managers therefore weigh the quantitative results against qualitative factors.
The forecast net cash flows are estimates of future sales, prices and costs, and they become less reliable the further ahead they go. A project whose returns depend on a new product being popular is riskier than one that cuts known costs. Large projects are also exposed to delays and cost overruns.
In January 2024 EDF raised its estimate of the cost of the Hinkley Point C nuclear power station in England to £31–34 billion (in 2015 prices), up from £25–26 billion, and said the first reactor might not start until 2029–2031 rather than 2027. Each delay postpones the returns and adds to the cost, which weakens every measure of appraisal.
Sources: EDF, "Hinkley Point C update", 23 January 2024.
Managers test the reliability of the results by recalculating them under different assumptions (lower sales, higher costs, a delay of a year). A project that still looks worthwhile under pessimistic assumptions is a safer choice than one that is worthwhile only if everything goes to plan.
The business's objectives. A business focused on growth may choose a project with a long payback period because it builds market share; one focused on survival will prefer a fast payback.
The effect on employees. Automation, such as Solano's bottling line, may lead to job losses, lower morale and resistance from trade unions, as well as redundancy costs that the forecast may not include.
The effect on customers and the brand. A project may improve quality or service, or damage the brand if it is seen as cutting corners.
Ethics and the community. A project that is profitable but causes pollution, noise or the loss of local jobs may harm the business's reputation and its relationship with the community and government.
Sustainability. Many investors and customers now expect investments that reduce environmental impact, and some projects (renewable energy, cleaner production) are justified partly by the business's environmental objectives rather than only by their returns.
Availability and cost of finance. A project may be worthwhile but impossible to finance, or affordable only by borrowing at high interest rates, which increases the business's risk.
The state of the economy. In a recession demand may fall below the forecast; rising interest rates increase financing costs and the return the business needs to earn.
Opportunity cost. Choosing one project means giving up the others, and leaving money in the business as a safety margin is sometimes the better alternative.
Fit with strategy. A project that fits the business's strengths and long-term direction may be preferred to one with a slightly better return in an unfamiliar market. A SWOT analysis or a decision tree can help to structure the choice.
A sound recommendation between competing investments combines the two kinds of evidence. It starts from the quantitative results, explains what each measures and why they may conflict, and then asks which result matters most for this business at this time, given its liquidity, objectives, attitude to risk and stakeholders. It finishes by stating the assumptions on which the recommendation depends and what would change it.
Key concept | How it applies to investment decisions |
|---|---|
Change | Changes in technology, demand, costs and interest rates change the expected returns of a project during its life, sometimes enough to make it unprofitable before it is finished. |
Creativity | New products and processes come from creative ideas, but their returns are the hardest to forecast, so creative projects often look riskier on payback and ARR. |
Ethics | Forecasts involve judgment, and over-optimistic forecasts presented to lenders or shareholders raise ethical questions; projects also affect employees and communities. |
Sustainability | Environmental investments may have long payback periods but reduce long-term costs and risks and meet stakeholders' expectations. |
The methods are used differently depending on the organisation. Small businesses and start-ups, which have little cash and limited access to borrowing, rely heavily on the payback period, because recovering their money quickly matters more to them than the precise rate of return. Large companies, which compare many projects and can raise long-term finance, use NPV and ARR alongside payback and often set their own target returns and maximum payback periods.
Organisations whose main objective is not profit measure returns differently. A social enterprise may accept a lower financial return from a project that serves its social purpose, such as a training kitchen that employs young people, as long as the project covers its costs. Governments appraising a new railway or hospital include benefits that do not appear as cash for anyone, such as shorter journey times or better health, and costs such as pollution; this wider approach is called cost-benefit analysis. In each case the cash flow methods remain a starting point, and the organisation's objectives decide how much weight they carry.
Ørsted is a Danish energy company and one of the world's largest developers of offshore wind farms. In June 2019 the New Jersey Board of Public Utilities chose Ørsted's Ocean Wind 1, a 1,100 MW wind farm off the coast of New Jersey, as the state's first offshore wind project. The award guaranteed the project a price for its renewable energy certificates of $98.10 per MWh in its first year, and the farm was expected to supply power to about 500,000 homes. A second project, Ocean Wind 2 (1,148 MW), followed.
An offshore wind farm is a classic long-lived investment. Almost all of the cost is paid at the start, for turbines, foundations, cables and installation vessels; the returns, from selling electricity, arrive gradually over 25 years or more. The price was fixed when the project was awarded, so the expected returns depended heavily on the cost of building the farm and on the cost of the money borrowed to pay for it, both estimated years before construction.
Both assumptions changed sharply. High inflation raised the cost of building the farm, and delays by suppliers pushed back the project schedule. At the same time interest rates rose quickly: the yield on 10-year US government bonds, a benchmark for long-term borrowing costs, rose from about 2% when the project was awarded to 4.8% in October 2023.
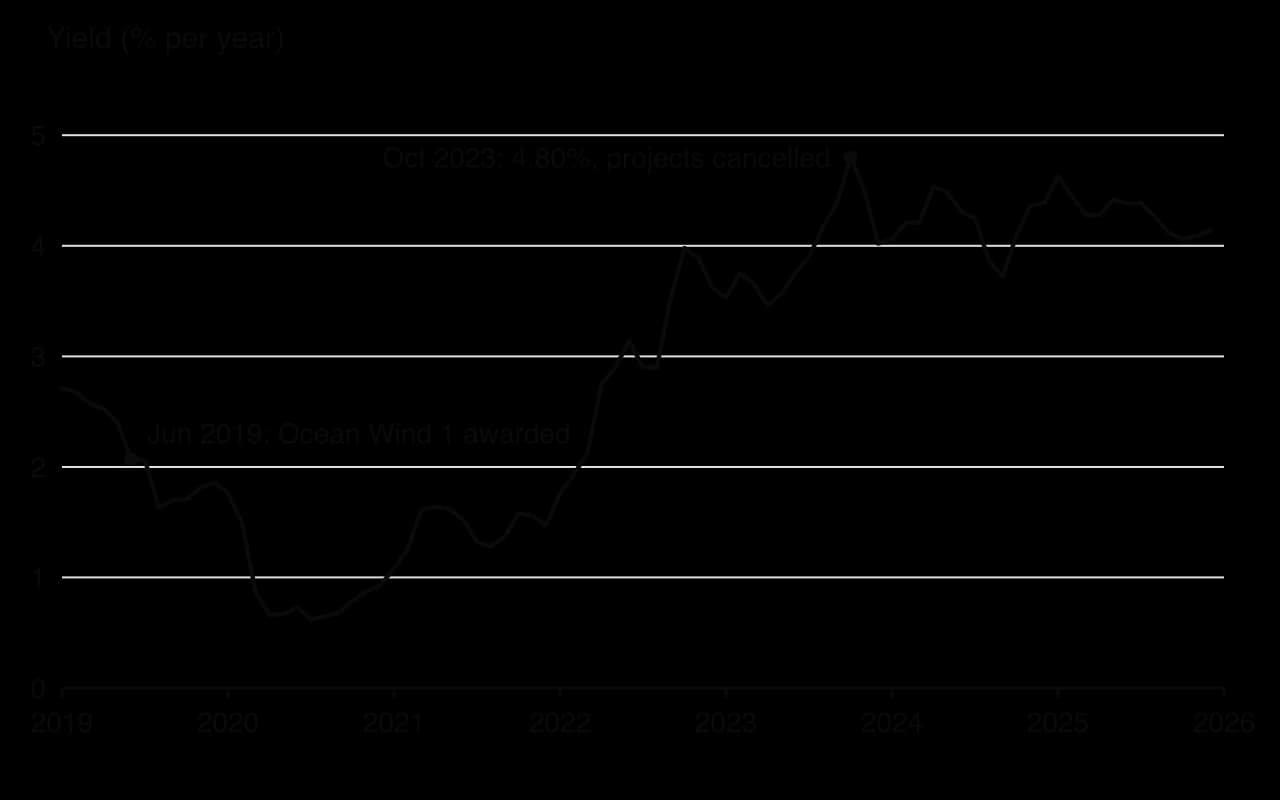
In August 2023 Ørsted warned of impairments of up to DKK 16 billion on its US projects. On 31 October 2023 its board decided to cease development of Ocean Wind 1 and 2, citing further supplier delays, higher long-term US interest rates and changed assumptions about tax credits and permits, and the company recognised impairments of DKK 28.4 billion in its results for the first nine months of 2023, most of them on Ocean Wind 1. An impairment is a reduction in the value of an asset in the accounts when its expected future returns fall below its book value, so these figures measure how far the expected value of the projects had fallen.
Ørsted, US offshore wind, 2023 | Amount |
|---|---|
Impairments expected in August 2023 (US portfolio) | up to DKK 16 billion |
Total impairments recognised, first nine months of 2023 | DKK 28.4 billion |
of which Ocean Wind 1 | DKK 19.9 billion |
of which Revolution Wind (third quarter) | DKK 3.3 billion |
Expected provision for cancelling Ocean Wind 1 (fourth quarter) | about DKK 8–11 billion |
Ørsted's gross investment, 2023 (estimate) | DKK 40–44 billion |
On the same day Ørsted went ahead with a different US project, Revolution Wind (704 MW), which it said was still expected to earn a return above its cost of capital by more than its target margin. The decision shows that investment appraisal is repeated as a project develops: the same company, in the same market and the same week, continued one project and abandoned another, because their updated cash flow forecasts differed.
The case shows how every method of appraisal depends on its assumptions. Higher construction costs raised the capital cost, and delays pushed the first cash inflows later. Both changes lengthen the payback period and reduce the average rate of return, because the fixed price meant revenue could not rise to cover the extra cost. Higher interest rates also raised the cost of the loans needed to build the farm, which reduced the net cash flows left for Ørsted. The qualitative factors were significant too: cancellation was itself costly, with an expected provision of DKK 8–11 billion for contract cancellation fees, and the construction work planned for New Jersey did not go ahead.
The case has limits as an illustration. Ørsted's published figures are impairments and provisions, not a full investment appraisal, and the company does not publish the cash flow forecasts behind them. Several causes acted together, so the effect of each one cannot be separated precisely.
Explain how rising construction costs and project delays would affect the payback period and the ARR of a project such as Ocean Wind 1.
Explain why a fixed price for the electricity made the project more vulnerable to rising costs.
Discuss whether Ørsted's stakeholders gained or lost from the decision to cancel the projects rather than complete them.
A wind farm's returns stretch over decades, so most of its present value comes from cash flows ten or twenty years ahead. When interest rates rise, the discount rate a business uses rises with them, and the discount factors for distant years fall sharply. At 4% the discount factor for year 10 is 0.6756; at 8% it is 0.4632, so the same cash flow in year 10 loses almost a third of its present value. Ørsted named higher long-term US interest rates among the causes of its impairments. A project that has a positive NPV when rates are low can therefore have a negative NPV when rates rise, even before any increase in costs.
Using the discount table, explain why a project with most of its returns in years 6–10 is more affected by a rise in the discount rate from 4% to 8% than a project with most of its returns in years 1–3.
Sources: Ørsted A/S, company announcement, 31 October 2023, and Ocean Wind news release, 31 October 2023; New Jersey Board of Public Utilities, press release, 21 June 2019; Federal Reserve Bank of St. Louis, FRED series GS10, accessed 2026.
Payback and ARR calculations are often set together on one project.
HL students may also be asked to discount the cash flows.
A "comment" part asks for a judgment based on the results, using the information in the question.
Investment appraisal uses quantitative methods to judge whether an investment is worthwhile and to compare projects; every method starts from forecast net cash flows.
The payback period is the time taken for cumulative cash flow to reach zero; part years are found from income needed ÷ contribution per month.
ARR = ((total returns − capital cost) ÷ years of use) ÷ capital cost × 100 measures average annual profitability.
Payback measures speed and liquidity risk; ARR measures profitability; the two can rank projects differently.
NPV discounts future net cash flows to present values and subtracts the original cost; a positive NPV adds value, and a higher discount rate lowers it (HL).
Every method depends on forecasts, so qualitative factors (risk, objectives, stakeholders, ethics, sustainability, finance and the economy) also shape the decision.
I can define investment, investment appraisal and opportunity cost.
I can calculate the payback period from net cash flows that differ each year, including the months.
I can calculate the ARR using the formula in the right order.
I can explain the time value of money and calculate NPV using discount factors (HL).
I can evaluate the payback period, ARR and (HL) NPV.
I can explain the qualitative factors that affect an investment decision.
I can recommend one of two projects using quantitative results and qualitative factors.
0.75 × 12 = 9 months, so the payback period is 3 years and 9 months.
Award [1] for correct working and [1] for the correct answer in years and months. Accept 3.75 years.
Explain how the solar panels could improve both the economic and the environmental sustainability of Sunbird’s operations.
4 marks
Economic sustainability: savings of R320 000 a year reduce Sunbird’s largest cost after rent; the investment pays back in 3 years 9 months out of a 15-year life, so savings continue for more than 11 years. Batteries let the laundries stay open during power cuts, protecting revenue and customer loyalty.
Environmental sustainability: solar electricity replaces grid electricity, much of which in South Africa comes from coal, so carbon emissions per load of washing fall.
Mark as 2 + 2. For each type of sustainability, award [1] for identifying a relevant effect and [1] for explaining it in the context of Sunbird. Accept OFR from (a).
Kino Lumen
Kino Lumen is a chain of 11 cinemas in Poland. It plans to open one new multiplex in 2027 and has two possible sites: a retail park on the edge of Wrocław (Site A) or a historic building in the centre of Kraków (Site B).
The finance director, Agnieszka Wójcik, has forecast the net cash flows of each site (Table 1) using footfall counts, local population data and the results of existing cinemas. The chief executive, Tomasz Zieliński, who founded the chain 20 years ago, prefers Site B. He says: “I have walked that street many times. I can feel that a cinema there will become a landmark. The spreadsheets cannot see that.”
Table 1: Forecast cost and net cash flows of the two sites (PLN 000)
Site A (Wrocław) | Site B (Kraków) | |
|---|---|---|
Cost of fitting out (year 0) | 12 000 | 15 000 |
Year 1 | 3 000 | 5 000 |
Year 2 | 4 000 | 5 000 |
Year 3 | 4 500 | 4 000 |
Year 4 | 6 000 | 4 000 |
Using Table 1, calculate the payback period for each site (show all your working).
4 marks
With reference to Kino Lumen, distinguish between scientific and intuitive management.
4 marks
Explain one reason why Tomasz might be right to rely partly on his intuition in this decision.
2 marks
Pampas Leather makes handbags and belts in Córdoba, Argentina, and prices its exports in US dollars. Its return on capital employed (ROCE) last year was 11 %. It plans to buy a computer-controlled leather-cutting machine for $400 000, financed by a five-year bank loan. The machine is expected to generate total net returns of $760 000 over its five-year life.
Calculate the average rate of return (ARR) of the machine (show all your working).
2 marks
Explain how buying the machine might affect Pampas Leather’s ROCE.
4 marks