Distinguish profit from cash flow, calculate working capital, construct and interpret cash flow forecasts in the IB layout, and evaluate strategies for dealing with cash flow problems.
Each is in the Business glossary, with every other term in the subject.
The movement of money into and out of a business over a given period of time.
A statement of the expected cash inflows and cash outflows of a business, month by month, over a future period, showing the net cash flow and closing balance of each month.
Money received by a business in a period, for example from cash sales, payments by debtors, loans, owners' capital or the sale of assets.
Money paid out by a business in a period, for example for stock, wages, rent, interest, tax, loan repayments or the purchase of non-current assets.
The amount of cash a business holds at the end of a period, found by adding the period's net cash flow to its opening balance.
A method of improving cash flow in which a business sells its debtors (unpaid customer invoices) to a specialist finance company for immediate cash, in return for a fee.
The extent to which a business is able to meet its short-term debts as they fall due, judged by comparing its liquid assets with its current liabilities.
The difference between the total cash inflows and the total cash outflows of a business in a period; negative when outflows are larger than inflows.
Explain the difference between profit and cash flow.
Explain the working capital cycle and calculate working capital.
Explain the meaning of a liquidity position and how it is judged.
Construct, complete and interpret a cash flow forecast in the IB layout.
Explain the limitations of cash flow forecasts.
Explain the relationship between investment, profit and cash flow, including overtrading.
Evaluate strategies for reducing cash outflows, improving cash inflows and finding additional finance.
Cash flow is the movement of money into and out of a business over a period of time. A business can survive for a while without making a profit, but it cannot survive for long without cash, because wages, suppliers, rent, interest and tax are all paid in cash on fixed dates. Managing cash is therefore one of the most important tasks of the finance function in every organisation, from a street food stall to a battery manufacturer such as Northvolt, which raised billions of dollars but ran out of cash in 2024.
Cash flow links to the key concepts in direct ways. Businesses face change in the timing of their cash flows when customers pay later, interest rates rise or sales fall; ethics questions arise when a large business protects its own cash by paying small suppliers late; and a business that cannot manage its cash is not financially sustainable, however good its products are.
92 exam-style questions on this subtopic, written in the style of the IB papers. The first has its markscheme open. Counted on
Kantelaar Scooters
Kantelaar Scooters is a start-up in Utrecht, the Netherlands, that designs folding electric scooters for commuters. It launched its first model, the V1, in January 2025 at a price of €1 500. The V1 is sold online and through 12 cycle shops. Reviews praise its light weight and long battery range, but several larger competitors sell heavier scooters for €900–€1 100.
Kantelaar’s founders invested heavily in production and in an online advertising campaign before the launch. Table 1 shows the V1’s quarterly cash flows in 2025.
Table 1: Kantelaar Scooters’s cash flows from the V1, 2025 (€000)
Quarter | Units sold | Cash inflows | Cash outflows |
|---|---|---|---|
Q1 | 400 | 600 | 1 400 |
Q2 | 900 | 1 350 | 1 700 |
Q3 | 1 600 | 2 400 | 2 200 |
Q4 | 2 400 | 3 600 | 2 900 |
The founders are now discussing two options for 2026. Option A: cut the price of the V1 to €1 200 to win market share quickly. Option B: keep the price at €1 500 and spend an extra €400 000 on promotion, including test-ride events at railway stations and a partnership with a cycling influencer.
The official deck for this part of the syllabus.
Define cash flow.
Why can a business survive for a while without profit but not for long without cash?
With a free account, Augment remembers where you stopped and what you have practiced.
The amount of cash a business holds at the start of a period, equal to the closing balance of the previous period.
The situation in which a business expands its sales and operations too quickly for its working capital and finance to support, so that it runs short of cash despite strong demand.
The money available for the day-to-day running of a business, measured as current assets minus current liabilities.
The period of time between a business paying cash for stock, materials and labour and receiving cash from the sale of the finished goods or services.
Every business has money coming in and money going out. Money coming in is a cash inflow: cash from customers who pay at the time of sale, payments from debtors (customers who bought on credit earlier), a new bank loan, money the owners put into the business, the sale of an old machine, or a tax refund. Money going out is a cash outflow: payments for stock and raw materials, wages and salaries, rent, electricity, advertising, interest, tax, dividends, loan repayments and the purchase of equipment.
In business, "cash" means more than notes and coins. It includes money in the business's bank accounts, which is where nearly all of its cash is held. A payment made by bank transfer or card is a cash flow in exactly the same way as a payment in notes.
Inflows and outflows rarely match from month to month. A ski school receives most of its cash in winter but pays rent all year; a toy manufacturer pays for materials and wages in the summer and is paid by retailers after the busy December season. The business must hold enough cash, or have enough borrowing available, to cover the months in which outflows are larger than inflows.
The difference between the two in a period is the net cash flow. When inflows are larger than outflows, net cash flow is positive and the business has more cash at the end of the period than at the start. When outflows are larger, net cash flow is negative and the cash balance falls.
The cash a business holds at the start of a period is its opening balance, and the cash it holds at the end is its closing balance. The closing balance of one month becomes the opening balance of the next, so cash builds up, or runs down, month by month.
Profit and cash flow both measure money, so they are easily confused, but they measure different things. Profit is the difference between the revenue a business earns from its sales in a period and the costs it incurs to earn that revenue. Cash flow is the money that actually enters and leaves the bank account in that period. A sale counts towards profit when it is made, even if the customer pays two months later; it counts as a cash inflow only when the money arrives.
Profit is reported in the statement of profit or loss, which matches the revenue of a period with the costs of earning it. Cash is recorded in a cash flow forecast (for the future) or in a cash flow statement (for the past), and the closing cash balance appears in the statement of financial position among the current assets. A business can therefore show a healthy profit and a shrinking cash balance in the same year, or a loss and a growing cash balance.
The two measures differ because many transactions are recorded in the accounts at one time and paid for at another, and because some transactions affect only one of the two measures. The main reasons are set out in the table.
Reason | Effect on profit | Effect on cash flow |
|---|---|---|
Credit sales: customers buy now and pay later (often 30–90 days). | Revenue counts in the period of the sale. | No inflow until the customer pays; debtors rise in the meantime. |
Credit purchases: the business buys from suppliers on trade credit. | The cost counts when the goods are used up in sales. | No outflow until the supplier is paid; creditors rise in the meantime. |
Stock bought but not yet sold | Not a cost until the goods are sold (it is part of cost of sales only then). | Cash leaves when the stock is paid for, often long before it is sold. |
Capital expenditure: buying machinery, vehicles or buildings | Only the yearly depreciation counts as a cost, spread over the asset's life. | The whole price is a cash outflow when the asset is paid for. |
Depreciation | Reduces profit every year. | No cash moves: it is an accounting entry, not a payment. |
Loans and owners' capital | Not revenue, so no effect on profit (only the interest is a cost). | A cash inflow when received; repayments of the loan are cash outflows. |
Sale of a non-current asset | Only any gain or loss on the sale affects profit. | The full sale price is a cash inflow. |
Tax and dividends | Tax is deducted from profit for the year in which it is owed. | Often paid months after the end of the year. |
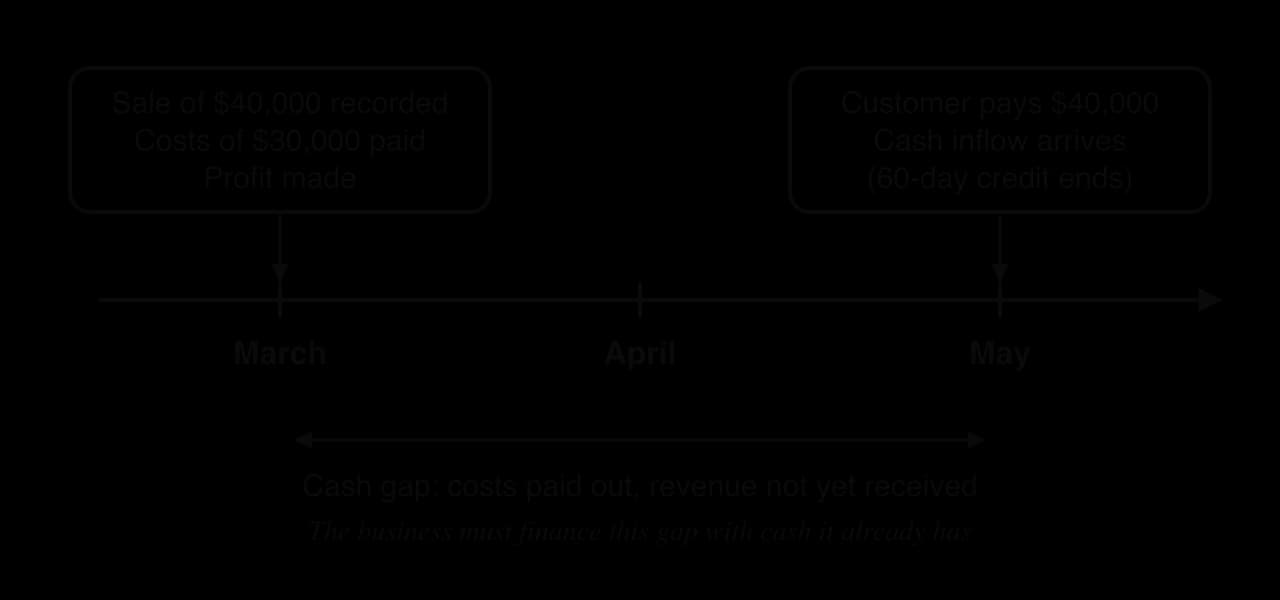
Credit is the most common cause of the gap. In many industries a business-to-business sale is paid 30, 60 or 90 days after delivery. During that time the seller has already paid for the materials, the wages and the transport, so it has spent cash it will not get back for months. The timeline shows the gap for a single sale.
Capital expenditure works the other way round. A delivery van that costs $36,000 and lasts six years reduces profit by only $6,000 a year through depreciation (the part of an asset's cost charged as an expense in each year of its life), but the business pays the whole $36,000 in cash when it buys the van (unless it uses a loan or leasing). In the year of purchase, cash falls by far more than profit.
Because the two measures differ, a business can be profitable on paper and still be unable to pay its debts. Insolvency is the situation in which a business cannot pay its debts when they are due. A profitable business becomes insolvent when its cash is tied up in stock and debtors, or has been spent on new assets, at the moment its creditors, employees or lenders need to be paid. If a lender or supplier then goes to court, the business can be closed even though its products sell at a profit.
The opposite can also happen for a time. A loss-making business can have plenty of cash if it has recently borrowed, sold assets or raised money from shareholders; many technology start-ups make losses for years while investors fund them. That situation lasts only as long as new finance keeps coming in. In the long run a business needs both profit, so that its activities add value, and cash, so that it can pay its bills on time.
Working capital is the money a business has available for its day-to-day running. It is measured from the statement of financial position as the difference between current assets (cash, debtors and stock, which should turn into cash within a year) and current liabilities (debts due within a year, such as the bank overdraft, trade creditors and short-term loans). Working capital is also called net current assets.
Positive working capital means that the business's short-term assets are larger than its short-term debts, so it should be able to pay its debts as they fall due, provided the debtors pay and the stock can be sold. Negative working capital means that, if all short-term debts had to be paid at once, the current assets would not be enough.
The extract shows the current assets and current liabilities of Pacífica Tiles, a tile wholesaler (hypothetical data), at 31 December.
All figures in $000 | ||
Current assets | ||
Cash | 12 | |
Debtors | 30 | |
Stock | 18 | |
Current assets | 60 | |
Current liabilities | ||
Bank overdraft | 8 | |
Trade creditors | 22 | |
Other short-term loans | 5 | |
Current liabilities | 35 |
The working capital cycle is the continuous flow of cash through the day-to-day operations of a business. Cash is used to buy raw materials and stock; production turns them into finished goods (for a manufacturer); the goods are sold; customers who buy on credit become debtors; when the debtors pay, the cash is back where it started and can be used again. Suppliers who give trade credit become creditors, and the business pays them in cash when their credit period ends.
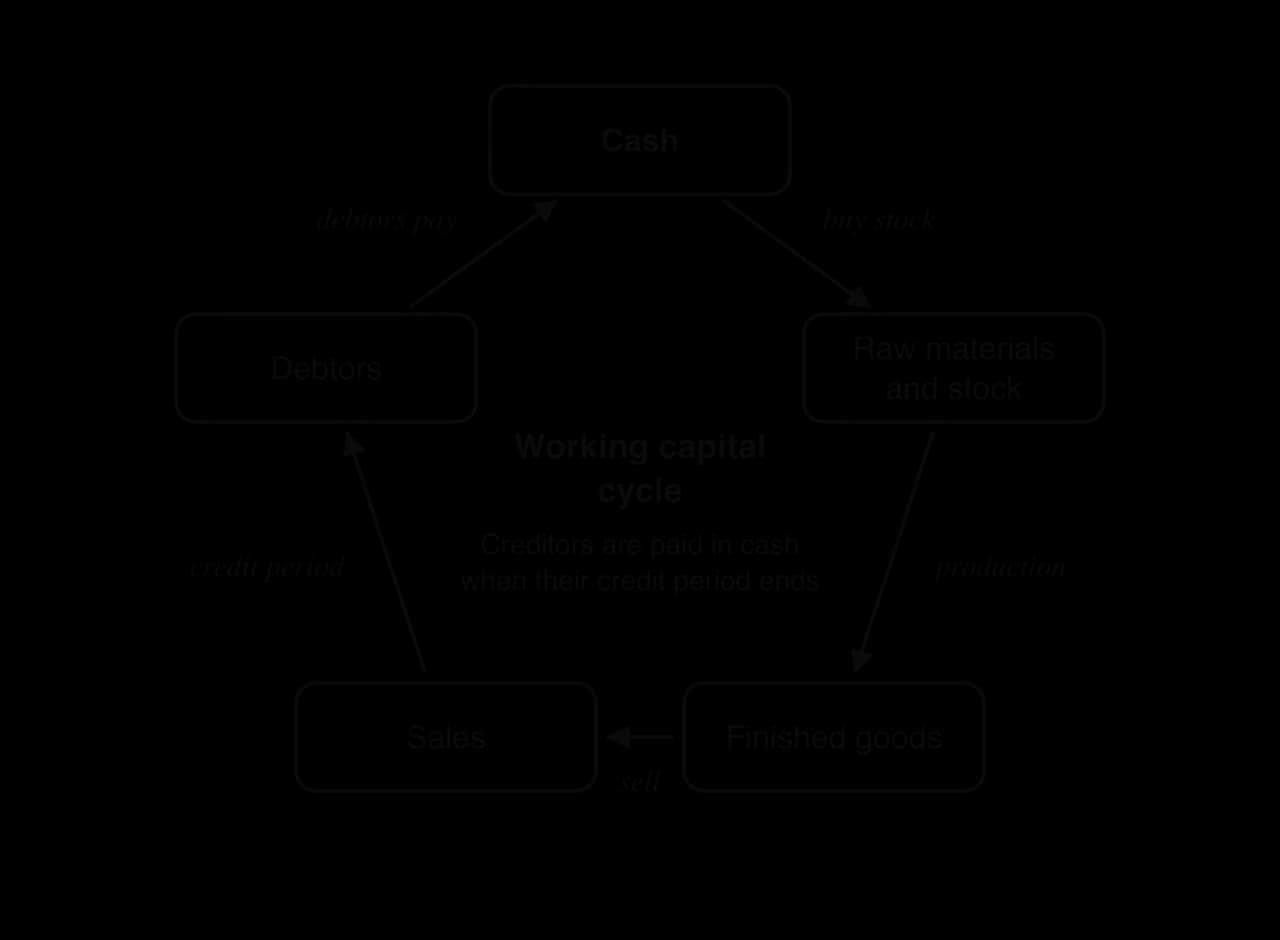
The length of the cycle matters as much as the amount of working capital. Each stage holds cash up: raw materials sitting in a warehouse, goods being made, finished goods waiting to be sold, and debtors who have not yet paid. Credit from suppliers works the other way, because it lets the business delay its own payments. The amount of cash needed to finance the cycle depends mainly on the time between paying suppliers and receiving payment from customers.
A manufacturer of furniture might pay for timber in January, make and store the furniture until April, sell it to retailers on 60-day credit and be paid in June. Its cash is tied up for about five months for each batch, so it needs a large amount of working capital.
A café, by contrast, buys food on 30-day credit, sells it within days and is paid in cash or by card on the spot, so it is often paid by its customers before it has paid its suppliers. Supermarkets work in a similar way, which is why many large grocery retailers operate with current liabilities larger than their current assets without difficulty.
Businesses shorten the cycle to free cash. Holding less stock (for example through just-in-time ordering), selling faster, giving customers shorter credit periods, and agreeing longer credit periods with suppliers all reduce the cash that the cycle ties up. Each of these choices has costs as well as benefits, both for the business and for its customers and suppliers.
Too little working capital is dangerous. The business may be unable to buy stock, pay wages or take on a large new order, and it depends heavily on an overdraft that the bank can reduce at short notice. Suppliers who see that it pays late may stop giving it credit, which makes the shortage worse.
Too much working capital also has a cost. Cash lying in a current account earns little or no interest; stock that sits in a warehouse can be damaged, stolen or go out of fashion; debtors who take months to pay may never pay at all. Money tied up in these ways could have been used to repay expensive loans, to invest in new machinery or to reward shareholders. The right level of working capital therefore depends on the type of business, the length of its working capital cycle, how seasonal its sales are and how easily it can borrow at short notice.
Liquidity is the ability of a business to pay its short-term debts as they fall due. An asset is liquid if it can be turned into cash quickly without losing much of its value: cash is perfectly liquid, debtors are fairly liquid, stock is less liquid, and buildings and machinery are illiquid. The liquidity position of a business describes how well placed it is to meet its short-term obligations from its liquid assets.
A business with a strong liquidity position has enough cash, and assets that can quickly become cash, to pay its creditors, lenders and employees on time, with something to spare for unexpected costs. A business with a weak liquidity position depends on customers paying promptly and on its bank continuing to lend, so a single late payment or a fall in sales can leave it unable to pay its bills.
Managers and lenders judge the liquidity position with liquidity ratios, which compare current assets with current liabilities.
The current ratio (current assets ÷ current liabilities) shows how many times the current assets cover the current liabilities. The acid test ratio ((current assets − stock) ÷ current liabilities) leaves out stock, the least liquid current asset, so it is a stricter test. A current ratio between about 1.5 and 2 and an acid test ratio of about 1 are often treated as comfortable, although the right values depend on the industry. Ratio analysis shows the liquidity position at one date; a cash flow forecast shows how it is likely to change over the coming months.
A cash flow forecast is a month-by-month estimate of a business's future cash inflows and outflows, and of the cash balance they will leave at the end of each month. It is usually prepared for the next six or twelve months. Its purpose is to warn managers in advance of any month in which the business is likely to run short of cash, so that they can arrange finance or change their plans before the problem arrives.
To identify cash shortages in advance. A forecast shows the months in which the closing balance will be negative or dangerously low, so that an overdraft or loan can be arranged early, when banks are more willing to lend.
To support applications for finance. Banks, business angels and other lenders usually ask for a cash flow forecast with a loan application or a business plan, to see whether the business will be able to repay.
To plan the timing of spending. Managers can schedule the purchase of equipment, a marketing campaign or the building of stock for months in which cash is available.
To identify surpluses. A forecast also shows months in which cash will build up, which could be used to repay debt, invest or earn interest.
To monitor and control. Comparing actual cash flows with the forecast each month shows where the business has gone wrong (sales lower than expected, costs higher, customers paying late) and helps managers act quickly.
Cash flow forecasts use a standard layout, with the months as columns and the items as rows. Each column follows the same sequence: the opening balance, the cash inflows and their total, the cash outflows and their total, the net cash flow, and the closing balance. Negative figures are shown in brackets, so (6) means minus 6. The units are stated in the top-left cell.
The forecast for a three-month period of Ubuntu Crafts, a small homeware producer (hypothetical data), shows the layout.
All figures in $000 | January | February | March |
|---|---|---|---|
Opening balance | 9 | 4 | 3 |
Cash inflows | |||
Cash sales revenue | 120 | 125 | 118 |
Tax refund | 4 | ||
Total cash inflows | 120 | 129 | 118 |
Cash outflows | |||
Rent | 6 | ||
Packaging | 8 | 9 | 8 |
Salaries and wages | 35 | 35 | 35 |
Cost of sales | 70 | 80 | 76 |
Heating and lighting | 3 | 3 | 3 |
Delivery | 3 | 3 | 3 |
Total cash outflows | 125 | 130 | 125 |
Net cash flow | (5) | (1) | (7) |
Closing balance | 4 | 3 | (4) |
Each line has a precise meaning:
Opening balance: the cash at the start of the month. The first month's figure is given; every later month's is the previous month's closing balance.
Cash inflows: every source of cash expected in the month, each on its own line (cash sales revenue, payments from debtors for earlier credit sales, loans received, capital from owners, a tax refund, the sale of an asset). Only the month in which the cash arrives counts.
Total cash inflows: the sum of the inflow lines.
Cash outflows: every payment expected in the month, each on its own line (rent, wages, stock or cost of sales, utilities, delivery, loan repayments, interest, the purchase of equipment). Payments that happen once, such as the quarterly rent in January, appear only in the month they are paid.
Total cash outflows: the sum of the outflow lines.
Net cash flow: total cash inflows minus total cash outflows, in brackets when negative.
Closing balance: opening balance plus net cash flow. A closing balance in brackets means the business has spent more than it has, so it needs an overdraft or other finance for that month.
The forecast shows that Ubuntu Crafts' cash falls in every month and the business will have an overdraft of $4,000 at the end of March. Its sales are steady, so the problem is that outflows are slightly larger than inflows each month. Managers have three months' warning to arrange an overdraft, cut costs or speed up inflows.
Constructing a forecast means turning information about sales, credit terms and costs into the standard layout. The method is the same for any business:
Write the months across the top and the row labels down the side in the standard order.
Enter the opening balance for the first month.
Work out each month's cash inflows. For sales, split them into the part paid in cash in the month of sale and the part paid later by debtors, and place each part in the month the cash arrives. Add any loans, capital or asset sales in the month they are received.
Work out each month's cash outflows, placing each payment in the month it is made (not the month the cost is incurred).
Total the inflows and the outflows, and calculate the net cash flow.
Calculate the closing balance and carry it forward as the next month's opening balance.
Check every total, then interpret the result.
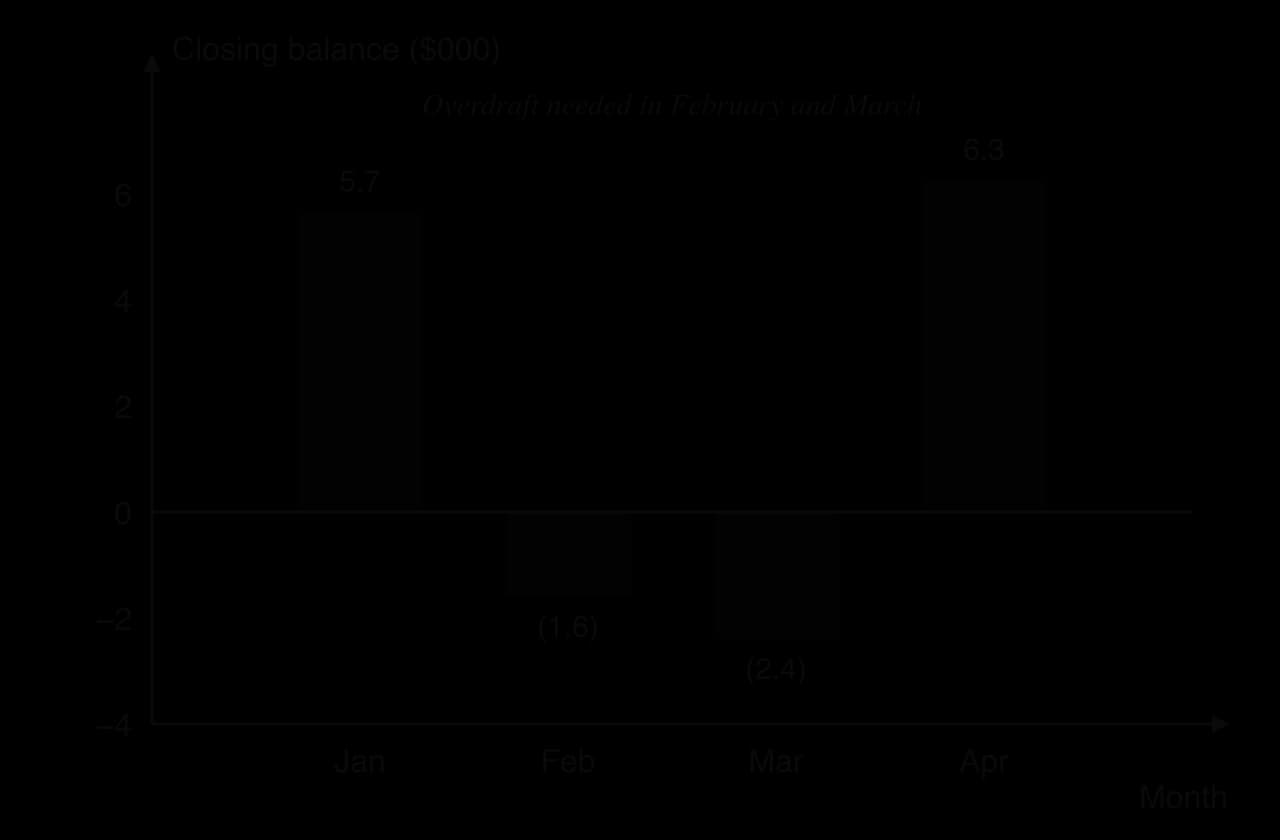
Interpreting the forecast matters as much as constructing it. Kibo Cycles' sales grow every month, and in February its revenue ($22,000) is larger than its operating costs, so the business is profitable. Its cash still goes negative, because the machine is paid for in one month while the loan covers only part of the cost, and because half of each month's sales are not paid until the following month.
Kibo Cycles needs an overdraft of at least $2,400, and preferably more as a safety margin, for February and March; alternatively it could lease the machine, delay its purchase until April, or ask for a larger loan. By April the rising spring sales bring the balance back to $6,300.
 YouTube
Some tasks give a forecast with figures missing and ask for the gaps to be filled. The relationships between the lines make every gap solvable: totals are the sum of their lines, net cash flow is total inflows minus total outflows, closing balance is opening balance plus net cash flow, and each opening balance is the previous closing balance.
Harbour Café (hypothetical data) has prepared part of its cash flow forecast for the third quarter, with some figures still to be calculated (marked ?).
All figures in $000 | July | August | September |
|---|---|---|---|
Opening balance | 4 | ? | ? |
Cash inflows | |||
Cash sales revenue | 60 | 72 | 48 |
Local council grant | 5 | ||
Total cash inflows | 60 | ? | 48 |
Cash outflows | |||
Rent | 6 | 6 | 6 |
Salaries and wages | 24 | 28 | 22 |
Food and drink supplies | 28 | 30 | 20 |
Utilities | 3 | 3 | 3 |
Marketing | 2 | ||
Total cash outflows | ? | 67 | 51 |
Net cash flow | ? | ? | ? |
Closing balance | ? | ? | ? |
A forecast is useful only if managers draw conclusions from it. The main things to look for are:
Negative closing balances: the months in which finance will be needed, and how much (the largest negative balance is the minimum overdraft needed).
The trend of net cash flow: whether the business generates cash from its normal trading month after month, or relies on one-off inflows such as loans.
One-off items: large purchases, tax payments or loans that distort a single month and might be moved to a better time.
Seasonal patterns: months of low inflows that recur every year and can be planned for.
The size of the safety margin: a closing balance that stays just above zero leaves the business exposed to any delay or unexpected cost.
Forecasts are often tested with "what if" questions. Managers recalculate the forecast assuming, for example, that sales are 10% lower or that customers pay a month later, to see whether the business could still pay its bills. This kind of sensitivity analysis is easy with a spreadsheet and shows how much the business depends on its assumptions.
A cash flow forecast is only an estimate, and its accuracy depends on the assumptions behind it. Its main limitations are:
Sales are hard to predict. Sales revenue is usually the largest inflow and the most uncertain one; changes in tastes, competitors' actions, the weather or the state of the economy can make the forecast wrong.
Customers may pay late, or not at all. The forecast assumes debtors pay on the agreed date. Late payment is common: in 2022, small and medium-sized businesses in the UK were owed an average of about £22,000 each in late payments.
Costs can change unexpectedly. Rises in energy prices, wages, raw material costs or interest rates, and breakdowns that need repairs, all raise outflows.
External events. A recession, a pandemic, a natural disaster or a change in exchange rates can change many lines of the forecast at once.
Inexperience and optimism. New businesses have no past data to base their estimates on, and owners who want a loan may be tempted to be over-optimistic, which raises an ethics question when the forecast is shown to a lender.
The further ahead, the less reliable. Next month's figures are usually close to the truth; figures nine or twelve months ahead are much less certain.
Sources: Department for Business and Trade, "Government takes action to back small businesses and tackle late payments", 2 October 2023.
Forecasts remain useful despite these limitations. Even an imperfect forecast makes managers think through the timing of every payment and spot problems early; it is most useful when it is updated each month with actual figures and when managers plan for a range of outcomes rather than a single estimate.
Investment means spending money now on assets such as machinery, buildings, technology or new products in the expectation of higher profit in the future. Investment, profit and cash flow are linked by time: investment uses cash today, it may not add to profit for months or years, and the cash it eventually generates may arrive long after the money was spent. The decision to invest is judged with investment appraisal; its effect on cash flow is that the business must be able to survive the period between paying for the investment and receiving the returns.
The timing works in a typical sequence. When the business invests, cash flow is strongly negative. While the new asset is being installed or the new product is being launched, profit may fall, because of depreciation, interest on the money borrowed, training costs and marketing. Later, if the investment succeeds, revenue rises and both profit and cash flow improve. A business with a weak liquidity position may not survive the first stage, however profitable the investment would have been, which is why many businesses finance large investments with long-term sources (loans, share capital, leasing) rather than with their working capital.
The link also runs in the other direction. Profit is a source of cash for investment: retained profit is the cheapest source of long-term finance for most businesses. A business that makes little profit has less cash to invest, and one that pays out most of its profit as dividends keeps less for investment.
Growth itself can cause cash flow problems. When sales rise quickly, a business must buy more stock and materials, hire more staff and often expand its premises or buy more machinery, all of which are paid for before the extra sales bring in cash. If the extra sales are on credit, debtors rise as well, so even more cash is tied up in the working capital cycle. A business that grows faster than its cash and finance can support is said to be overtrading.
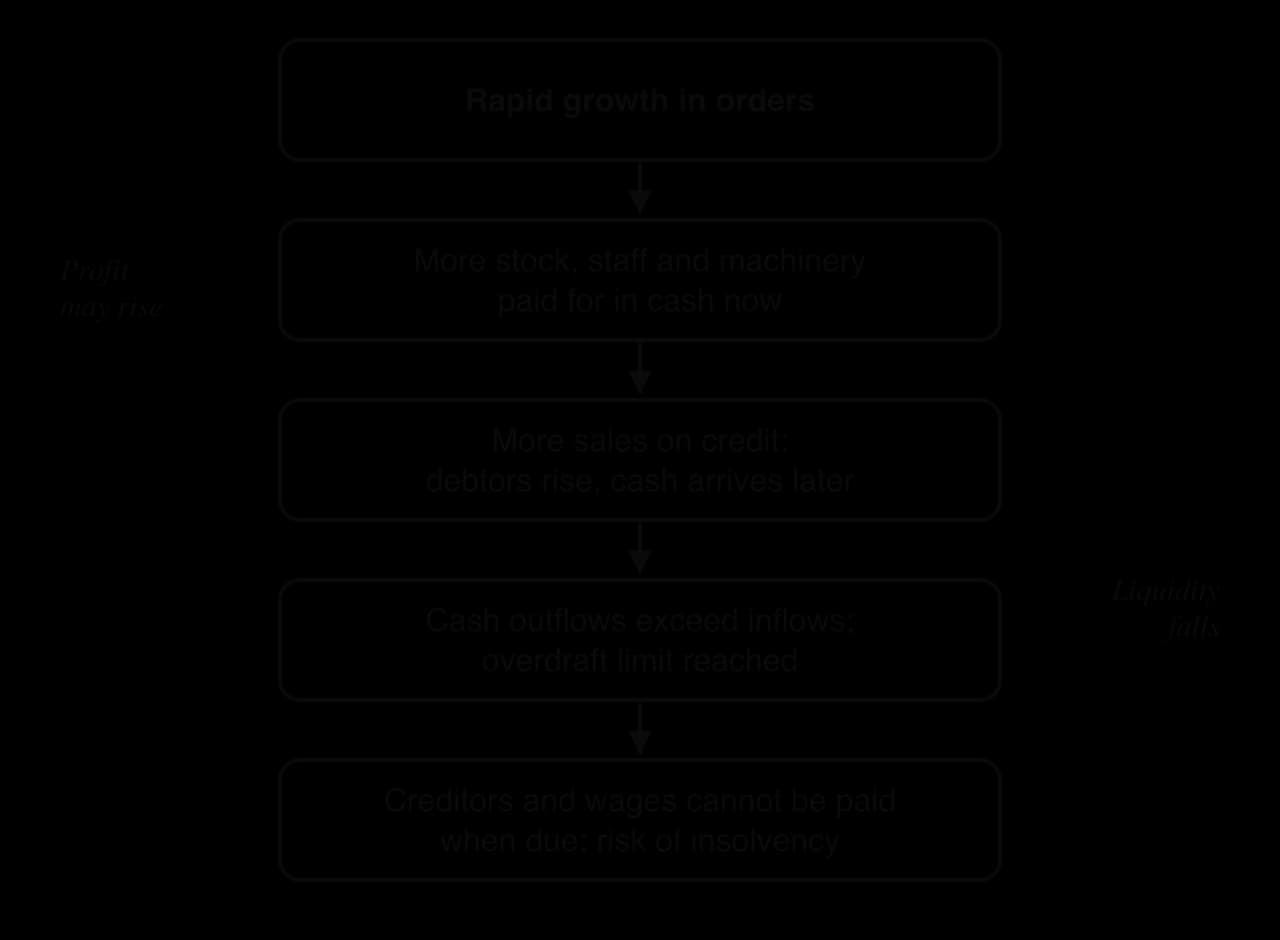
Overtrading is common among young businesses that win a large order or become suddenly popular, and among businesses that expand into new locations or products at the same time. Its warning signs include rising debtors and stock, an overdraft that stays close to its limit, suppliers who complain about late payment, and a current ratio and acid test ratio that keep falling even as sales rise. The remedies include growing more slowly (turning down some orders), raising long-term finance before expanding, reducing the credit given to customers and using factoring to turn debtors into cash.
A cash flow problem exists when a business does not have enough cash, or access to finance, to pay its debts when they are due. The causes are usually one or more of: low sales or falling prices; poor stock control (too much stock); giving customers too much credit, or customers paying late; high or rising costs; unplanned capital expenditure; overtrading; and seasonal patterns that were not planned for. The forecast shows when the problem will arise; the business then has three groups of strategies: reduce cash outflows, improve cash inflows, or find additional finance.
Strategy | How it helps cash flow | Limitations |
|---|---|---|
Negotiate longer credit with suppliers | Delays outflows, so cash stays in the business longer. | Suppliers may refuse, charge higher prices or stop supplying; very late payment damages relationships and the business's reputation. |
Find cheaper suppliers | Reduces the cash paid for each unit of stock or material. | Quality and reliability may fall; switching takes time; loyal suppliers may be lost. |
Lease rather than buy non-current assets | Replaces one large outflow with smaller regular payments. | Leasing usually costs more in total over the life of the asset, and the business does not own it. |
Reduce costs (overheads, energy, staff hours) | Cuts outflows every month. | Cutting staff or training can reduce quality and motivation; some costs cannot be cut quickly. |
Delay capital expenditure | Removes a large outflow from a difficult month. | Growth and efficiency gains are postponed; old equipment may break down. |
Hold less stock | Less cash is tied up in the working capital cycle. | Risk of running out of stock and losing sales; loss of bulk-buying discounts. |
Paying suppliers later is the cheapest strategy for the business that uses it, but it moves the cash flow problem onto the supplier. Small suppliers are hit hardest, because they often cannot refuse a large customer's terms. The UK construction firm Carillion went into compulsory liquidation on 15 January 2018 with liabilities that the Official Receiver later estimated at £6.9 billion. Small subcontractors claimed that it had taken up to 120 days to pay them; when it collapsed, many of those small firms were left unpaid. The case shows both the ethical cost of protecting one's own cash at suppliers' expense and the limit of the strategy: delaying payment postpones a cash flow problem but does not solve it.
Sources: Carillion plc, regulatory announcement, 15 January 2018; The Telegraph, 12 February 2018 and 14 April 2018.
Strategy | How it helps cash flow | Limitations |
|---|---|---|
Shorten the credit period given to customers | Customers pay sooner, so inflows arrive earlier. | Customers may buy from competitors who offer longer credit. |
Offer discounts for prompt payment (for example 2% for payment within 10 days) | Encourages debtors to pay early. | The business receives less money for each sale, so profit falls. |
Factoring | The business sells its debtors to a factoring company and receives most of their value (often 80–90%) at once. | The factor charges a fee, so profit falls; customers may dislike dealing with a factor. |
Sell for cash only | Removes debtors altogether. | Customers who expect credit (especially other businesses) may go elsewhere. |
Sale and leaseback | Selling an asset (such as a building) and leasing it back releases a large sum of cash while keeping the use of the asset. | Lease payments continue for years; the business loses the asset and any rise in its value. |
Sell surplus stock or unused assets | Turns idle resources into cash quickly. | Stock sold at a discount reduces profit; assets may be needed later. |
Raise prices | Can raise inflows if demand is not very sensitive to price. | Sales may fall; customers may switch to competitors, so inflows can fall instead. |
Chase late payers (credit control) | Reminders, interest on late payments and credit checks on new customers reduce bad debts. | Takes staff time; firm treatment may damage relationships with customers. |
Factoring deserves particular attention, because it is widely used by small and growing businesses. The business sells the invoices its customers owe to a specialist finance company, the factor, which pays an agreed percentage of their value straight away and the rest, minus its fee, when the customers pay. The business gets cash weeks or months earlier and often passes its credit control to the factor.
Factoring improves cash flow but reduces profit, because the business gives up part of the value of its sales. It suits businesses with reliable customers and long credit periods, such as manufacturers and wholesalers that sell to large retailers; it suits businesses with very low profit margins less well, because the fee can absorb most of the profit on each sale.
When neither outflows nor inflows can be changed quickly enough, the business can arrange extra finance to cover the shortage. Short-term problems are best met with short-term sources:
A bank overdraft: the most flexible option for a temporary shortage, such as Kibo Cycles' two negative months; interest is charged only on the amount overdrawn, but the rate is high and the bank can withdraw the facility at short notice.
A short-term loan: suits a known, one-off need; it has a fixed repayment schedule and needs to be applied for in advance, often with collateral.
Owners' funds: sole traders and partners can put in more of their own savings, and shareholders can buy new shares; this costs no interest but increases the owners' risk.
Trade credit from new suppliers, or government grants and support schemes, where available.
Borrowing covers a cash shortage for a time but does not remove its cause. If the problem is temporary (a seasonal dip, a single large purchase), finance is the right answer. If the business makes losses or its outflows are larger than its inflows every month, borrowing adds interest costs and makes the problem worse; it must then change how it operates.
No strategy is right for every business, and each one trades cash flow against something else. Most strategies that improve cash flow reduce profit (discounts, factoring, leasing, selling stock cheaply) or put pressure on stakeholder relationships (paying suppliers later, demanding faster payment from customers, cutting staff). Some help in the short run but harm the business in the long run: delaying investment saves cash this year but may leave the business less competitive in three years.
The best choice depends on:
The cause of the problem. A seasonal shortage calls for an overdraft; slow-paying customers call for credit control or factoring; overtrading calls for slower growth or long-term finance; a business that is simply unprofitable needs to cut costs or change its product, not borrow.
How long the problem will last. A two-month gap and a permanent deficit need different responses.
The bargaining power of the business. A large retailer can impose longer credit on suppliers; a small start-up cannot.
Relationships with stakeholders. A strategy that damages trust with suppliers, customers, employees or the bank can create bigger problems later.
The cost of each option compared with its benefit, including interest rates and the effect on profit.
The legal form and size of the business, which affect which sources of finance it can use.
The state of the economy. In a recession customers pay more slowly and banks lend less readily, so options that work in good times may not be available.
In practice businesses combine strategies: a business facing a shortage might arrange an overdraft to cover the next two months, start offering a small prompt-payment discount, and lease rather than buy its next machine. The forecast should then be updated to check that the combination closes the gap. A strategy that removes the cause of the problem is generally better than one that only covers it.
 YouTube
Northvolt was a Swedish battery manufacturer established in 2016 to build a large-scale, low-carbon supply of lithium-ion battery cells for European car makers. It became one of Europe's best-funded start-ups: its largest shareholders at the end of 2023 included Volkswagen and funds managed by Goldman Sachs Asset Management. Its first gigafactory, Northvolt Ett in Skellefteå in northern Sweden, had 16 GWh of installed production capacity and more than 3,500 employees by mid-2024, and the company planned to expand it to 60 GWh a year and to build further plants in Germany and Canada.
Battery manufacturing needs enormous investment long before any revenue arrives. Northvolt's own report described 2023 as the heaviest investment year in its history, with spending of about $200 million a month, and said it raised a further $7 billion of finance that year. Its sales grew, but slowly compared with its spending, and its losses grew much faster.
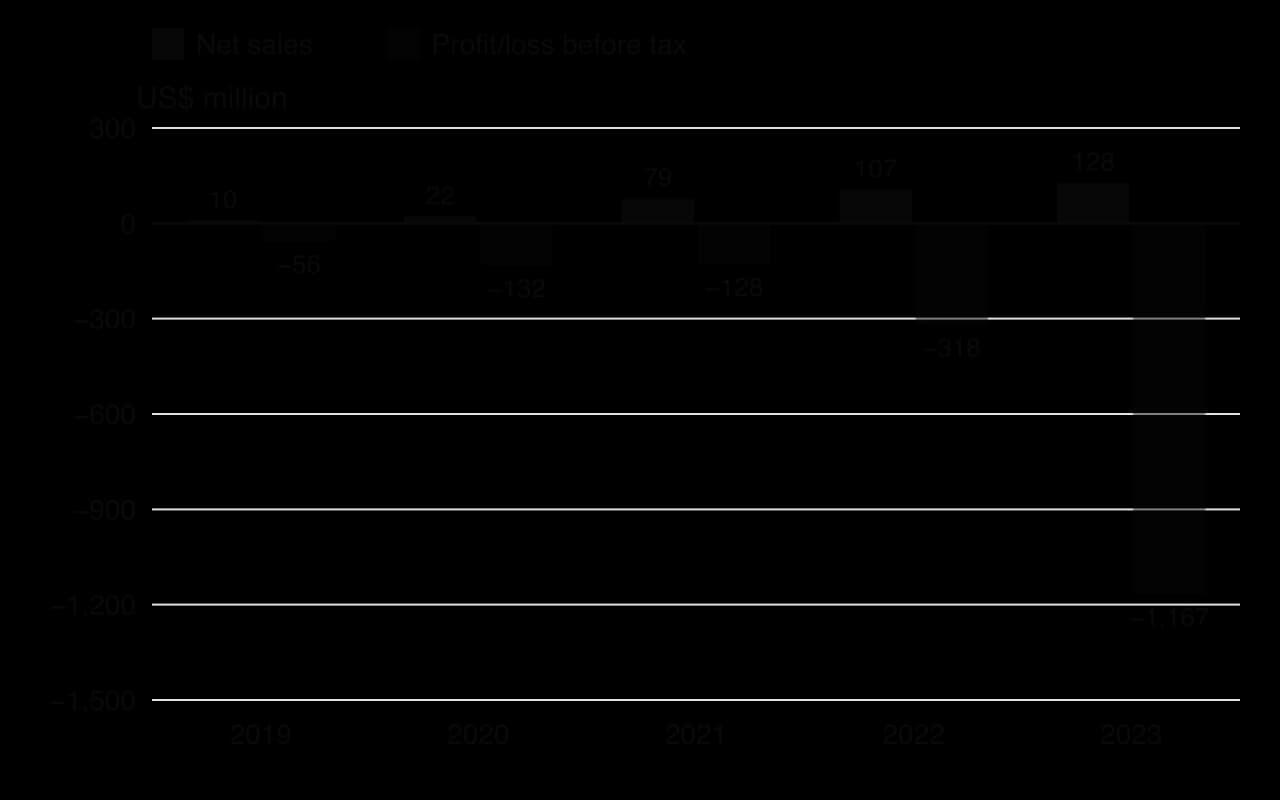
The company's cash flow statement shows where the cash went. Its day-to-day operations used cash, because production was still being ramped up and stock had to be built; its investing activities used even more, mainly for new plant and equipment; and borrowing and new capital filled the gap. In 2023 the inflow from financing was smaller than the outflows from operations and investment, so its cash balance fell by about $400 million.
Northvolt group, consolidated cash flows (US$ million) | 2022 | 2023 |
|---|---|---|
Net cash flow from operating activities | (876) | (792) |
Net cash flow from investing activities | (616) | (1,168) |
of which: purchase of property, plant and equipment | (1,405) | (1,606) |
Net cash flow from financing activities | 2,034 | 1,551 |
Cash flow for the year | 543 | (409) |
Cash and cash equivalents at the end of the year | 2,550 | 2,134 |
Northvolt still held more than $2.1 billion of cash at the end of 2023, but it was spending cash much faster than its factories generated it. By late 2024 the company had missed some of its own production targets at Skellefteå and had cut back production, which delayed the revenue that was meant to repay its investment.
On 21 November 2024 Northvolt filed for Chapter 11 reorganisation in the United States. The filing showed about $30 million of cash, enough to support operations for only about a week, against debts of about $5.8 billion, and the filing gave the company access to about $245 million to keep operating while it restructured: about $145 million of its own cash held as collateral and $100 million of new financing from Scania, one of its largest customers.
The restructuring did not succeed. On 12 March 2025 Northvolt filed for bankruptcy in Sweden. Its board named rising capital costs, geopolitical instability, supply chain disruption and shifts in demand, together with internal problems in raising production, as the causes, and said the company had been unable to secure the finance it needed to continue in its current form.
Northvolt is a clear example of the relationship between investment, profit and cash flow. Each investment used cash immediately, while the profit it was meant to produce depended on factories reaching full output years later. As long as investors and lenders kept providing finance, the gap between operating and investing outflows and trading inflows was covered; when production fell behind plan and finance became harder to raise, the cash ran out within months. Demand for batteries existed, but Northvolt's operations could not turn its investment into cash inflows quickly enough.
The case also shows the limits of forecasts. Northvolt's plans assumed that output would rise on schedule; every month of delay meant more wages, interest and running costs paid without the matching sales. Its main strategies for dealing with the shortage (new loans, green finance and money from customers) were all forms of additional finance, and they came late. Its collapse affected many stakeholders: employees in Skellefteå and Västerås, the customers relying on its cells, the lenders and shareholders who had provided billions of dollars, and the many suppliers it owed money to.
The case has limits as an illustration. Northvolt was an unusually large and capital-intensive start-up, and its failure had technical as well as financial causes. Most small businesses with cash flow problems face shortages of thousands of dollars rather than billions, although the link between investment, delayed inflows and a cash shortage works in the same way.
Using the 2023 figures in the table, explain why Northvolt's cash balance fell even though it raised $1,551 million from financing activities.
Explain how delays in increasing production affected Northvolt's cash flow, its profit and its liquidity position.
Northvolt's operating and capital spending in 2023 was about $200 million a month. Discuss which strategies for dealing with cash flow problems were realistic for a business of this kind.
Sources: Northvolt AB, Sustainability and Annual Report 2023 (consolidated statement of cash flow, multi-year overview), and "Northvolt Sustainability and Annual Report 2023", 2 July 2024; Northvolt AB press releases, 21 November 2024 and 12 March 2025; Reuters, 22 November 2024.
A short calculation question often follows a definition.
Constructing a forecast is a common question in its own right.
Extended response questions on cash flow ask for a judgment between strategies.
Cash flow is the movement of money into and out of a business; net cash flow is total inflows minus total outflows, and closing balance = opening balance + net cash flow.
Profit is revenue minus costs over a period; it differs from cash flow because of credit sales and purchases, stock, capital expenditure, depreciation, loans and timing, so a profitable business can become insolvent.
Working capital = current assets − current liabilities; the working capital cycle is the time between paying for inputs and being paid for sales.
The liquidity position is the ability to pay short-term debts when due, judged with the current ratio and acid test ratio.
A cash flow forecast shows expected inflows, outflows, net cash flow and closing balances month by month in a standard layout; it warns of shortages but is only as reliable as its assumptions.
Investment uses cash before it adds to profit, and rapid growth can lead to overtrading.
Cash flow problems are dealt with by reducing outflows, improving inflows or finding additional finance; the best strategy depends on the cause, its duration, its cost and its effect on stakeholders.
I can explain why profit and cash flow differ, using credit, stock, capital expenditure and depreciation.
I can explain how a profitable business can become insolvent.
I can calculate working capital and explain the working capital cycle.
I can explain what a business's liquidity position means and how it is judged.
I can construct and complete a cash flow forecast in the standard layout, with negatives in brackets.
I can interpret a cash flow forecast and explain its limitations.
I can explain the relationship between investment, profit and cash flow, including overtrading.
I can evaluate strategies for reducing outflows, improving inflows and finding additional finance, and recommend one for a given business.
Using Table 1, calculate Kantelaar Scooters’s cumulative net cash flow from the V1 at the end of Q4 2025 (show all your working).
2 marks
Net cash flow per quarter (€000): Q1 600 − 1 400 = (800); Q2 1 350 − 1 700 = (350); Q3 2 400 − 2 200 = 200; Q4 3 600 − 2 900 = 700.
Cumulative: (800) + (350) + 200 + 700 = (€250 000), i.e. a negative €250 000.
Award [1] for correct working and [1] for the correct answer, shown as negative and with the € sign. Accept (€250) in €000.
Using Table 1, explain why the V1’s cash flow was negative in the first half of 2025 even though sales were growing.
4 marks
The V1 was in the introduction stage of its life cycle: sales were low (400 and 900 units), so inflows (€600 000 and €1 350 000) were small.
Outflows were high because of the heavy investment in production and the launch advertising campaign, so outflows exceeded inflows by €800 000 in Q1 and €350 000 in Q2.
Cash flow lags behind sales growth: stock must be produced and paid for before it is sold, and cycle shops may be given credit.
Net cash flow only became positive in Q3 (€200 000) as sales grew into the growth stage.
Award [1]–[2] for a general explanation of cash flow in the early stages of the product life cycle, with little use of Table 1.
Award [3]–[4] for an explanation that links the PLC stage to the inflows and outflows in Table 1.
Using Table 1, calculate the percentage increase in units sold between Q3 and Q4 2025, and comment on what it suggests about the V1’s position in its product life cycle.
4 marks
Sales grew by 50 % in one quarter, and by 500 % from Q1 to Q4, so the V1 has moved from introduction into the growth stage. Net cash flow is now positive and rising (€700 000 in Q4), but the product has not yet repaid its early cash outflows.
Award [1] for working and [1] for the correct answer. Award [1] for identifying the growth stage and [1] for a supporting comment using the data (e.g. rapid sales growth, positive but not yet cumulative cash flow).
Discuss whether Kantelaar Scooters should choose Option A or Option B for the V1 in 2026.
10 marks
Option A: cut the price to €1 200
For: brings the V1 close to competitors’ €900–€1 100, attracting price-sensitive commuters and gaining share quickly in the growth stage; higher volumes may bring economies of scale.
Against: revenue per unit falls by 20 %; if demand does not rise enough, cash inflows fall when the cumulative cash flow is still negative (€250 000); a lower price may weaken the premium image built on light weight and battery range; rivals could respond with their own cuts; raising the price later is difficult.
Option B: keep €1 500 and spend €400 000 on promotion
For: test rides let customers experience the product’s USP; influencer marketing targets commuters efficiently; maintains revenue per unit and the product’s premium positioning; good reviews can be amplified.
Against: €400 000 is a large outflow for a start-up whose cumulative cash flow is negative; returns from promotion are uncertain; influencer partnerships carry reputational risk; the price gap of €400–€600 to rivals may still deter many buyers.
Relevant tools: PLC (growth stage), the marketing mix, cash flow, possibly break-even analysis or Porter (differentiation vs cost leadership).
Possible conclusion: e.g. Option B fits a differentiated product with strong reviews, provided Kantelaar can finance the €400 000; or Option A if commuters are shown to be highly price-sensitive. Any well-supported conclusion can earn full marks.
Limitations: no data on how sensitive demand is to price, the expected effect of the promotion, Kantelaar’s cash balance or its unit costs.
Marks should be allocated according to the markbands below.
Additional guidance:
If only one option is discussed, even with balance, award a maximum of [5]; one option, one-sided, a maximum of [3].
A response that makes no use of the data or case details the question refers to cannot be awarded more than [4].
A response with no conclusion or judgement will typically not be awarded more than [6].
Markbands (10-mark extended response, Papers 1 and 2)
Marks | Level descriptor |
|---|---|
0 | The response does not reach the standard described below. |
1–2 | Little understanding of what the question demands. Business management tools and theories are barely used, or are irrelevant or inaccurate. Little or no reference to the stimulus material. No arguments are made. |
3–4 | Some understanding of what the question demands. Some use of tools and theories, but mostly inaccurate or not relevant. Use of the stimulus is superficial, often no more than the name of the organisation or person. Arguments are mostly unsubstantiated. |
5–6 | Understands what the question demands but addresses it only partially. Some relevant, accurate use of tools and theories. Some relevant use of the stimulus beyond names, but it does not effectively support the argument. Arguments are substantiated but mostly one-sided. |
7–8 | Mostly addresses what the question demands. Mostly relevant, accurate use of tools and theories. The stimulus generally supports the argument, with some lapses in clarity or relevance. Arguments are substantiated and show some balance. |
9–10 | Clear focus on what the question demands. Relevant, accurate use of tools and theories. Relevant stimulus material is integrated effectively to support the argument. Arguments are substantiated and balanced, and the limitations of the case or stimulus material are explained. |
A response with no judgement or conclusion is unlikely to reach the top band of a discuss, evaluate, examine or recommend question.
Hayate Robotics, a company in Osaka, Japan, launched a robot vacuum cleaner two years ago. Sales doubled last year and the product is now profitable, yet the finance director warns that the product still uses more cash than it brings in.
Explain two reasons why a product in the growth stage of its life cycle, such as Hayate Robotics’ robot vacuum cleaner, may have a negative net cash flow even though it is profitable.
4 marks
Tumaini Wholesale Ltd, based in Nairobi, Kenya, distributes solar lanterns and phone chargers to about 900 small shops across East Africa. Almost all its sales are on credit, and its stated credit terms are 45 days. In 2025 Tumaini’s sales revenue was KES 146 million, and at the end of the year its debtors were KES 24 million. Several shop owners in rural areas pay only when the Tumaini sales representative visits them in person.
Calculate Tumaini’s debtor days for 2025 (show all your working).
2 marks
Explain two ways in which Tumaini could reduce its debtor days.
4 marks