Notes on 3.6 Efficiency ratio analysis
Learning objectives
Define efficiency ratio, insolvency and bankruptcy.
Calculate stock turnover, in number of times and in number of days, using average stock.
Calculate debtor days and creditor days.
Calculate the gearing ratio and explain what high and low gearing mean for a business and its stakeholders.
Explain what each efficiency ratio shows, and comment on it over time and against other businesses.
Evaluate strategies to improve the efficiency ratios and to change the gearing ratio.
Distinguish between insolvency and bankruptcy, and explain administration and liquidation.
Introduction
Profitability and liquidity ratios show whether a business earns enough profit and can pay its short-term debts. Efficiency ratios look at how the business manages the resources behind those results: how quickly it sells its stock, how quickly its customers pay, how long it takes to pay its suppliers, and how much it relies on long-term borrowing. Managers use them to find where cash is tied up and how much financial risk the business carries.
When these ratios deteriorate badly, a business can become insolvent, unable to pay its debts. China Evergrande, once the largest property developer in China, combined very heavy borrowing with stock that took years to sell, and in January 2024 a court in Hong Kong ordered it to be wound up. Efficiency ratios link to the key concepts. Borrowing heavily to grow quickly is a choice about change and risk, and paying suppliers late to save cash raises questions of ethics and of sustainability for the business and its supply chain.
What efficiency ratios measure
An efficiency ratio measures how well a business uses its assets and manages its liabilities. Three of the four ratios are measured in time, as a number of days or a number of times per year, because efficiency is largely about speed: how fast stock turns into sales, and how fast sales turn into cash.
The four ratios answer four different questions.
Ratio | Question it answers | Unit |
|---|---|---|
Stock turnover | How quickly does the business sell its stock? | Number of times a year, or number of days |
Debtor days | How long do customers who buy on credit take to pay? | Number of days |
Creditor days | How long does the business take to pay its suppliers? | Number of days |
Gearing ratio | How much of the business’s long-term finance is borrowed? | Percentage |
The first three ratios link closely to liquidity and the working capital cycle: slow-selling stock and slow-paying customers keep cash tied up, while paying suppliers later keeps cash in the business for longer. The gearing ratio links to long-term financial risk, because borrowed money must be repaid with interest whatever happens to profits.
The accounts used in the worked examples
The worked examples continue with Harbour Outdoor Ltd, a retailer of outdoor clothing and camping equipment (hypothetical data). In 2025 it opened two shops and began selling to sports clubs on 30-day credit terms. The figures needed come from its statement of profit or loss and statement of financial position.
Harbour Outdoor Ltd ($000) | 2025 | 2024 |
|---|---|---|
Sales revenue | 4,800 | 4,200 |
Cost of sales | 2,880 | 2,394 |
Opening stock (1 January) | 430 | 410 |
Closing stock (31 December) | 600 | 430 |
Debtors | 520 | 350 |
Trade creditors | 450 | 400 |
Non-current liabilities | 1,000 | 950 |
Equity | 1,850 | 1,650 |
Opening stock is the stock held at the start of the year, which is the same as the closing stock of the year before. Harbour Outdoor’s closing stock in 2024 ($430,000) is therefore its opening stock in 2025.
Stock turnover
Stock turnover measures how many times in a year a business sells and replaces its stock, or, put the other way round, how many days on average an item stays in stock before it is sold. Stock that sits on shelves or in warehouses ties up cash, takes up space, costs money to insure and may go out of date, perish or go out of fashion.
Stock levels change during the year, so the ratio uses average stock, the mean of the stock at the start and the end of the year. Using closing stock alone could give a misleading picture if the business happened to hold unusually little or much stock on the last day of the year.
Stock turnover can be expressed in two ways that give the same information. The number of times shows how often stock is sold and replaced in a year; the number of days, often shortened to stock days, shows the average time an item is held.
Both formulas use cost of sales, not sales revenue, because stock is valued at cost in the accounts. Dividing stock valued at cost by sales valued at selling prices would mix two different measures and make stock appear to sell faster than it does.
What a high or low stock turnover shows
In general, a higher number of times (fewer days) means stock is sold quickly, so less cash is tied up and there is less risk of stock losing value. A fall in stock turnover may mean that products are selling more slowly, that the business has bought too much, or that it has deliberately built up stock, for example before a busy season or to protect itself against supply problems.
The right level depends on the product. A supermarket sells fresh food that perishes within days, so it must turn its stock over very quickly. A luxury goods company holds handbags, jewellery and watches that keep their value, and may hold them for months. A property developer’s “stock” is land and unfinished buildings, which can take years to sell.
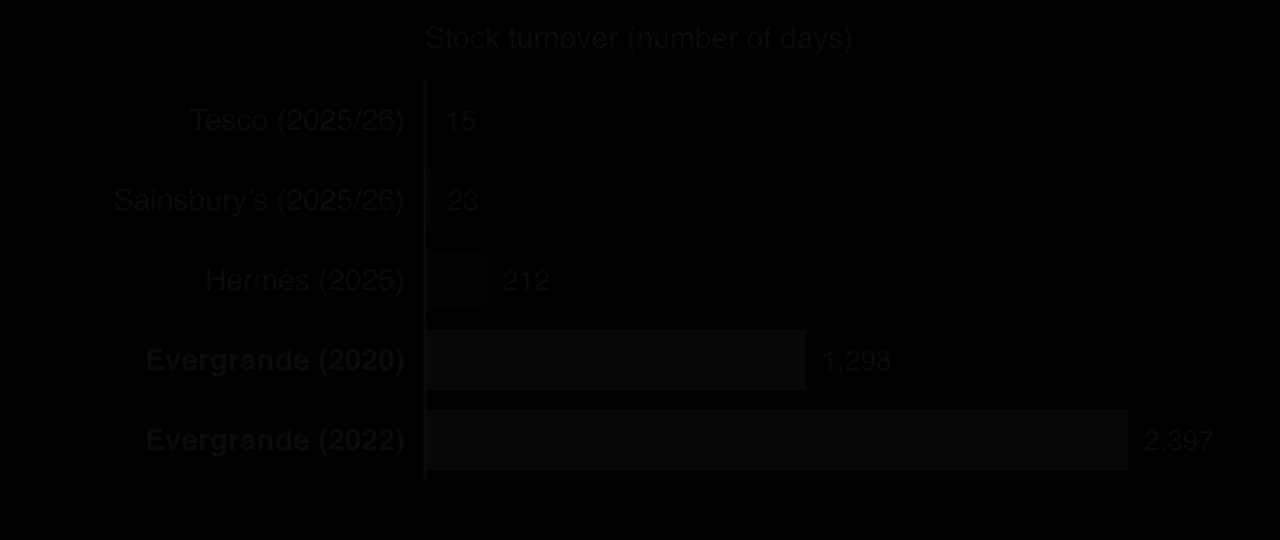
The chart compares stock turnover in days for five sets of accounts. Tesco held its stock for about 15 days on average in 2025/26 and Sainsbury’s for about 23 days. Hermès held its stock for about 212 days, which is normal for luxury goods made by hand in small numbers and sold at full price. Evergrande, whose stock was mainly unfinished and unsold property, took about 1,298 days in 2020 and about 2,397 days in 2022, more than six years, as buyers stopped buying.
Sources: Stock turnover calculated as average stock ÷ cost of sales × 365. Hermès: average stock €2,686m, cost of sales €4,623m (2025). Evergrande: stock includes properties under development and completed properties held for sale.
Strategies to improve stock turnover
A business improves its stock turnover by holding less stock for the same sales, or by selling the same stock faster.
Strategy | How it improves stock turnover | Risks and drawbacks |
|---|---|---|
Order smaller amounts more often, or use just-in-time stock control | Average stock falls while sales continue. | Needs reliable suppliers; a delay leaves shelves empty; small orders lose bulk discounts. |
Reduce the product range | Fewer slow-selling lines are held. | Less choice may drive some customers to rivals. |
Sell slow-moving or obsolete stock at a discount | Old stock is cleared and turned into cash. | Lower prices reduce the gross profit margin and may cheapen the brand. |
Improve sales forecasting and stock control systems | Stock is ordered to match expected demand. | Systems cost money; forecasts can still be wrong. |
Promote products to raise sales | The same stock sells faster. | Promotion costs money and may only bring sales forward. |
Faster stock turnover is not always better. A business that holds too little stock risks running out, losing sales and disappointing customers. Many manufacturers learned during the supply chain disruptions of the early 2020s that holding some extra stock, buffer stock, can be worth its cost. The aim is to hold enough stock to meet demand reliably while keeping the cost of holding it low.
Debtor days
When a business sells on credit, the customer receives the goods now and pays later. Until it pays, the customer is one of the business’s debtors. Debtor days measures the average number of days the business waits to be paid.
Debtor days is compared with the credit terms the business offers. If it gives customers 30 days to pay and debtor days is 45, many customers are paying late. A rising figure is a warning: cash that should be in the bank is held by customers, and some of those debts may never be paid.
Debtor days depends on how a business sells. Supermarkets sell almost entirely for cash or card payments at the till, so they have very few trade debtors: Tesco’s trade receivables of £636 million amounted to about 3 days of its sales revenue in 2025/26. A business selling machinery to other firms on 60- or 90-day terms will have far higher debtor days without being badly managed.
Sources: Tesco PLC, Annual Report and Financial Statements 2026 (trade receivables £636m; sales revenue £73,712m).
Strategies to reduce debtor days
Shorten credit terms, for example from 60 to 30 days. Customers may move to a competitor that offers longer terms.
Offer a discount for early payment, such as 2% off for payment within 10 days. Cash arrives sooner, but the discount reduces revenue and profit.
Improve credit control: check customers’ credit history before giving credit, send invoices promptly, send reminders and charge interest on late payments. This costs staff time and can upset customers.
Use factoring: sell the debts to a factoring company for an immediate payment of most of their value. The factor charges a fee, and some customers dislike being chased by a third party.
Sell only for cash or by card, or ask for deposits. This suits consumer sales but is rarely possible when selling to other businesses.
Each strategy trades cash now against sales or profit. A business in a competitive market, or one that is trying to win new customers, may have to accept longer credit periods than it would like. Credit terms are therefore a marketing decision as well as a financial one.
Creditor days
A business that buys on credit owes money to its suppliers, its creditors. Creditor days measures the average number of days the business takes to pay them. Taking longer to pay keeps cash in the business for longer, so creditor days is the mirror image of debtor days.
The formula uses cost of sales because creditors are mostly the suppliers of the goods and materials that make up cost of sales. A higher figure helps the business’s cash position, but only up to a point: suppliers who are paid late may refuse further credit, demand cash on delivery, charge higher prices or stop supplying altogether.
Large retailers often have high creditor days because of their buying power. Tesco’s trade payables of £6,862 million in February 2026 were equal to about 37 days of its cost of sales. Some of its suppliers use supplier finance schemes, in which a bank pays the supplier early and Tesco later pays the bank: in February 2026, suppliers had chosen to be paid early on £679 million of the amounts Tesco owed them.
Sources: Tesco PLC, Annual Report and Financial Statements 2026, note 20 (trade payables £6,862m; cost of sales £68,174m including insurance service expenses).
Strategies to change creditor days
A business can raise creditor days by negotiating longer credit terms with suppliers, by switching to suppliers who offer longer terms, or by paying invoices on the last permitted day instead of early. These strategies keep cash in the business but have costs.
Supplier relationships: suppliers paid late may give lower priority to the business’s orders or offer worse prices.
Lost discounts: some suppliers offer a discount for prompt payment, which is lost by paying later.
Ethics: large buyers that delay payment can push small suppliers into cash flow problems of their own. Several governments, including the UK’s, require large companies to publish how quickly they pay their suppliers, because late payment harms small businesses.
Reputation: a business known as a slow payer may find it harder to win credit when it needs it.
A business with healthy cash may choose the opposite strategy and pay faster than it must, to win discounts or to secure the loyalty of key suppliers. The best level of creditor days balances the business’s own cash needs with the health of its supply chain.
Putting the three ratios together
Stock days, debtor days and creditor days describe one cycle. Stock arrives, waits to be sold, is sold on credit, and the cash arrives when the customer pays. Meanwhile the supplier has to be paid. The longer stock waits and customers take to pay, and the sooner suppliers are paid, the longer cash is tied up.
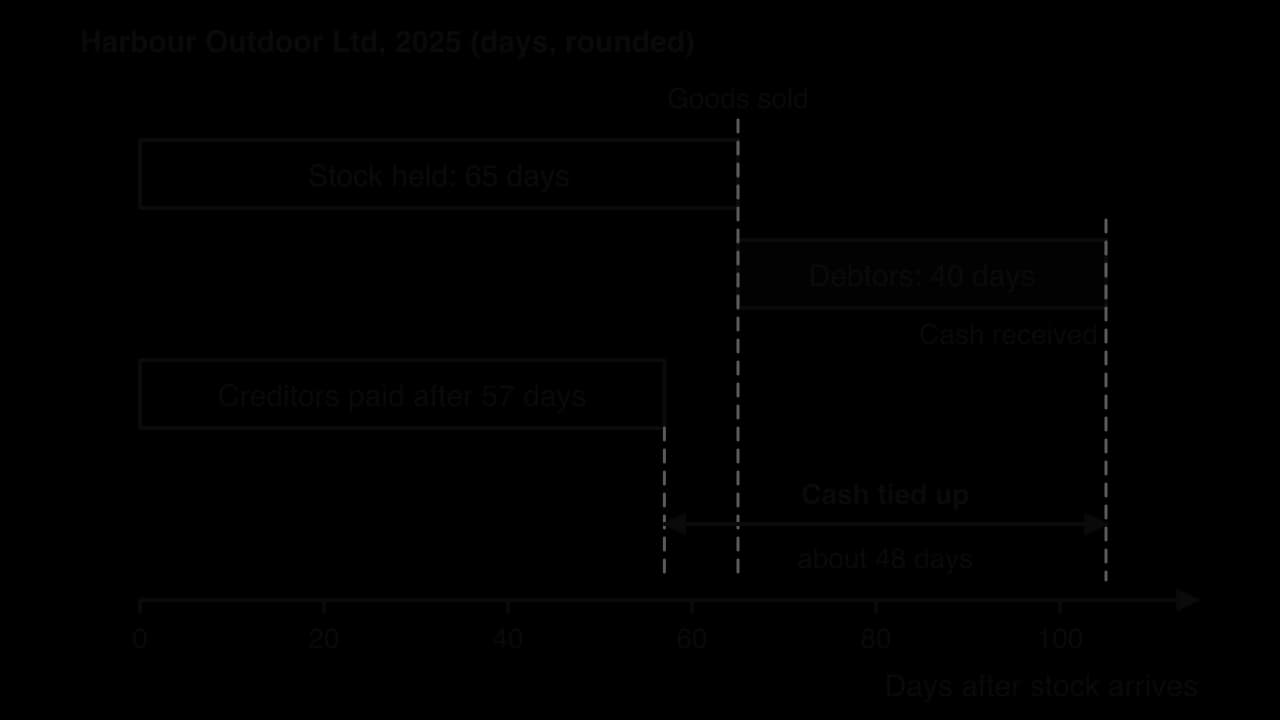
The time line shows the gap for Harbour Outdoor in 2025: about 65 + 40 − 57 = 48 days; in 2024 it was about 64 + 30 − 61 = 33 days. The longer gap explains why its overdraft grew. Supermarkets are at the other extreme: they sell stock within two or three weeks, are paid at once and pay their suppliers after several weeks, so their suppliers in effect finance their stock.
Gearing ratio
Businesses finance their non-current assets and working capital from two long-term sources: equity (share capital and retained earnings) and long-term borrowing (loans, bonds and other non-current liabilities). Together these make up capital employed. The gearing ratio shows what percentage of capital employed is borrowed.
A common guide is that gearing above 50% is high, between 25% and 50% is medium, and below 25% is low. On this scale Harbour Outdoor’s gearing is medium, while both supermarkets and Evergrande in 2020 sat just inside the high band. A highly geared business depends heavily on lenders; a business with low gearing is financed mainly by its owners.
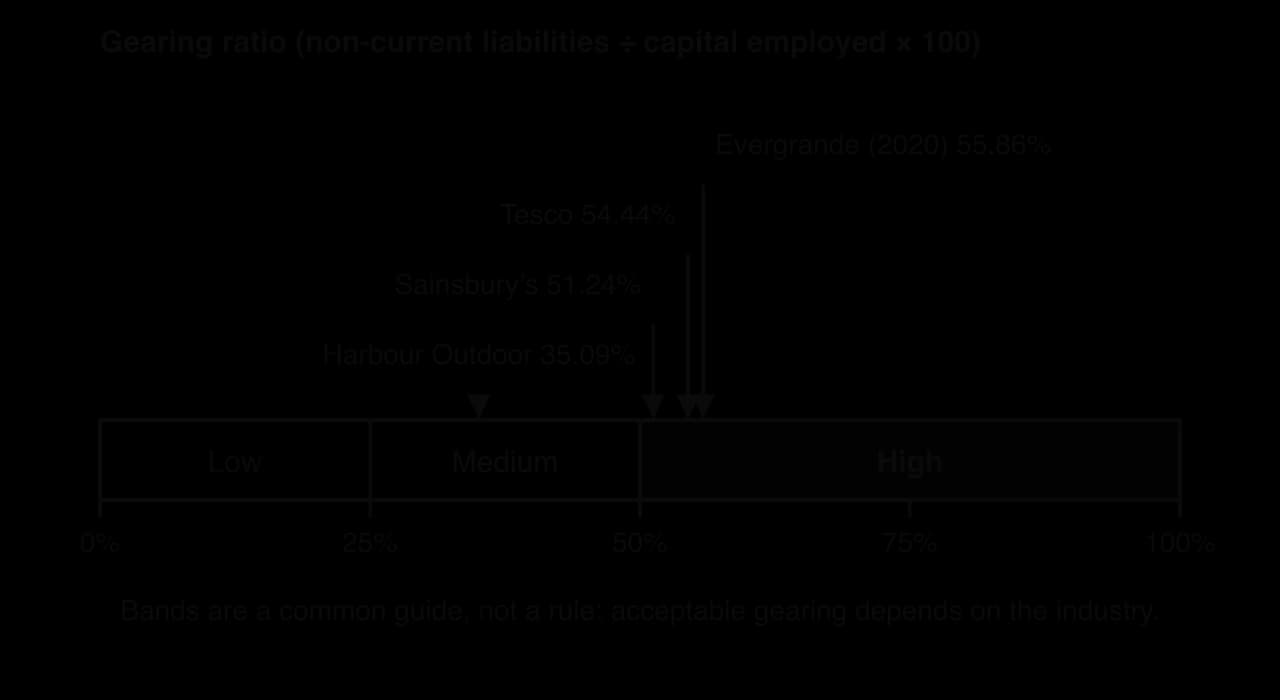
Why gearing matters: risk and reward
Borrowing is not bad in itself. Loans are often cheaper than equity, interest is usually allowed as a cost against tax, and lenders do not share in the profits or the control of the business. But interest must be paid, and loans repaid, whether the business is doing well or badly. Gearing therefore magnifies both good and bad results for shareholders.
High gearing is therefore riskier when profits are unstable, when interest rates may rise (on variable-rate loans) or when the economy may slow down. It is more acceptable for businesses with steady, predictable cash flows, such as utilities or supermarkets, and with assets that lenders accept as collateral, such as property. Low gearing is safer and leaves room to borrow in future, but it may mean the business is missing profitable opportunities that borrowed money could fund.
Stakeholder | View of high gearing |
|---|---|
Shareholders | Higher returns when profits are good, but greater risk of losses and of lenders taking control if loans are not repaid. |
Lenders (banks, bondholders) | A higher risk of default, so they may refuse new loans or charge higher interest. |
Managers | More pressure to generate cash to pay interest; less freedom to invest or to survive a downturn. |
Employees and suppliers | Greater risk that the business fails, with lost jobs and unpaid bills. |
What the gearing ratio leaves out
The gearing ratio uses only non-current liabilities, so it can understate the risk of a business that borrows short term. A loan that is due within a year is a current liability and does not appear in the ratio, even though it must be repaid soon. When a business breaks the terms of its loans, lenders may also demand immediate repayment, and the loans are then reclassified from non-current to current liabilities. As a result, the gearing ratio can fall when the business is in greatest danger.
Non-current liabilities also include items other than loans. Under international accounting rules, businesses that rent stores, warehouses or aircraft record the future rent as lease liabilities. This is why the supermarkets’ gearing looks high: Sainsbury’s non-current liabilities of £6,462 million in February 2026 included £5,035 million of lease liabilities and only £981 million of long-term borrowings. Comparing gearing between businesses that own their property and those that lease it therefore needs care.
Sources: J Sainsbury plc, Annual Report and Financial Statements 2026 (non-current lease liabilities £5,035m; long-term borrowings £981m).
Strategies to change the gearing ratio
To reduce gearing, a business needs less long-term debt or more equity.
Issue new shares and use the money to repay loans. This lowers interest costs, but existing shareholders’ control is diluted and new shareholders expect dividends.
Retain more profit instead of paying dividends. Equity grows and gearing falls without new debt, but shareholders receive less now.
Sell assets, including through sale and leaseback, and use the cash to repay debt. The business may lose assets it needs, and leases add new liabilities.
Convert debt into equity, offering lenders shares instead of repayment, as often happens in a restructuring. Existing shareholders’ stake is greatly diluted.
A business might also want to raise its gearing, for example when interest rates are low, when it has a profitable project to fund, or when its owners do not want to give up control by issuing shares. Borrowing is then a way of growing faster, provided profits are reliable enough to cover the interest.
Evaluation: improving efficiency and gearing
Strategies to improve the efficiency ratios share a pattern. Each one frees cash or reduces risk, and each has a cost in sales, profit, relationships or control. The table summarises the main trade-offs.
Aim | Typical strategy | Who gains | Who may lose | Main trade-off |
|---|---|---|---|---|
Faster stock turnover | Smaller, more frequent orders; clearing slow stock | The business (less cash tied up); lenders | Customers (less choice, stock-outs); suppliers (smaller orders) | Cash and lower costs against lost sales and lost bulk discounts |
Lower debtor days | Shorter credit terms; early payment discounts; factoring | The business’s cash position | Customers; profit (discounts, factoring fees) | Cash now against sales and margin |
Higher creditor days | Negotiate longer terms; pay on the last day | The business’s cash position | Suppliers, especially small ones | Cash now against supplier goodwill and ethics |
Lower gearing | Issue shares; retain profit; repay debt | Lenders; long-term security | Existing shareholders (dilution, lower dividends) | Lower risk against lower returns and control |
Which strategy is right depends on the business and its situation:
The type of business and industry: a supermarket, a luxury brand and a construction firm have very different normal levels for every ratio, so a strategy should aim at what is normal and sustainable for the industry.
The cause of the problem: rising debtor days caused by one large slow-paying customer needs a different response from a general weakening of credit control.
Market power: a large buyer can demand longer credit terms from suppliers; a small business usually cannot.
The economy and interest rates: when interest rates rise, high gearing becomes more expensive and riskier; in a recession customers pay more slowly and stock sells less quickly.
Objectives and time frame: a business focused on survival will put cash first; one aiming for growth may accept higher stock, longer credit and more debt for a while.
Efficiency ratios are best used together and over several years. A business whose stock days and debtor days are rising while creditor days fall, as at Harbour Outdoor, is heading towards a cash shortage even if its profits look healthy. Spotting that pattern early, before an overdraft limit is reached, is the main value of efficiency ratio analysis.
Insolvency versus bankruptcy
When a business cannot pay its debts, it is insolvent. Insolvency is a financial condition; what happens next depends on the law of the country and on the decisions of the business, its creditors and the courts. Bankruptcy, liquidation and administration are legal processes that may follow.
There are two tests of insolvency. A business is cash-flow insolvent if it cannot pay its debts when they are due, even if its assets are worth more than its debts; this is the “profitable but insolvent” case, in which profit exists on paper but cash has run out. It is balance-sheet insolvent if its total liabilities are greater than its total assets, which means its equity is negative. A business can be insolvent on one test and not the other, and many fail on both.
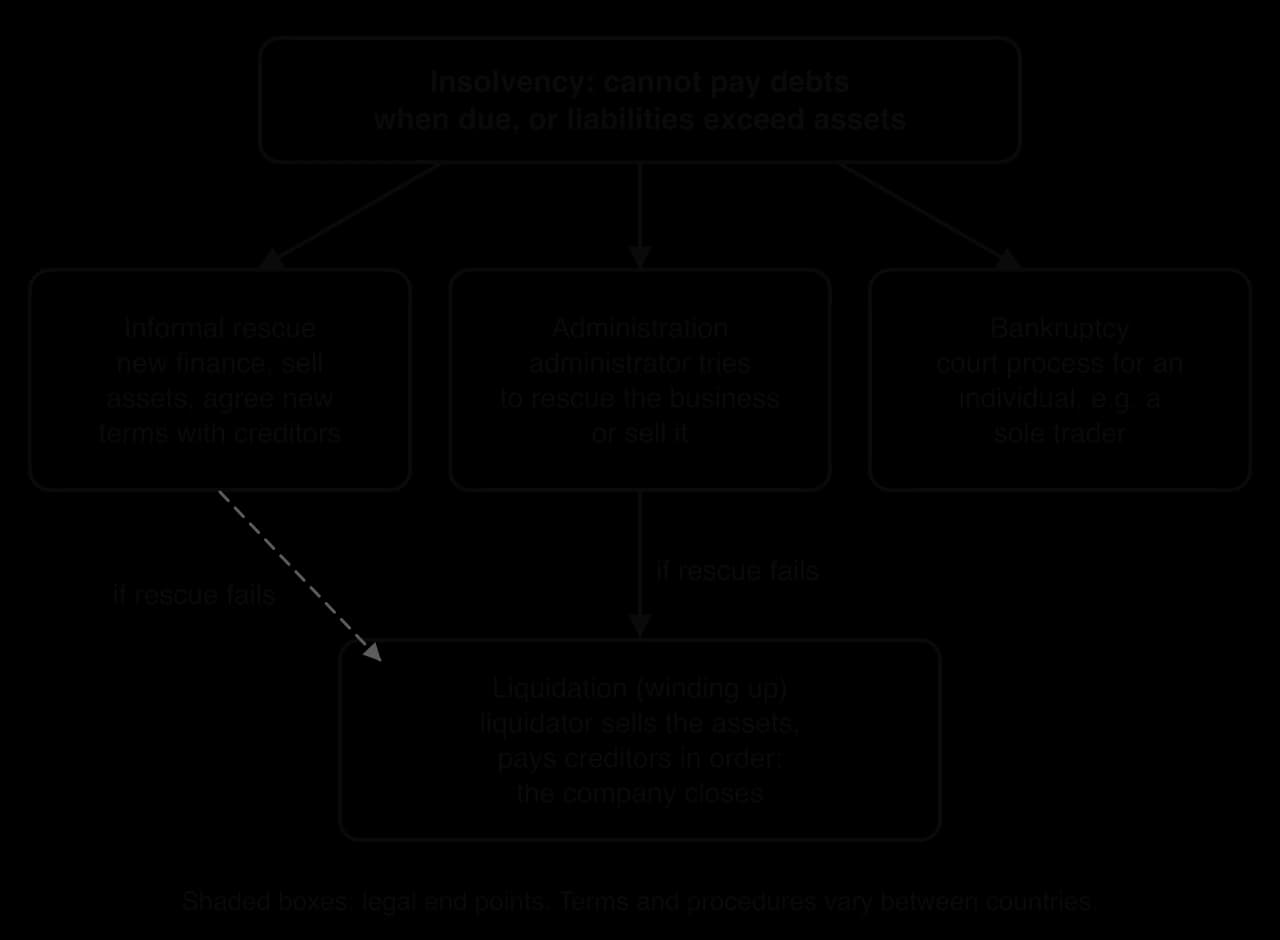
As the diagram shows, an insolvent business does not always close. It may be rescued informally, by raising new finance, selling assets or agreeing new terms with its creditors. If that fails, a formal process begins.
Wilko, a UK chain of about 400 discount household stores, went into administration on 10 August 2023, with PwC appointed as administrators. No buyer was found for the whole business. The administrators sold 51 stores to B&M, 71 to Poundland and the brand and website to The Range for £5 million; the remaining stores closed by 8 October 2023, and more than 12,000 jobs were lost, so administration saved parts of the business but not the company itself.
Sources: BBC News, 10 August and 8 October 2023; The Guardian, 3 August and 28 November 2023.
In liquidation, secured lenders and certain preferential creditors such as employees owed wages are paid first, then unsecured creditors such as suppliers, and shareholders last. Because a company has limited liability, shareholders lose at most the money they invested; the owners’ personal assets are safe. Liquidation may be voluntary, decided by the shareholders, or compulsory, ordered by a court when a creditor petitions because it has not been paid.
The two terms are often confused. Insolvency is the financial state of not being able to pay debts; bankruptcy is a legal declaration made by a court. In the United Kingdom and many Commonwealth countries, bankruptcy applies only to individuals, including sole traders and partners with unlimited liability, whose personal assets can be sold to pay business debts. Companies there are liquidated rather than made bankrupt. In the United States, “bankruptcy” also covers companies: Chapter 11 is a process for reorganising a company and Chapter 7 for liquidating it.
Insolvency | Bankruptcy | |
|---|---|---|
What it is | A financial condition: cannot pay debts when due, or liabilities exceed assets | A legal status declared by a court |
Who | Any person or organisation | Individuals (and, in some countries, businesses) |
Decided by | The facts of the accounts and cash position | A court, after a petition by the debtor or a creditor |
Possible outcomes | Recovery, informal rescue, administration, liquidation or bankruptcy | Assets sold to pay creditors; restrictions on the person for a period |
Can it be temporary? | Yes: a business can return to solvency | Usually ends after a set period, but the assets are lost |
Case study: China Evergrande Group
China Evergrande Group was a Chinese property developer, listed on the Hong Kong Stock Exchange in 2009. It grew by buying land, building apartments and selling many of them before they were finished, using the buyers’ deposits and large amounts of borrowing to fund the next project. It became China’s biggest property developer, with a stock market value of more than US$50 billion at its peak and some 1,300 projects under development in 280 cities, as well as an electric carmaker and a football club.
In 2020 the Chinese government introduced new rules, known as the “three red lines”, to limit borrowing by property developers. Developers were expected to keep liabilities (excluding advance payments from home buyers) below 70% of assets, net debt below 100% of equity and cash at least equal to short-term debt. On its own 2020 accounts, Evergrande failed all three tests: about 83%, about 153% and about 0.5 times respectively.
China Evergrande Group (RMB million) | 31 December 2020 | 31 December 2022 |
|---|---|---|
Sales revenue | 507,248 | 230,067 |
Cost of sales | 384,643 | 205,080 |
Stock (properties under development, completed properties, inventories) | 1,406,739 | 1,239,510 |
Trade and other payables | 829,174 | 1,002,264 |
Cash and cash equivalents | 158,752 | 4,334 |
Current liabilities | 1,507,253 | 2,352,923 |
Non-current liabilities | 443,475 | 84,489 |
Equity | 350,431 | (599,074) |
Gross profit margin | 24.17% | 10.86% |
Stock turnover (days) | 1,297.56 | 2,396.87 |
Creditor days (trade and other payables) | 786.83 | 1,783.82 |
Current ratio | 1.26 | 0.71 |
Sources: China Evergrande Group, Announcement of results for the year ended 31 December 2020 (31 March 2021); Annual Report 2022 (17 July 2023). Ratios calculated from the published statements; stock turnover uses average stock with opening stock from the previous year.
What the ratios showed before the collapse
The 2020 figures already showed a business under strain. Its gearing of 55.86% was high, and it understated the risk: a further RMB 335,477 million of borrowing was due within a year and so appeared in current liabilities, not in the gearing ratio. The acid test ratio of 0.33 showed that, without selling its property, Evergrande had only 33 fen of liquid assets for each yuan of short-term debt. Stock turnover of almost 1,300 days meant that its main asset took around three and a half years to turn into sales.
Creditor days were also extreme. Trade and other payables, much of them owed to construction firms and materials suppliers, equalled about 787 days of cost of sales in 2020. In effect, Evergrande was financing its building programme partly by not paying its suppliers, which shifted its risk onto thousands of smaller firms in its supply chain.
From illiquidity to insolvency
Once new borrowing was restricted, Evergrande could not refinance debts as they fell due. It offered its apartments at large discounts to raise cash, which reduced its gross profit margin, and its sales revenue fell by more than half between 2020 and 2022. In December 2021, after missing payments on its US dollar bonds, it was declared in default by credit rating agencies. Its lenders could then demand repayment, so almost all its borrowings were classed as current liabilities.
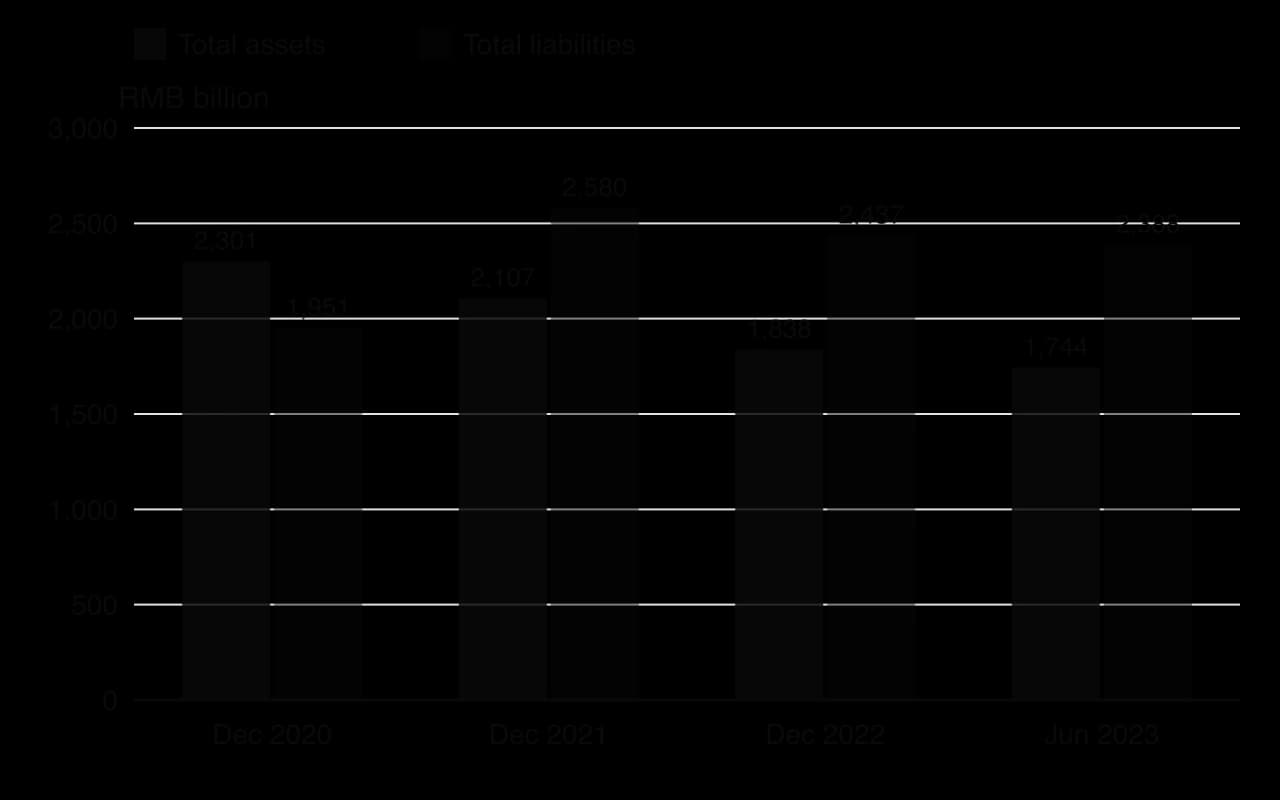
The chart shows the move from a business with positive equity in 2020 to one whose liabilities exceeded its assets by RMB 599,074 million at the end of 2022 and by about RMB 644,203 million in June 2023. At that point the gearing ratio stops making sense: capital employed (non-current liabilities plus a large negative equity) is itself negative, so the formula gives a negative percentage. Evergrande’s own published “gearing ratio”, defined as total borrowings divided by total assets, was 33.3% at the end of 2022 and looked moderate. The difference between the two figures shows that a ratio must be read with its definition and the full accounts.
At the end of 2022 Evergrande held total cash, including restricted cash, of RMB 14,305 million against RMB 587,123 million of borrowings due within a year. Its auditor declined to give an opinion on the 2022 accounts, citing material uncertainty over whether the group could continue as a going concern.
Liquidation
On 29 January 2024 the High Court of Hong Kong made a winding-up (liquidation) order against China Evergrande Group, on a petition by Top Shine Global, a creditor owed HK$862.5 million. The judge described the company as “grossly insolvent” and found that creditors would be better protected if it were wound up, because it had put forward no viable restructuring proposal with creditors’ support, more than eighteen months after the petition was presented. Liquidators from Alvarez & Marsal were appointed to take control and sell assets for the creditors.
The liquidation shows the limits of the process. Much of Evergrande’s property was held by subsidiaries in mainland China, and most of its assets had already been sold, pledged to lenders or frozen when the order was made. In August 2025 the liquidators reported that the company’s debts stood at about US$45 billion and that only US$255 million of assets had been sold. Evergrande’s shares were removed from the Hong Kong Stock Exchange on 25 August 2025. In March 2024 Chinese regulators fined the founder, Hui Ka Yan, US$6.5 million and banned him from the capital markets for life, for the company overstating its revenue by about US$78 billion, so even the figures in its earlier accounts cannot be fully trusted.
 YouTube
What the case shows
Evergrande shows how efficiency ratios can give early warning of trouble long before a business fails. High gearing, a very slow stock turnover and very long creditor days together meant that the business needed a constant flow of new borrowing and new deposits to survive; when that flow stopped, insolvency followed quickly. The case also shows the limits of ratio analysis: the gearing ratio excluded short-term debt and became meaningless once equity was negative, and the published accounts were later found to be inaccurate.
Explain why Evergrande’s gearing ratio of 55.86% in 2020 understated its financial risk.
Using the data, analyse how slow stock turnover and long creditor days affected Evergrande’s stakeholders.
Distinguish between Evergrande being insolvent and being liquidated, using the case.
Sources: China Evergrande Group annual results 2020 and Annual Report 2022; Re China Evergrande Group [2024] HKCFI 363 (High Court of Hong Kong, 29 January 2024); Reuters, 17 December 2021; BBC News, 25 August 2025.
Exam practice
Typical questions ask you to calculate one or more ratios [2–4], to comment on them [2–4], to explain strategies to improve them [4], to distinguish insolvency from bankruptcy [2–4], and, in Section B, to evaluate a financing or efficiency strategy with the ratios as evidence [10].
Paper 3 is about a social enterprise, so ratio questions there are less common, but a plan of action may need to show that it is affordable and does not leave the enterprise over-borrowed.
Summary
Efficiency ratios measure how well a business manages its stock, debtors, creditors and long-term borrowing.
Stock turnover = cost of sales ÷ average stock (times), or average stock ÷ cost of sales × 365 (days); average stock = (opening + closing stock) ÷ 2.
Debtor days = debtors ÷ total sales revenue × 365; creditor days = creditors ÷ cost of sales × 365. Compare them with credit terms and with each other.
Gearing ratio = non-current liabilities ÷ capital employed × 100; above 50% is high, 25–50% medium, below 25% low as a common guide.
High gearing raises returns to shareholders in good years and the risk of failure in bad ones; the ratio ignores short-term debt.
Every strategy to improve these ratios trades cash or lower risk against sales, profit, stakeholder relationships or control.
Insolvency is being unable to pay debts; bankruptcy is a legal declaration by a court; insolvent companies may go into administration or liquidation.
Self-check
- To do:
I can define efficiency ratio, insolvency and bankruptcy.
- To do:
I can calculate average stock and stock turnover in times and in days.
- To do:
I can calculate debtor days and creditor days and compare them with credit terms.
- To do:
I can calculate the gearing ratio using capital employed = non-current liabilities + equity.
- To do:
I can explain why high gearing increases both returns and risk for shareholders.
- To do:
I can comment on each efficiency ratio over time and against other businesses.
- To do:
I can evaluate strategies to improve stock turnover, debtor days, creditor days and gearing.
- To do:
I can distinguish between insolvency and bankruptcy and explain administration and liquidation.