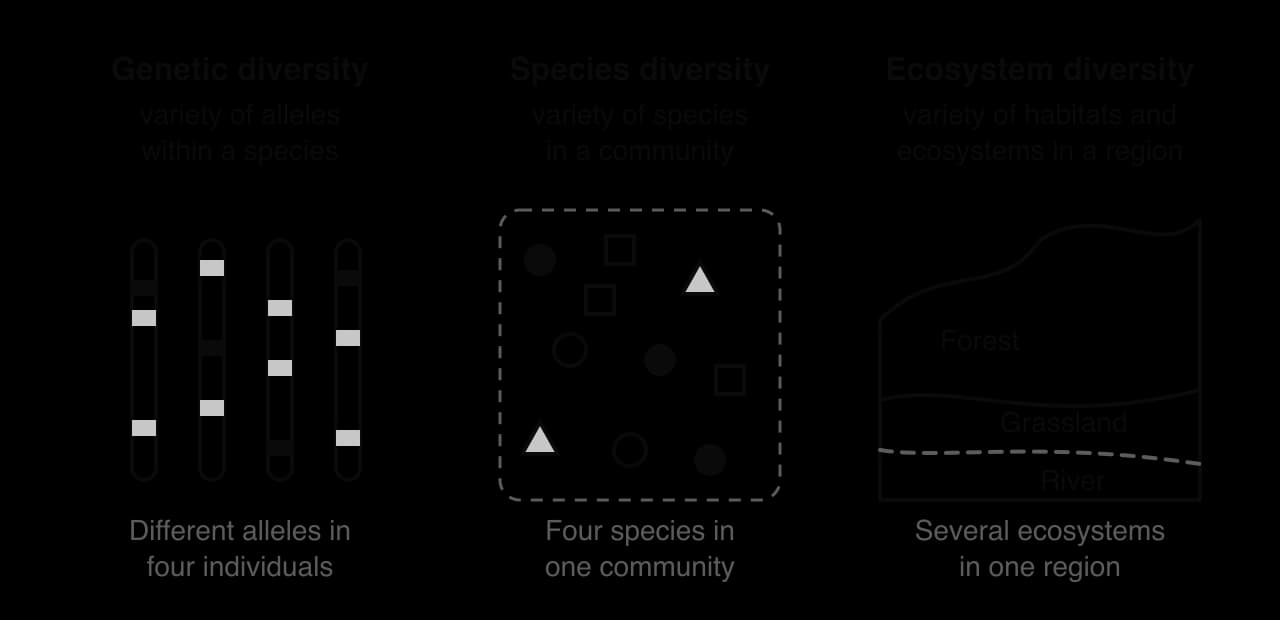
Explain biodiversity at three levels, the causes of extinction and ecosystem loss, the evidence for a biodiversity crisis (including Simpson's reciprocal index), and approaches to conservation.
Each is in the Biology glossary, with every other term in the subject.
Caused or produced by human activity, such as anthropogenic extinction or anthropogenic climate change.
The normal, low rate at which species become extinct between mass extinctions, estimated from the fossil record.
The variety of life in all its forms, levels and combinations, including ecosystem diversity, species diversity and genetic diversity.
The current rapid loss of biodiversity worldwide at the genetic, species and ecosystem levels, at rates far above the background rate, caused mainly by human activity.
Breeding animals of a threatened species in zoos or other controlled conditions, choosing mates to maintain genetic diversity, often to reintroduce them to the wild.
The collection of scientific data by members of the public, usually volunteers following a standard method, in projects designed and analysed by scientists.
The permanent removal of forest and its conversion to another land use, such as agriculture, plantations or urban development.
The variety of habitats, communities and ecosystems within a region.
Biodiversity is the variety of life on Earth, from the genes inside a single population to the full range of ecosystems on the planet. It provides food, medicines, clean water, pollination and a stable climate, and it is the product of more than 3.5 billion years of evolution.
Earth probably holds more species today than at any time in its history, but they are being lost much faster than the natural rate. Measuring that loss, understanding its causes and choosing how to slow it are the central questions of conservation biology.
37 exam-style questions on this subtopic, written in the style of the IB papers. The first has its markscheme open. Counted on
Which is an example of genetic diversity?
Genetic diversity is the variation in genes and alleles within a species, such as the different shell-colour alleles in one snail population. A describes species richness, which is part of species diversity. B describes ecosystem diversity. D describes evenness, the other component of species diversity.
The answer is C.
Which statements about the number of species on Earth are supported by current evidence?
I. Most species alive today have not yet been named and described.
II. Fossil evidence suggests that more species are alive now than at any time in the past.
III. More than half of all the species that have ever existed are alive today.
The official deck for this part of the syllabus.
Define biodiversity.
State the three levels of biodiversity.
With a free account, Augment remembers where you stopped and what you have practiced.
A species that is both Evolutionarily Distinct and Globally Endangered, and so is given priority for conservation by the EDGE of Existence programme.
A measure of how much unique evolutionary history a species represents, based on how few close relatives it has and how long ago its lineage separated from others.
The conservation of species outside their natural habitat, for example in zoos, botanic gardens or seed banks.
The permanent loss of a species, when its last individual dies.
The variety of alleles and genes within a species, both within a population and between populations of that species.
The clearing, draining, burning or fragmentation of a habitat so that it can no longer support the species that lived there.
The conservation of species in their natural habitat, for example by protecting and managing ecosystems in nature reserves and national parks.
A species moved by humans, deliberately or accidentally, to an area outside its natural range.
The International Union for Conservation of Nature's assessment of species' risk of extinction, placing each in a category from Least Concern to Extinct using standard criteria.
An event in which a large proportion of the Earth's species, usually 75% or more, become extinct in a geologically short time.
An area of land or water that is protected and managed for the conservation of its wildlife, habitats and natural features.
Harvesting a species by hunting, fishing, logging or collecting faster than its population can replace the individuals removed.
A facility that stores dried seeds at low temperature so that they remain viable for many years, conserving the genetic diversity of plant species and crop varieties.
An index of species diversity, , where N is the total number of individuals and n the number of each species; higher values mean greater richness and evenness.
The variety of species in a community, depending on both the number of species (richness) and how evenly individuals are distributed among them (evenness).
A measure of how similar the abundances of the different species in a community are; evenness is high when all species have similar numbers of individuals.
The number of different species present in a community or area.
Biodiversity (biological diversity) includes the variety within species, between species and between the ecosystems they form, as well as the number of species in an area.
Biologists recognise three levels of biodiversity, shown in the diagram of the three levels.
Genetic diversity is the variety of alleles and genes within a species, both within one population and between populations. Wild cabbage populations, for example, carry the alleles that breeders used to produce many vegetable varieties.
Species diversity is the variety of species in a community. It depends on the number of species present and on how evenly individuals are spread among them.
Ecosystem diversity is the variety of habitats, communities and ecosystems in a region, such as the forests, grasslands, wetlands, rivers and coasts of a country.
The three levels are linked. Each ecosystem contains its own community of species, and each species contains its own genetic diversity. Losing an ecosystem, such as a lowland forest, removes many species at once; losing populations of a species removes some of its genetic diversity even if the species survives. Genetic diversity matters because it is the raw material for natural selection: a population with many alleles is more likely to contain individuals that can survive a new disease or a change in climate.
About 2.1 million species have been formally described, and estimates of the total number of species of eukaryotes alone range up to about 8.7 million, most of them insects and other invertebrates in tropical forests and oceans. Counting prokaryotes would raise the total much higher. These numbers are uncertain because most species have never been collected.
The fossil record shows that biodiversity has risen over the history of life, though not steadily. Speciation has added species faster than extinction has removed them over most of the last 540 million years, so there are probably more species alive now than at any time in the past.
Five times in the last 500 million years, the rise in diversity was interrupted by a mass extinction, in which a large proportion of all species died out over a geologically short period. After each event, diversity recovered over millions of years as the surviving lineages underwent adaptive radiation into the empty niches.
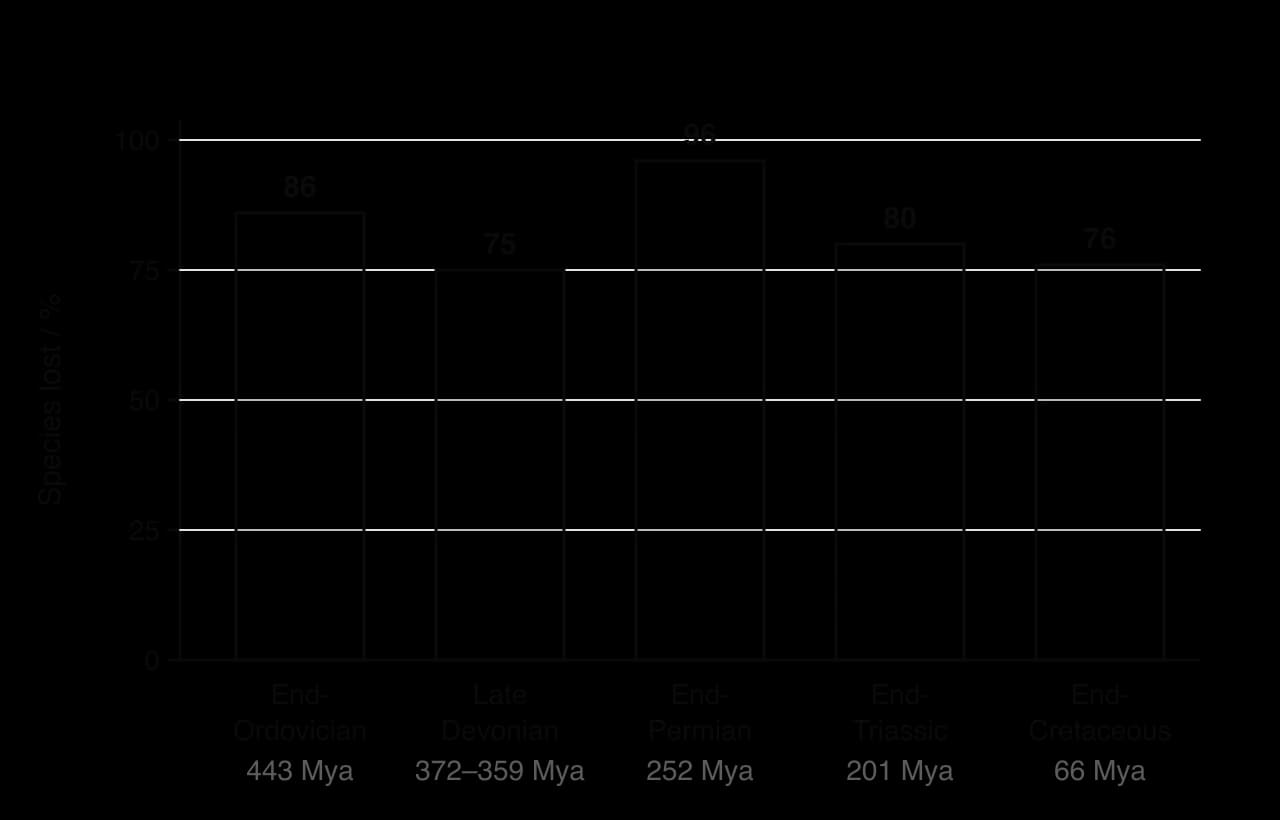
Mass extinction | Approximate date | Likely causes |
|---|---|---|
End-Ordovician | 443 million years ago | Global cooling and glaciation, causing sea levels to fall and shallow seas to drain |
Late Devonian | 372–359 million years ago | A series of events with low oxygen (anoxia) in the oceans, possibly linked to climate change |
End-Permian | 252 million years ago | Massive volcanic eruptions in Siberia, releasing CO₂ that caused global warming and ocean acidification |
End-Triassic | 201 million years ago | Volcanic eruptions as the supercontinent Pangaea split apart, causing climate change |
End-Cretaceous | 66 million years ago | An asteroid impact at Chicxulub, Mexico, plus volcanic eruptions in India; non-avian dinosaurs died out |
Extinction is a normal part of evolution. In the fossil record, species disappear at a low, fairly steady rate between mass extinctions, called the background extinction rate. Over geological time, a typical species survives for about one to ten million years.
The current rate of extinction is far higher. Recent estimates put it at least tens to hundreds of times above the average rate of the past 10 million years, and around 1 million species of animals and plants are threatened with extinction. Because the cause this time is human activity, many biologists describe the present as the start of a sixth mass extinction. It differs from the earlier five in its cause and its speed: the current rise in extinction rates has happened over a few centuries, not thousands of years.
 YouTube
An anthropogenic extinction is one caused by human activity. Most of the extinctions recorded in the last few centuries are anthropogenic, and they have five main causes:
Overexploitation: killing or harvesting organisms faster than they can reproduce, by hunting, fishing, logging or collecting.
Habitat destruction: clearing, draining, burning or fragmenting the habitats in which species live, for farmland, towns, roads, mines and dams.
Introduced species: species carried by humans to areas outside their natural range, where they can prey on, compete with or bring diseases to native species.
Pollution: chemicals, plastics, excess nutrients, noise and light released by human activity that poison organisms or alter their habitats.
Climate change: changes in temperature, rainfall and sea level caused by the release of greenhouse gases, which shift or remove the conditions that species are adapted to.
Species with certain characteristics are especially vulnerable: large body size, slow reproduction, small populations, a small geographical range (such as island species), specialised diets or habitats, and lack of fear of humans or of introduced predators. Several causes often act together, so that a species already reduced by hunting is then finished off by habitat loss or a new predator.
Moas were large flightless birds found only in New Zealand. There were nine species. The largest, the giant moas such as the North Island giant moa (Dinornis novaezealandiae), could reach about 3.6 m tall with the neck raised and weighed more than 200 kg. Before humans arrived, the only predator of adult moas was a giant eagle, Haast's eagle (Hieraaetus moorei).
Polynesian settlers, the ancestors of the Māori, reached New Zealand around 1280 CE. Radiocarbon dates of moa bones and eggshells show that all nine species were extinct by about 1400 CE, within about 150–200 years of human arrival. The causes were:
Overhunting. Moas were hunted for meat, and their eggs were collected. Archaeological sites contain the bones of very large numbers of moas.
Vulnerability. Moas had evolved without mammalian predators, so they probably had no fear of humans. They were slow to mature and laid few eggs, so their populations could not replace the birds that were killed.
Habitat destruction. Settlers burned large areas of forest in the drier eastern parts of the islands.
Introduced species. The Polynesian rat and dogs arrived with the settlers and may have taken eggs and chicks.
Haast's eagle became extinct at about the same time, because its main prey had gone. The extinction of the moas is one of the fastest well-documented extinctions of large animals caused by humans, and the human population at the time was probably only a few thousand people.
The Caribbean monk seal (Neomonachus tropicalis) lived on beaches, reefs and sandbanks around the Caribbean Sea, the Gulf of Mexico and the Bahamas. It was first recorded by Europeans in 1494, when sailors on Christopher Columbus's second voyage killed several of them for food.
Overhunting. From the 1700s onwards the seals were killed in large numbers for their blubber, which was boiled to make oil for lamps and lubrication, and for their skins and meat. Seals resting on beaches were easy to kill.
Overfishing. Commercial fishing reduced the fish and invertebrates the seals fed on.
Disturbance. Growing human activity on the coasts and islands disturbed the beaches where seals rested and gave birth.
The last confirmed sighting was a small colony at Serranilla Bank, between Jamaica and Nicaragua, in 1952. Surveys over the following decades found none, and the species was declared extinct in 2008. It is one of the very few marine mammals known to have been driven to extinction by humans in modern times.
Every region has its own examples of anthropogenic extinction. In the North Atlantic, the great auk (Pinguinus impennis) was a large flightless seabird that bred in dense colonies on rocky islands from Canada to Norway. Because it could not fly and came ashore to breed, it was easy to kill. Sailors and fishermen killed great auks in huge numbers for meat, feathers and oil, and, as the bird became rare, collectors paid high prices for skins and eggs. The last confirmed pair was killed on the island of Eldey, off Iceland, in June 1844.
Whole ecosystems can be lost as well as single species. When an ecosystem is destroyed or transformed, the community of species that depends on it is lost with it, along with the ecosystem services it provided, such as flood control, carbon storage or fisheries. The causes of ecosystem loss can be direct or indirect.
Direct causes remove or transform the ecosystem itself: deforestation by logging or clearing for agriculture, draining wetlands, building towns and roads, mining, damming and diverting rivers, and trawling the sea floor.
Indirect causes change the conditions an ecosystem depends on, often far from where the damage happens: climate change, acid rain, pollution of rivers by fertilisers (eutrophication), and the demand for products such as palm oil, soya and beef in distant countries.
The lowland rainforests of Borneo, Sumatra and the Malay Peninsula are dominated by trees of the family Dipterocarpaceae, so they are called mixed dipterocarp forests. They are among the tallest and most species-rich forests on Earth. The tallest known tropical tree, a yellow meranti (Shorea faguetiana) in the Danum Valley of Sabah, Borneo, was measured at 100.8 m in 2019. A single hectare of lowland dipterocarp forest can hold more than 200 species of tree. The forest is home to Bornean orangutans (Pongo pygmaeus), which are Critically Endangered, as well as hornbills, clouded leopards and thousands of species of insects.
Many dipterocarp trees reproduce by mast fruiting: every few years, most trees across a large area flower and fruit at the same time. The fruits are heavy and fall close to the parent tree, so the forest recovers slowly once it is cleared.
Measurement for Borneo | Value |
|---|---|
Forest cover in 1973 | About three-quarters of the island |
Forest cover in 2010 | About 53% of the island |
Loss of the 1973 forest area by 2010 | About 30% (about 168,000 km²) |
Industrial oil palm and timber plantations in 2010 | About 10% of the island |
Highest loss by region | Sabah, about 40% of its 1973 forest |
Source: Gaveau et al., PLoS ONE 9:e101654, 2014 (Landsat satellite images, 1973–2010).
The main causes of the loss are:
Logging. Dipterocarp timbers (meranti) are valuable for plywood and construction. Selective logging removes the largest trees and builds roads deep into the forest, and logged forest is much more likely to be cleared later.
Conversion to plantations. Large areas of logged and unlogged forest have been cleared for oil palm and fast-growing pulpwood trees. Malaysia and Indonesia produce most of the world's palm oil, which is used in foods, cosmetics and biofuels.
Fire. Clearing land by burning, especially in drained peat swamp forests during droughts, has caused huge fires, such as those in the El Niño year of 1997–1998.
Indirect demand. Much of the timber and palm oil is exported, so the loss is driven by consumption in other countries as well as by local population growth.
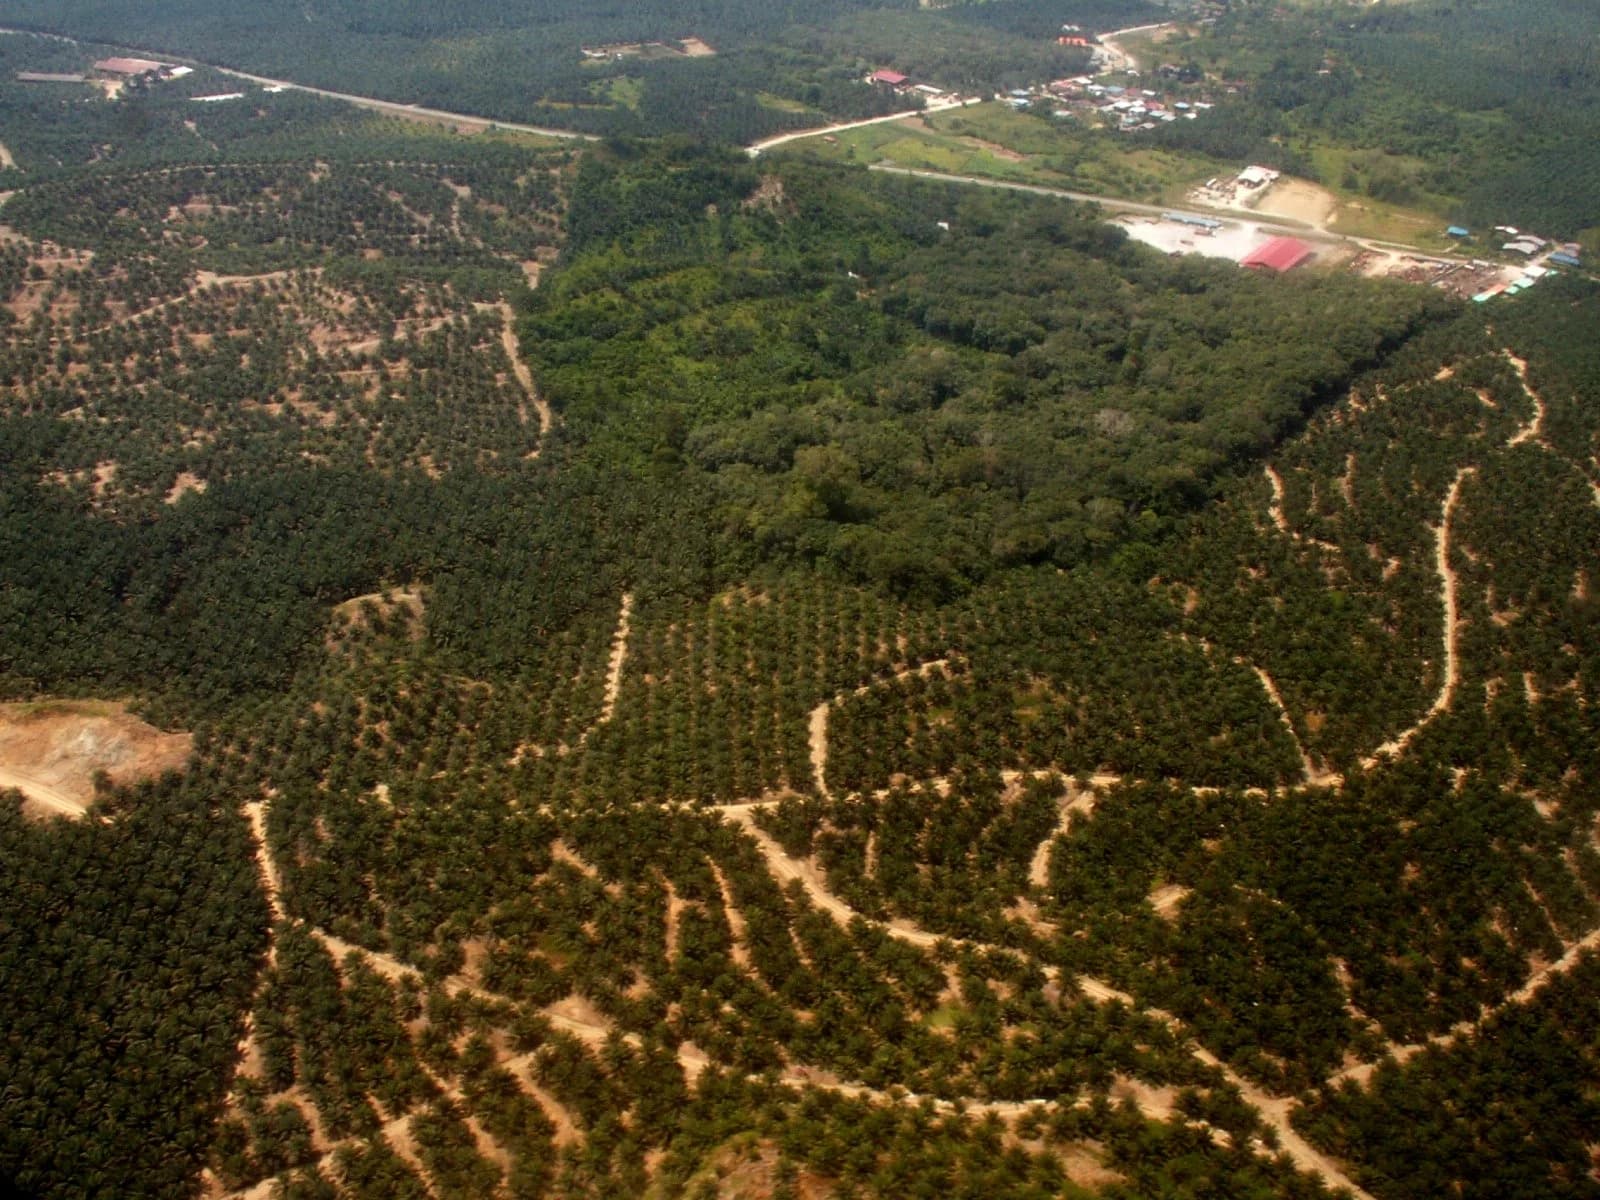
The remaining forest is also fragmented into small patches separated by plantations, as the aerial photograph of Sabah shows. Small fragments have more edge, are drier and hotter, and cannot support animals with large ranges, so they lose species even when the trees remain.
The Aral Sea, on the border of Kazakhstan and Uzbekistan, was once the fourth-largest lake on Earth. From the 1960s, the two rivers that fed it, the Amu Darya and the Syr Darya, were diverted to irrigate cotton and other crops in the surrounding desert. With far less water flowing in, the lake shrank, and by 2007 it covered only about a tenth of its 1960 area; the eastern basin of the southern Aral Sea dried out completely in 2014.
As the water evaporated, the remaining lake became saltier than the sea. Most of its native fish disappeared, the fishing industry collapsed, and the wetlands of the river deltas dried out. Winds now carry salt and dust contaminated with pesticides from the exposed lake bed onto farmland and towns. The Aral Sea is an example of ecosystem loss by an indirect cause, because the lake was destroyed by the diversion of its water supply far upstream rather than by direct clearance. In 2005 Kazakhstan completed the Kok-Aral Dam, which separated the northern part of the lake and allowed it to refill; water levels and fish populations in the North Aral Sea have since recovered in part.
A biodiversity crisis is a rapid, widespread loss of biodiversity at all levels. Claims that one is happening must be supported by reliable evidence from a range of sources: repeated surveys of the same places using the same methods, long-term population monitoring, and assessments that are checked and published by independent scientists.
Two communities with the same number of species can differ greatly in their diversity. Ecologists therefore measure two components:
Species richness is the number of different species in a community.
Species evenness is how similar the population sizes of the different species are. A community is even when each species has a similar number of individuals, and uneven when one or a few species dominate.
The diagram of two sites, each with four species, shows the difference. Both sites have the same richness. In site X each species has five individuals; in site Y one species has 17 individuals and the other three have one each. Site X is more diverse, because it has higher evenness: a randomly chosen pair of individuals is far more likely to belong to two different species.

Simpson's reciprocal index combines richness and evenness into one number. It is calculated from the number of individuals of each species found in a sample:
where N is the total number of individuals of all species and n is the number of individuals of each species. The lowest possible value is 1, when only one species is present. The value rises with both the number of species and the evenness of their abundances, and it is highest when all species are equally abundant. In a small sample this maximum is slightly greater than the number of species, so an evenly mixed sample of 20 individuals of four species gives a value above 4.
Repeating the same survey at the same sites over many years shows whether richness and evenness are falling. Long-term monitoring of this kind provides some of the strongest evidence for a biodiversity crisis, because it measures change directly instead of comparing different places.
Monitoring biodiversity over whole countries requires far more observations than professional scientists can make. Citizen science uses large numbers of volunteers to collect data.
The Audubon Society's Christmas Bird Count in North America has been run by volunteers every winter since 1900.
In the RSPB Big Garden Birdwatch, held in the United Kingdom every year since 1979, hundreds of thousands of people count the birds in their gardens for one hour. Its long record shows species such as the house sparrow and starling becoming much less common.
eBird, run by the Cornell Lab of Ornithology, collects bird sightings from volunteers worldwide through an app and website, with location, date and time.
Citizen science produces data over large areas and long periods at low cost, and it engages the public in conservation. Its reliability depends on the methods. Volunteers vary in skill at identification, they tend to survey places that are easy to reach, and more observers in some years can look like more birds. Projects reduce these problems by giving clear protocols (counting for a fixed time), training and identification guides, checking unusual records with experts, asking for photographs, and using statistical methods that account for the number of observers. This is an example of science as a shared endeavour, in which data from many people are combined to answer questions no single person could.
The most widely used evidence comes from large assessments that combine many studies and are reviewed by independent experts. The IUCN Red List of Threatened Species, produced by the International Union for Conservation of Nature, assesses the risk of extinction of each species using standard criteria such as population size, rate of decline and geographical range.
IUCN category | Meaning |
|---|---|
Extinct (EX) | No reasonable doubt that the last individual has died |
Extinct in the Wild (EW) | Survives only in captivity or cultivation |
Critically Endangered (CR) | Extremely high risk of extinction in the wild |
Endangered (EN) | Very high risk of extinction in the wild |
Vulnerable (VU) | High risk of extinction in the wild |
Near Threatened (NT) | Close to qualifying for a threatened category |
Least Concern (LC) | Widespread and abundant |
Data Deficient (DD) | Not enough information to assess |
Species in the three categories Critically Endangered, Endangered and Vulnerable are described as threatened. In the October 2025 update of the Red List, more than 48,600 species were assessed as threatened, about 28% of all the species assessed.
The Living Planet Index measures something different: the average change in the size of thousands of monitored populations of vertebrates since 1970.
Living Planet Index, 1970–2020 | Average decline in monitored population size |
|---|---|
All monitored populations (about 35,000 populations of 5,495 species) | 73% |
Freshwater populations | 85% |
Terrestrial populations | 69% |
Marine populations | 56% |
Latin America and the Caribbean | 95% |
Source: WWF Living Planet Report 2024, with the Living Planet Index calculated by the Zoological Society of London.
An average decline of 73% does not mean that 73% of animals or species have been lost. It means that, across all the monitored populations, the population sizes have on average fallen by 73% since 1970. Some populations have increased and some have fallen much more. The index is also biased towards vertebrates and towards regions with long monitoring records, such as Europe and North America. Taken together with the Red List, local surveys and citizen-science records, the evidence from many independent sources points the same way, which is why biologists regard the biodiversity crisis as well established.
The underlying cause of the current biodiversity crisis is the growth of the human population and its consumption of resources. The world population reached 1 billion in the early 1800s, about 2.5 billion in 1950 and 8 billion in November 2022. Each person needs land for food, water, energy, housing and materials, and consumption per person has also risen greatly in many countries. The flow diagram of the drivers of biodiversity loss shows how population growth acts through several direct causes.

Urbanisation and land clearance. Farmland now covers about a third of the Earth's land surface. Clearing land for crops, livestock and towns is the largest single cause of biodiversity loss on land.
Overexploitation. Rising demand for fish, timber, bushmeat and wildlife products has reduced many populations. Overfishing is the largest cause of loss in the oceans.
Pollution. Fertilisers, pesticides, plastics and sewage enter soil, rivers and seas. Nutrient run-off causes eutrophication and dead zones with very little oxygen in coastal waters.
Invasive species and pathogens. Global trade and travel move species between continents. The brown tree snake, accidentally introduced to the island of Guam shortly after the Second World War, wiped out most of the island's native forest birds. The chytrid fungus Batrachochytrium dendrobatidis, spread around the world partly by the trade in amphibians, has caused the decline of at least 500 species of frogs and salamanders and the extinction of about 90.
Climate change. Burning fossil fuels for a growing population has raised global temperatures. The Bramble Cay melomys (Melomys rubicola), a small rodent from a low island in the Torres Strait, Australia, was declared extinct in 2019 after storm surges and rising seas repeatedly flooded its island; it is the first mammal extinction attributed mainly to climate change.
Invasive species are introduced species that spread and cause harm; many introduced species never become invasive. The effects of these causes add together. A population reduced by habitat loss is more vulnerable to hunting, disease or a heatwave than a large, connected population would be. This interaction and interdependence of causes is one reason why conservation must tackle several threats at once.
No single method can protect every species. Species differ in what threatens them, how much space they need, how they reproduce and how well they survive in captivity, and conservation budgets are limited. Effective conservation therefore uses several approaches together, matched to the species and the threats.
In situ conservation protects species in their natural habitats ("in situ" means "in place").
The main methods are:
Protected areas. National parks and nature reserves restrict activities such as logging, hunting, building and farming. Large reserves, or smaller ones connected by wildlife corridors, protect species that need large areas.
Active management. Many reserves need active management to keep their biodiversity: controlling introduced predators and weeds, preventing poaching, managing grazing or fire, and keeping water levels in wetlands.
Restoration and reclamation. Damaged ecosystems can be restored, for example by replanting native trees, blocking drainage ditches to rewet peatlands or removing dams. Reclamation brings land degraded by mining or farming back into a natural state.
Rewilding. Large areas are restored to a self-sustaining state, often by reintroducing species that have been lost, such as top predators or large herbivores, and then reducing human management.
In situ conservation has important advantages. Species remain in the habitat to which they are adapted, so they keep their natural behaviour, such as feeding, migration and rearing young, and continue to evolve under natural selection. Their interactions with other species, such as pollinators, prey and predators, are maintained. Protecting one habitat protects all the species in it at once, including those not yet discovered, and maintains ecosystem services. Its disadvantages are that it may be impossible when a habitat has already been destroyed or the threat cannot be removed, and that reserves are hard to police against poaching or illegal logging.
The kākāpō (Strigops habroptilus), a large, flightless, nocturnal parrot of New Zealand, shows how intensive in situ management can save a species. Introduced stoats, cats and rats had reduced it to 51 known birds by 1995. All surviving kākāpō were moved to islands cleared of predators, where each bird is monitored and supplementary food is provided in breeding years. By September 2026 the population had reached 325 birds.
Ex situ conservation protects species outside their natural habitats ("ex situ" means "out of place").
Zoos, aquaria and captive breeding. Animals are bred in captivity, with studbooks used to choose mates so that inbreeding is avoided and genetic diversity is kept as high as possible. The aim is often to reintroduce animals to the wild once the threats have been removed.
Botanic gardens. Living collections of plants are grown, propagated and studied, and rare plants are reintroduced to restored habitats.
Seed banks and germplasm storage. Seeds are dried and stored at low temperature (around −20 °C), where many remain viable for decades or centuries. The Svalbard Global Seed Vault in Norway, opened in 2008 inside a mountain in the Arctic, stores more than a million samples of crop seeds as a backup for seed banks around the world. Sperm, eggs and embryos of animals can be frozen in liquid nitrogen.
Ex situ conservation is the last resort when a species cannot survive in the wild, and it can save species from certain extinction. Its disadvantages are that captive populations are small, so genetic diversity is lost and inbreeding occurs; animals may lose natural behaviours such as hunting, fear of predators or migration routes; and the species does not continue to interact with its ecosystem. It is also expensive, and it does nothing to protect the habitat to which the species must eventually return.
Feature | In situ conservation | Ex situ conservation |
|---|---|---|
Where | In the natural habitat | Outside the natural habitat |
Examples | National parks, nature reserves, habitat restoration, rewilding | Zoos, captive breeding, botanic gardens, seed banks |
Number of species protected | Many species at once, including undiscovered ones | Usually one species at a time |
Natural behaviour and interactions | Maintained | Often lost or changed |
Genetic diversity | Kept in large wild populations; natural selection continues | Reduced in small captive populations, risk of inbreeding |
When most useful | When habitat remains and threats can be controlled | When the wild population is very small or its habitat has gone |
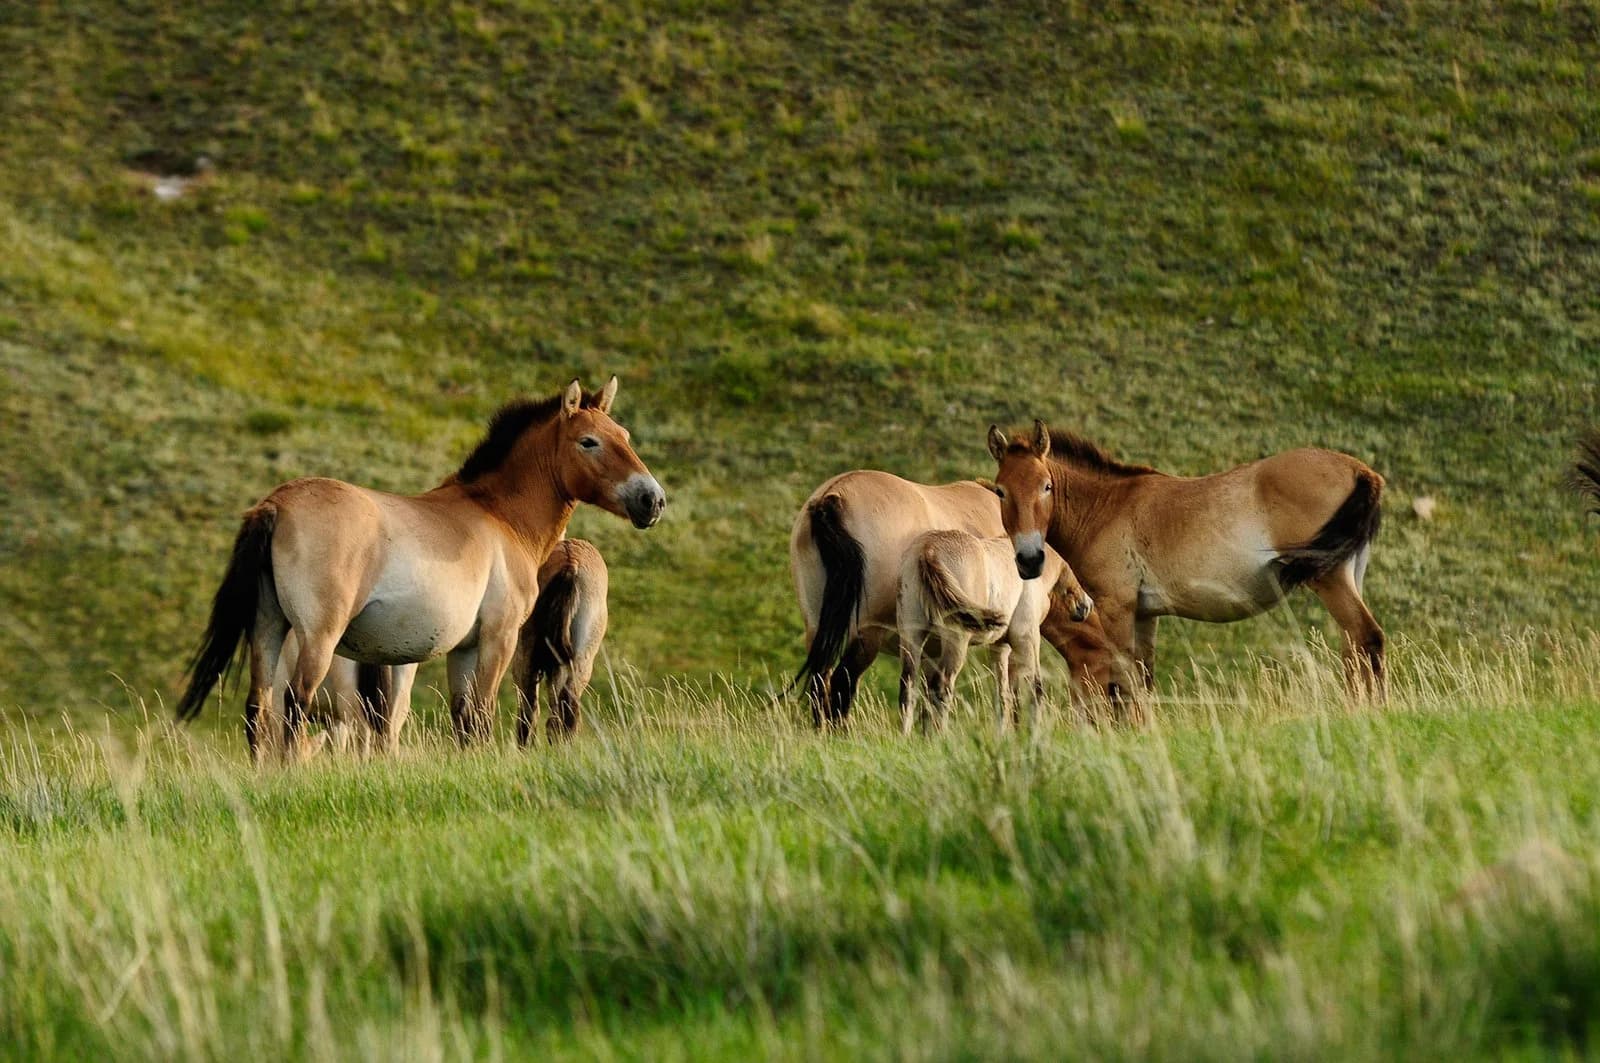
Przewalski's horse (Equus ferus przewalskii), called the takhi in Mongolia, is the last surviving wild horse. It once lived across the steppes of Central Asia, but hunting, competition with livestock for grazing and water, and harsh winters reduced it to a small population in the Dzungarian Gobi. The last wild individual was seen in 1969 at the Gun Tamga spring in Mongolia, and the species was then classed as Extinct in the Wild.
The species survived only because of ex situ conservation. A small number of horses had been captured in the early 1900s and bred in zoos. All living Przewalski's horses descend from just 12 wild-caught founders and up to 4 domestic horses, so the captive population had very low genetic diversity. Zoos kept an international studbook and chose mates to keep as much of the founders' genetic diversity as possible and to limit inbreeding.
Year | Event |
|---|---|
1969 | Last sighting of a wild horse, at Gun Tamga in the Dzungarian Gobi, Mongolia |
Early 1900s onwards | Captive breeding in zoos from 12 wild founders, managed with an international studbook |
1992 | Reintroduction begins: 16 horses released at Hustai, Mongolia; a second population is established at Takhin Tal in the Great Gobi B Strictly Protected Area |
2008 | IUCN status changed from Extinct in the Wild to Critically Endangered |
2011 | IUCN status changed to Endangered |
Sources: IUCN Red List updates, 2008 and 2011; review of reintroductions in Animals, 2022.
The recovery needed both kinds of conservation. Ex situ captive breeding kept the species alive and built up numbers. In situ conservation then gave the horses protected areas, Hustai National Park and the Great Gobi B reserve, where they could form natural herds, find their own food and water, and face natural selection again. The case also shows the importance of genetic diversity as a level of biodiversity: because the whole species passed through a population bottleneck of a few founders, its low genetic diversity remains a risk, and severe winters in the Gobi have killed many reintroduced horses. Conservationists continue to move horses between zoos and reserves to reduce inbreeding.
 YouTube
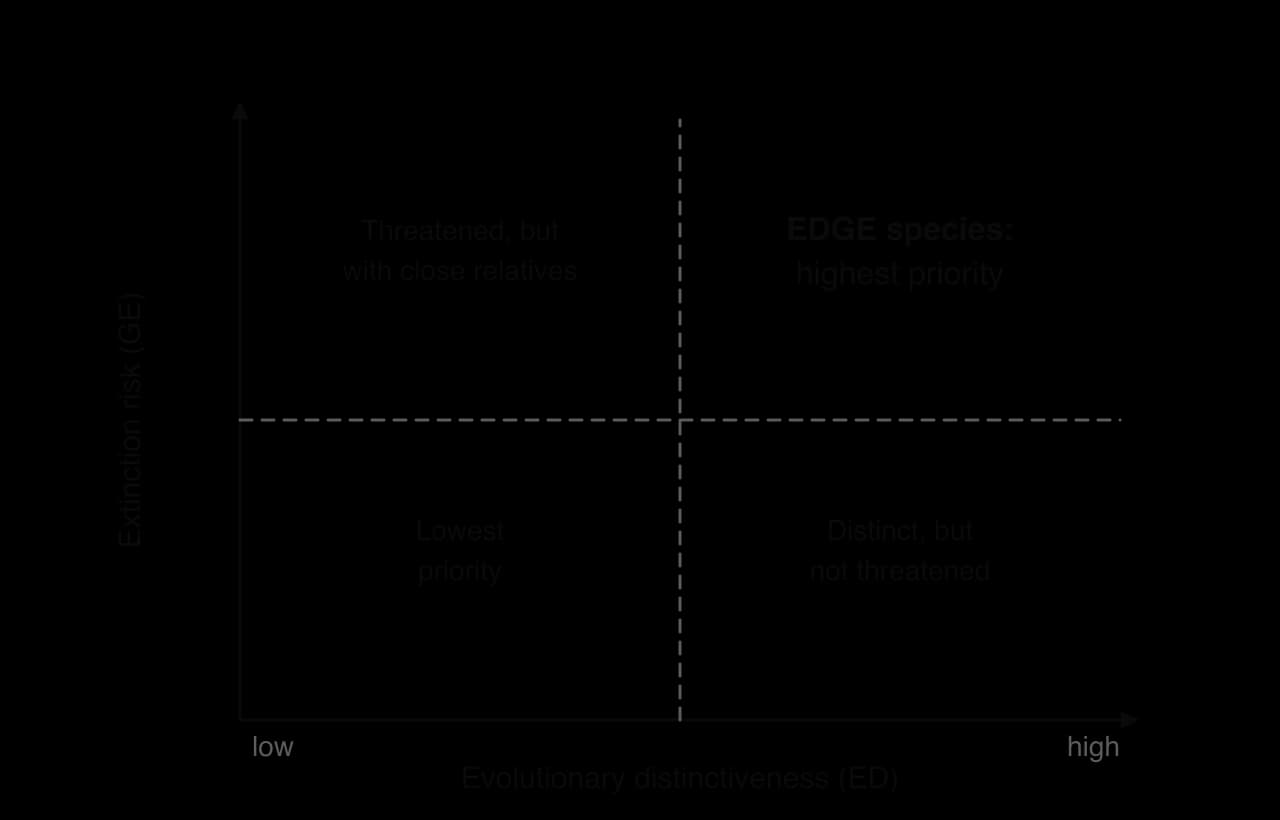
There are far more threatened species than there is money and time to save them, so conservationists have to decide which to protect first. One approach is to give priority to species that represent the most evolutionary history. The EDGE of Existence programme, started by the Zoological Society of London in 2007, ranks species by two measures:
ED, evolutionary distinctiveness. A species with few or no close living relatives, on a long branch of the tree of life, has a high ED score. The aardvark, the only living member of its order, is highly evolutionarily distinct; one species of mouse among hundreds of similar rodents is not.
GE, global endangerment. This is the species' extinction risk, taken from its IUCN Red List category, from Least Concern to Critically Endangered.
The two scores are combined to give an EDGE score. Species that score highly on both are EDGE species, and the programme concentrates research, monitoring and conservation action on them. The diagram of the EDGE scoring shows how the two measures are combined.
Examples of EDGE species include Attenborough's long-beaked echidna (Zaglossus attenboroughi), one of only a few species of egg-laying mammals, known from the mountains of New Guinea; the Chinese giant salamanders (genus Andrias), the largest living amphibians, from a lineage that separated from its relatives tens of millions of years ago; the axolotl (Ambystoma mexicanum), now confined to a few canals around Mexico City; and the pangolins, scaly mammals heavily trafficked for their scales and meat. Many EDGE species receive little attention from other programmes because they are not well known.
The approach has strengths and limitations. It uses clear, measurable criteria, and it protects the greatest amount of evolutionary history and unique features for a given budget. However, it depends on accurate cladograms and Red List assessments, which are missing for many groups such as most invertebrates and plants. It also ignores other reasons for protecting a species, such as its ecological role (a keystone species), its value to local people or its importance as a flagship that attracts funding. Conservation decisions of this kind involve ethical choices as well as scientific evidence.
Conservation of biodiversity appears in Paper 1A as questions on the levels of biodiversity, the causes of extinction and the meaning of in situ and ex situ. Paper 1B and Paper 2 Section A use survey data, so you may be asked to calculate Simpson's reciprocal index, compare two communities or evaluate a data source. Paper 2 Section B often asks you to outline causes of extinction or ecosystem loss with named examples, or to discuss approaches to conservation.
The counts used in diversity indices come from the sampling methods of ecology, and the ED scores used by EDGE come from cladograms.
I can define biodiversity and distinguish ecosystem, species and genetic diversity.
I can compare biodiversity now with the past and name the five mass extinctions and their causes.
I can explain the extinction of the moas and the Caribbean monk seal, and of one other species.
I can explain the loss of the mixed dipterocarp forest and one other ecosystem.
I can distinguish species richness from species evenness and calculate Simpson's reciprocal index.
I can evaluate evidence for a biodiversity crisis, including citizen science and the IUCN Red List.
I can explain how human population growth drives biodiversity loss through several direct causes.
I can compare in situ and ex situ conservation, using Przewalski's horse as an example.
I can explain how the EDGE of Existence programme prioritises species for conservation.
I and II only
I and III only
II and III only
I, II and III
Orangutans on Borneo and Sumatra were once classified as a single species. Using differences in DNA base sequences, morphology and behaviour, taxonomists now recognise three species. Which statement describes this change?