Notes on A3.2 Classification and cladistics
Classification is the arrangement of organisms into groups on the basis of their similarities and their evolutionary relationships. Nearly 2 million species have been named, and many millions more have not yet been described, so a shared system of groups and names is needed for biologists to communicate about any of them.
Traditional classification sorted organisms by visible features into a fixed hierarchy of ranks. Modern classification uses DNA and protein sequences to work out which organisms share a common ancestor, and builds groups called clades that match the branching pattern of evolution. The change from the first approach to the second has moved some well-known organisms into new groups, and it has divided all life into three domains instead of two types of cell.
Why biologists classify organisms
Taxonomy is the science of naming, describing and classifying organisms. Its starting point is the species, which is named with the two-part binomial system introduced by Carl Linnaeus (A3.1 Diversity of organisms). Species are then placed into larger and larger groups.
Classification is useful for several reasons:
Naming and communication. Each species has one scientific name, and each group has one name, used by biologists in every country and language. The common name "robin" refers to Erithacus rubecula in Britain but to Turdus migratorius, a larger bird of the thrush family, in North America, and the binomial names remove the confusion.
Identification. Once the features of each group are known, an unknown organism can be identified by working down the hierarchy, for example with a dichotomous key.
Organising information. Knowledge about millions of species is stored by group in databases, museum collections and herbaria, so that information about related organisms can be found together.
Prediction. Members of a group share characteristics inherited from a common ancestor. If one species in a group has a useful property, its relatives are likely to have it too.
Studying evolution and biodiversity. A classification that reflects ancestry shows how groups are related, and makes it possible to count and compare the diversity of different groups and regions.
Prediction is one of the most useful of these benefits. The anticancer drug paclitaxel was first extracted from the bark of the Pacific yew (Taxus brevifolia), a slow-growing tree that is killed when its bark is stripped. Because the European yew (Taxus baccata) belongs to the same genus, it was a likely source of similar compounds; a related drug, docetaxel, is now made from a precursor extracted from its leaves, which can be harvested without killing the tree.
For any of these benefits, the system must be universally agreed. International codes of nomenclature set the rules for naming animals, plants (including fungi and algae) and prokaryotes, so that each name is used for only one group and each group has only one valid name.
The traditional hierarchy of taxa
In the traditional system each species is placed in a series of groups of increasing size. Each group is a taxon (plural taxa), and each level in the series is a rank. Linnaeus used kingdom, class, order, genus and species; phylum and family were added later, and in 1990 the domain was added as the highest rank.
The eight ranks, from most inclusive to least inclusive, are domain, kingdom, phylum, class, order, family, genus and species. Each taxon contains one or more taxa of the rank below it, so each genus contains one or more species, and each family contains one or more genera. The diagram of the hierarchy for humans shows this nesting.
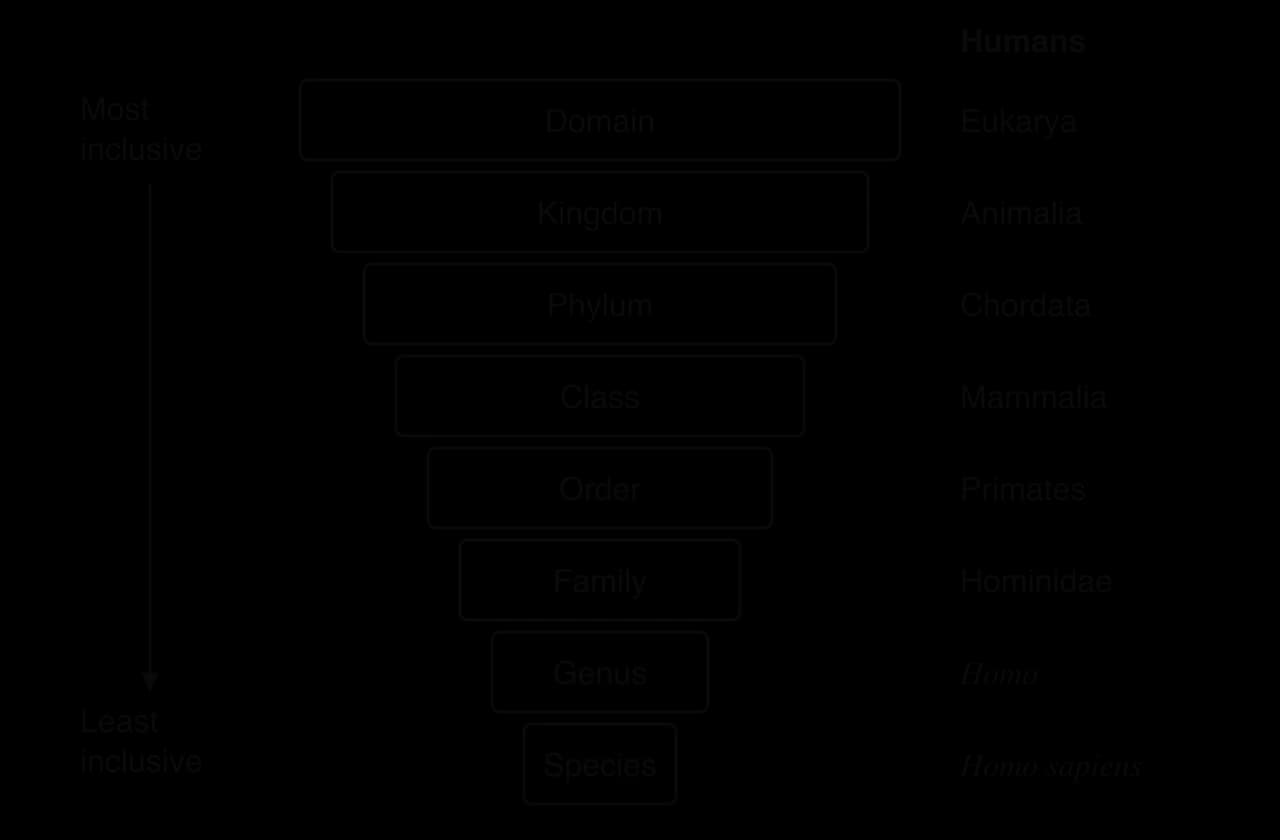
Organisms in the same species share almost all of their features. Moving up the hierarchy, each taxon includes more species, and the features that all its members share become fewer and more general. Humans and grey wolves share their class (Mammalia: hair, mammary glands) but belong to different orders. Humans and garden peas share only their domain (Eukarya: cells with a nucleus).
Rank | Human | Grey wolf | Garden pea |
|---|---|---|---|
Domain | Eukarya | Eukarya | Eukarya |
Kingdom | Animalia | Animalia | Plantae |
Phylum | Chordata | Chordata | Angiospermophyta |
Class | Mammalia | Mammalia | Magnoliopsida (dicotyledons) |
Order | Primates | Carnivora | Fabales |
Family | Hominidae | Canidae | Fabaceae |
Genus | Homo | Canis | Pisum |
Species | Homo sapiens | Canis lupus | Pisum sativum |
The traditional hierarchy uses six kingdoms in many textbooks: animals, plants, fungi, protoctists, eubacteria and archaebacteria. Older schemes used five kingdoms, with all prokaryotes in one kingdom. At the highest level, evidence from molecular sequences has replaced both schemes with three domains.
 YouTube
Difficulties in fitting organisms into the traditional hierarchy
The ranks of the hierarchy are a human invention. Evolution produces a continuous, branching pattern of lineages, and there is no natural level in that pattern that corresponds to "an order" or "a family". The main difficulties come from the continuous nature of evolution, from ranks that are not equivalent between groups, and from groups based on appearance alone.
Evolution is continuous, but ranks are fixed steps
New species form gradually from populations of an existing species (A4.1 Evolution and speciation). At any moment some populations are part of the way to becoming separate species, so there is no clear point at which they should be given separate names. The same is true at every rank: a lineage that is diverging does not suddenly become a new genus or family.
Ranks are not equivalent between groups
A family of beetles and a family of mammals are not comparable units. They do not have the same age, the same number of species or the same amount of genetic difference between members. Decisions about whether a group is a genus or a family were traditionally made separately by specialists on each group, using judgement about how different its members look. Two genera in one group may therefore be more different from each other than two families in another group.
Groups based on appearance may not be natural
Traditional classification grouped organisms that look alike. Similar features can arise independently in unrelated lineages by convergent evolution, and a group based on them can contain organisms that are not each other's closest relatives. Lineages that have changed a lot may also be removed from a group whose other members kept the ancestral appearance.
The traditional class Reptilia is the best-known example. Lizards, snakes, turtles and crocodilians were grouped together because they have scales, are ectothermic and lay shelled eggs. Birds were placed in a separate class, Aves, because feathers, endothermy and flight make them look very different. The cladogram of these groups shows that crocodilians share a more recent common ancestor with birds than with lizards or turtles. A group that includes crocodilians but leaves out birds therefore does not contain all the descendants of its common ancestor.
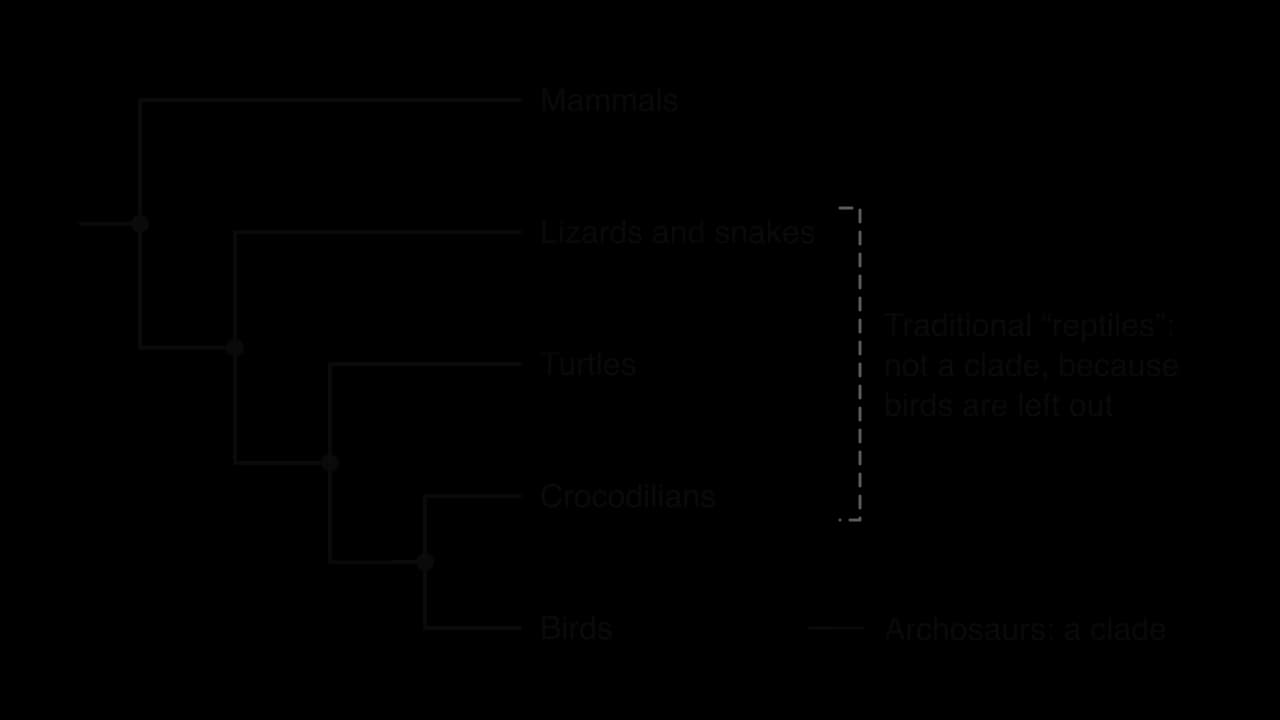
Fossil evidence supports this cladogram. Feathered dinosaurs such as Sinosauropteryx, described from China in 1996, show that feathers evolved in dinosaurs before birds, and birds are now classified as a group of theropod dinosaurs. The closest living relatives of birds are crocodilians.
Other difficulties
Too few ranks. Eight ranks cannot show all the branching points in a large group. Biologists add extra ranks (subfamily, superorder, tribe), but even these cannot represent every branch.
Hybrids and asexual organisms. The species rank depends on a species concept. Organisms that reproduce asexually, or that hybridise freely, do not fit the biological species concept (A3.1 Diversity of organisms).
Horizontal gene transfer. Prokaryotes pass genes between unrelated lineages by horizontal gene transfer, so different genes in one organism can suggest different relationships.
Changes in rank. When new evidence moves a group, many names may have to change. Moving whales into the even-toed ungulates, for example, alters the ranks of several groups at once.
Classification that corresponds to evolutionary relationships
Cladistics is a method of classification that groups organisms only by common ancestry. Every group it recognises must contain an ancestral species and all of its descendants. The evidence used is the set of characteristics that the members of the group share because they inherited them from that ancestor.
A classification built in this way has several advantages over one based on overall similarity:
It reflects real history. Each group corresponds to a branch of the tree of life, so the classification describes how organisms actually evolved rather than a subjective judgement about how alike they look.
It allows prediction. Members of a clade share characteristics inherited from their common ancestor, including features that have not yet been studied. If one species in a clade produces a compound, has a particular gene or is susceptible to a pathogen, its close relatives probably do as well.
It is testable. A proposed clade is a hypothesis about ancestry. It can be tested with new sequence data, new fossils or new morphological study, and changed if the evidence does not support it.
It is consistent. The same rule (an ancestor and all its descendants) applies to every group of organisms, from bacteria to mammals.
It links classification to the rest of biology. Comparative studies of physiology, behaviour or disease can take account of which species share ancestry, so that similarities caused by relatedness are not mistaken for adaptations to the same environment.
Cladistics shows unity and diversity at the same time. The shared characteristics of a clade come from common ancestry (unity); the differences between branches arose as each lineage evolved separately after the split (diversity).
Clades and shared derived characteristics
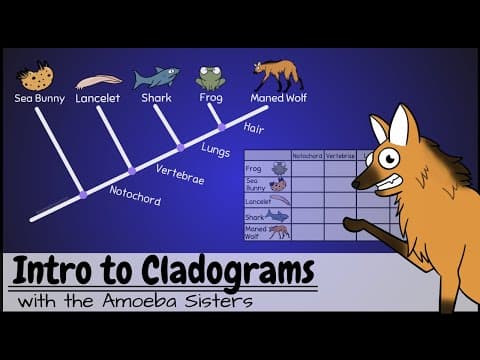
A clade is a group of organisms consisting of a common ancestor and all of its descendants, both living and extinct. A clade is sometimes called a monophyletic group. Clades are nested inside each other: mammals are a clade, primates are a clade within mammals, and great apes are a clade within primates.
Not every shared characteristic is evidence of membership of a clade. Biologists distinguish between characteristics that were already present in a more distant ancestor and those that first appeared in the ancestor of the clade itself. Having a backbone is shared by frogs, lizards and mice, but it does not show that they form a clade apart from sharks, because sharks have a backbone too. Having four limbs is shared by frogs, lizards and mice and not by sharks, so it is evidence that the three of them form a clade.
Evidence used to identify clades
Members of a clade are identified by comparing characteristics, and three types of evidence are used:
Base sequences of genes. DNA or RNA base sequences are compared between species. Each base position is a characteristic with four possible states, so a single gene of 1,000 bases provides up to 1,000 characteristics. Species in the same clade share more of the same bases, because they have had less time since their common ancestor for mutations to accumulate.
Amino acid sequences of proteins. The amino acid sequences of proteins such as cytochrome c or haemoglobin are compared in the same way. Because the genetic code is degenerate, some base changes do not change the amino acid, so protein sequences change more slowly than DNA sequences and are useful for comparing distantly related organisms.
Morphology. Anatomical features of living organisms and fossils, such as bone structure or flower structure, are also used. Morphological evidence is the only kind available for most fossils, but it is more open to error from convergent evolution.
Molecular evidence is usually more objective than morphological evidence. Each position in a sequence is a clearly defined character, many thousands of characters can be compared, and the analysis can be repeated by anyone who downloads the same sequences. Morphological characters depend on decisions about what counts as "the same" structure, and similar structures can evolve independently. The strongest classifications use both kinds of evidence and find that they agree.
 YouTube
Molecular clocks: estimating when clades diverged
When a species splits into two, each daughter lineage begins to accumulate mutations independently. Mutations that do not affect fitness, or affect it very little, are passed on and become fixed in the population at a fairly steady rate over long periods of time. The number of differences in a base sequence or amino acid sequence between two species therefore increases with the time since they shared a common ancestor.
If the rate at which differences accumulate is known, the number of differences can be converted into a time. The rate is found by calibration: comparing species whose divergence is dated independently, usually from fossils of known age or from geological events such as the separation of two land masses. The graph of number of sequence differences against time since divergence shows the model that the clock is based on.
Molecular clocks have been used to estimate when humans and chimpanzees diverged. Most estimates place the split between about 5 and 7 million years ago, although some studies give earlier dates, because the result depends on which fossils are used for calibration and on the mutation rate assumed, so the range of estimates reflects the assumptions built into the clock.
Assumptions and limitations of molecular clocks
A molecular clock gives an estimate, not an exact date. Its reliability depends on several assumptions, each of which can fail:
Rates differ between genes. Genes for proteins with essential functions, such as histones, change very slowly because most mutations in them are harmful and are removed by natural selection. Non-coding sequences change much faster. Each gene needs its own calibration.
Rates differ between lineages. Organisms with short generation times, such as rodents, copy their DNA more times per million years and tend to accumulate mutations faster than organisms with long generation times, such as elephants or apes.
Rates change over time. A gene may change slowly for millions of years and then faster when selection pressures change.
Multiple changes at one site are hidden. Over long periods, the same base can change more than once (A → G → A). Simple counts of differences then underestimate the true number of changes, so the clock appears to slow down for very old splits.
Calibration depends on fossils. Fossil dates are themselves uncertain, and the oldest fossil of a group is younger than the group's real origin, because earlier members were not preserved or have not been found.
Because of these problems, modern studies use many genes, statistical models that allow rates to vary, and several independent fossil calibrations. The result is given as a range, with a confidence interval, rather than a single date.
Constructing cladograms from sequence data
A cladogram is a branching diagram that shows the most probable sequence of divergence of clades. Today almost all cladograms are built from the base sequences of genes or the amino acid sequences of proteins, using computer software.
Step 1: aligning the sequences
The sequences of the same gene (or protein) are obtained for each species, often from public databases such as GenBank. They are arranged in rows so that positions that descend from the same position in the ancestral gene line up in columns. This is sequence alignment. Where one sequence has gained or lost bases, gaps are inserted so that the rest of the sequence still lines up.
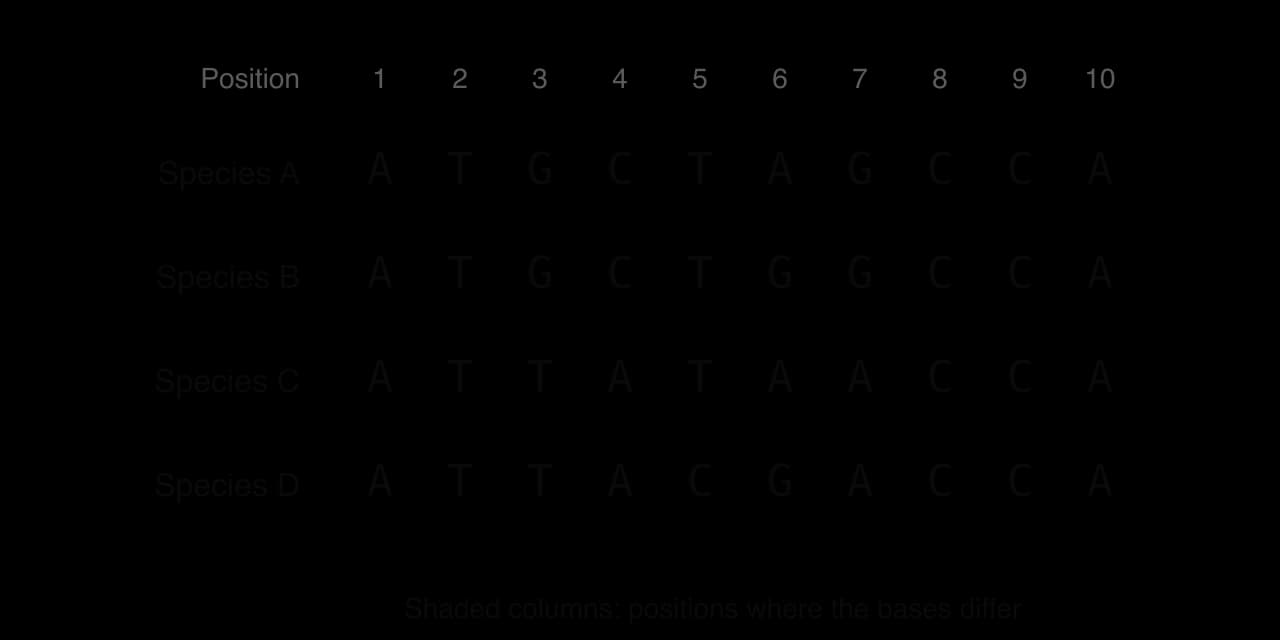
Once the sequences are aligned, each column is treated as a characteristic and each base as a character state. Columns where all species have the same base give no information about relationships. Columns where species differ are the evidence for the cladogram.
Step 2: finding the most likely tree
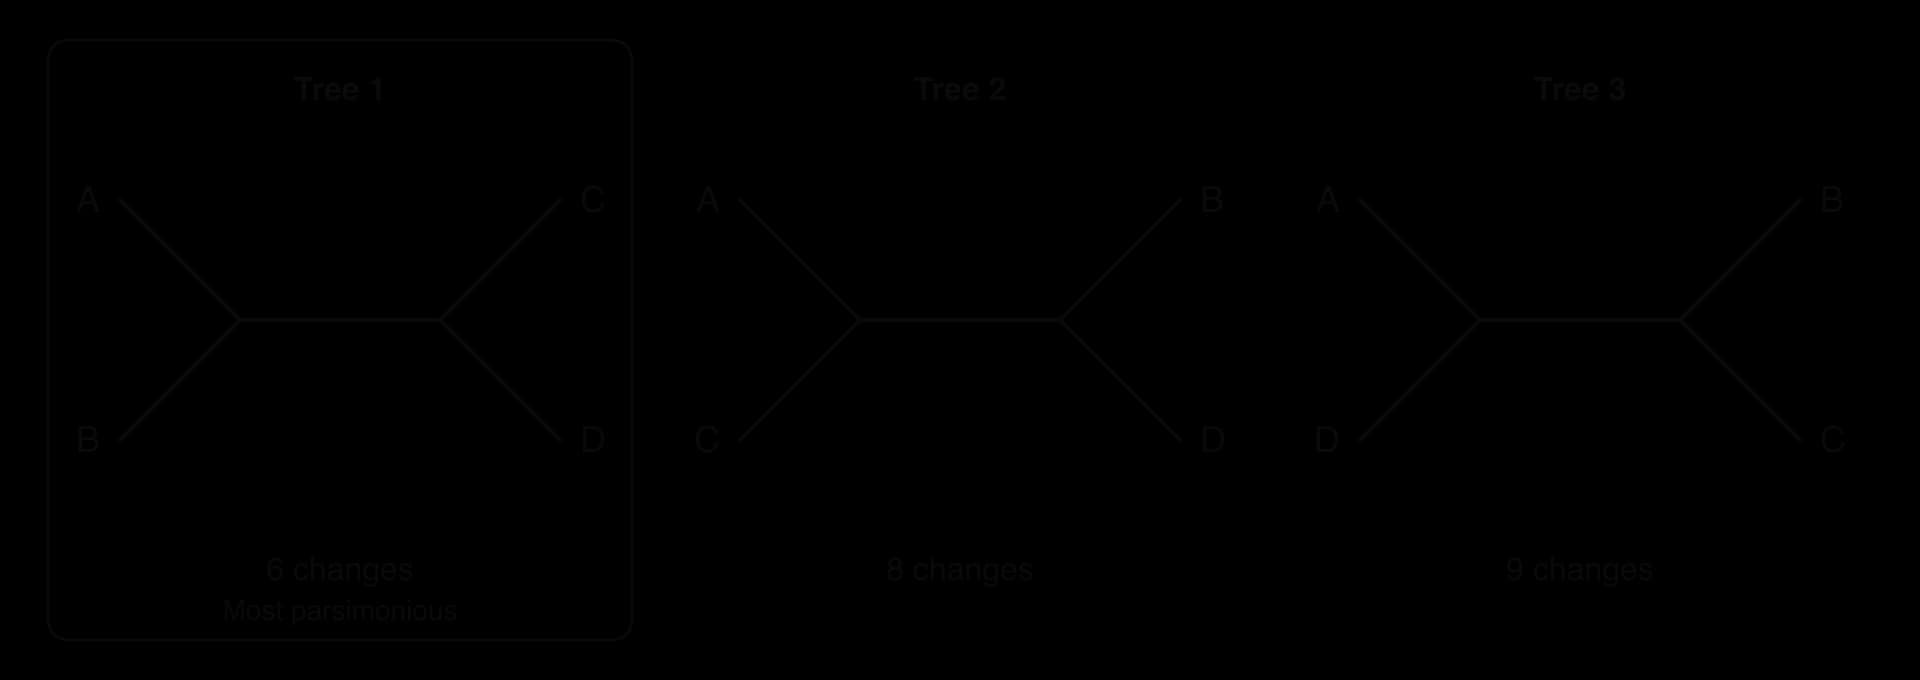
For a small number of species, all the possible cladograms can be compared. The number rises very quickly: there are 3 possible unrooted trees for 4 species, 105 for 6 species and more than 2 million for 10 species. Computer programs are therefore needed to search through possible trees and score each one. This use of computers to store and analyse biological data is bioinformatics.
One scoring method is parsimony analysis. For each possible tree, the program counts the smallest number of base changes needed to produce the observed sequences. The tree that needs the fewest changes is taken as the most likely, because it requires the fewest separate evolutionary events. Other methods, such as maximum likelihood, use statistical models of how sequences change, but the principle of choosing the best-supported tree is the same.
Parsimony is a reasonable working rule because mutations at any particular position are rare, so the same change is unlikely to have happened several times independently. It can still be misled. If a lineage has changed very quickly, or if the same change has happened in two lineages by chance, the tree with the fewest changes may not be the true one. Cladograms are therefore hypotheses: they are tested with other genes and other evidence, and revised when the evidence requires it.
Analysing cladograms
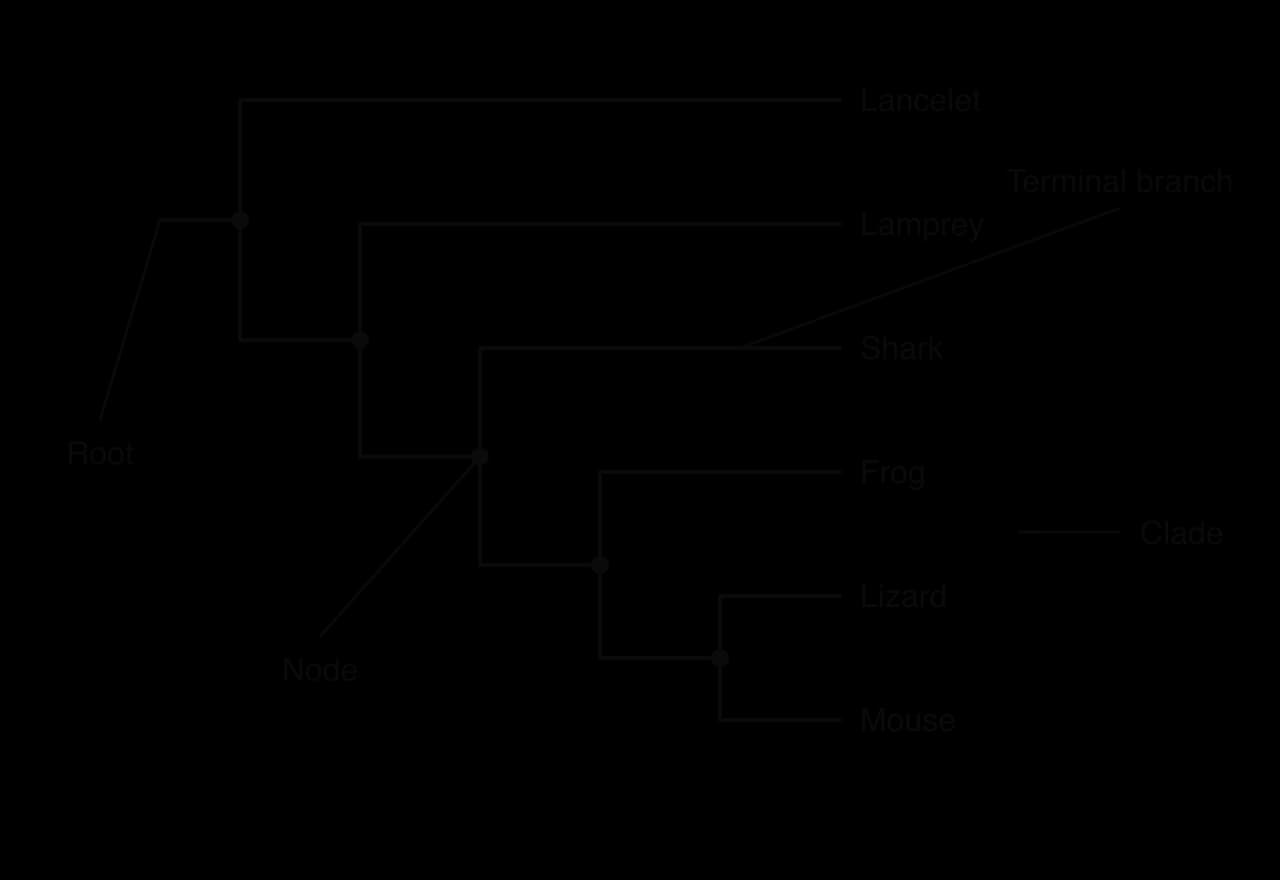
Reading a cladogram correctly depends on four terms, shown on the labelled cladogram of six chordates.
The root is the base of the cladogram. It represents the common ancestor of every organism shown.
A node is a branch point. It represents the last common ancestor of all the organisms on the branches that grow from it, and the moment at which that ancestral species split into two lineages.
A terminal branch is a branch that ends at a tip, leading to a single species or group that is not divided further on the diagram.
A clade on a cladogram is a node together with every branch that grows from it.
Rules for reading a cladogram
Read relationships from the nodes, not from the order of the tips. Two species are more closely related if they share a more recent common ancestor, that is, a node further from the root. The lizard and the mouse share a node that the frog does not, so the lizard is more closely related to the mouse than to the frog, even though all three look different.
Branches can rotate around a node without changing the meaning. Swapping the lizard and mouse labels, or drawing the frog at the bottom instead of the top, gives the same cladogram. Tips that sit next to each other on the page are not necessarily closest relatives.
Count nodes to find the number of clades. Each node defines one clade. A species belongs to every clade defined by the nodes between it and the root.
Living species did not evolve from each other. The tips are present-day species. None is the ancestor of another; they share common ancestors at the nodes.
Branch length shows time only in scaled trees. In most cladograms the branch lengths have no meaning. In a phylogenetic tree drawn to scale, branch lengths show the amount of sequence change or the time since divergence, and the axis says which.
Cladograms are also used to decide whether a structure shared by two groups is homologous or analogous (A4.1 Evolution and speciation). If the structure is present in their common ancestor and all the groups in between, it is a homologous structure, inherited from that ancestor. If groups on separate branches have it and the groups in between do not, it probably evolved more than once and is analogous.
Case study: whales are even-toed ungulates
Traditional classification placed whales, dolphins and porpoises (Cetacea) in their own order, separate from the even-toed hoofed mammals (Artiodactyla) such as pigs, camels, cattle, deer and hippopotamuses. Whales have no hooves, no hair and no external hind limbs, so on morphology alone there was little reason to group them with land mammals of any kind.
Molecular evidence
In the 1990s, comparisons of gene sequences began to suggest that whales were close relatives of artiodactyls. The strongest evidence came from a different kind of molecular character. SINEs and LINEs are short and long sections of DNA, called retrotransposons, that copy themselves and insert at essentially random positions in the genome. Once inserted, a SINE is almost never lost precisely, and the chance that two separate lineages gain a SINE at exactly the same position is extremely small. A SINE found at the same position in two species is therefore a very reliable shared derived characteristic: it shows that both inherited it from the ancestor in which the insertion happened.
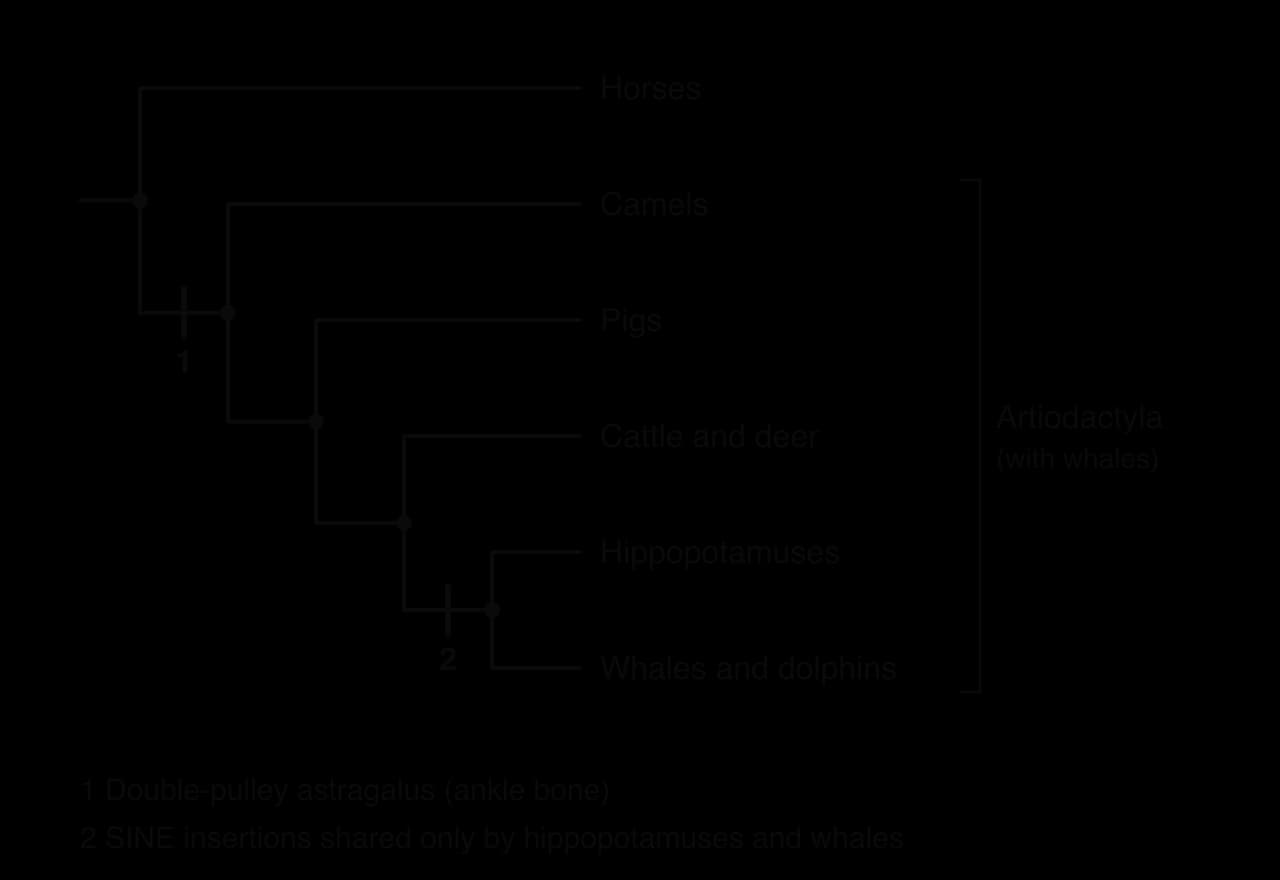
Researchers in Japan analysed SINE and LINE insertions in whales, hippopotamuses, ruminants (cattle and deer), pigs and camels. They found four insertions shared by whales and hippopotamuses and absent from all other artiodactyls, insertions shared by whales, hippopotamuses and ruminants, and an insertion shared by these groups and pigs but absent from camels. The nested pattern supports a single cladogram in which whales sit inside the artiodactyls, with hippopotamuses as their closest living relatives and camels as the earliest branch.
Fossil evidence
A molecular cladogram makes a prediction: if whales evolved from artiodactyl ancestors, early whales should show artiodactyl features that modern whales have lost. All artiodactyls have a distinctive ankle bone, the astragalus, with a pulley-shaped surface at both ends (a "double-pulley" astragalus), which no other mammals have. Modern whales have no hind-limb bones of this kind, so the test needed fossils of early whales with legs.
In 2001 two research groups described such fossils. Skeletons of the early whales Artiocetus and Rodhocetus from Pakistan, about 47 million years old, and skeletons of Pakicetus and related early whales, also from Pakistan, all had a double-pulley astragalus. The fossils confirmed the molecular prediction with independent morphological evidence.
Evidence | What it showed | Type of evidence |
|---|---|---|
Gene sequences (1990s) | Whales are more similar to artiodactyls than to any other mammals | Molecular |
SINE and LINE insertions (1999) | Whales share insertions with hippopotamuses only, then with hippopotamuses and ruminants, then with these groups and pigs | Molecular (shared derived characteristics) |
Ankle bones of early whales (2001) | Artiocetus, Rodhocetus and Pakicetus had the double-pulley astragalus of artiodactyls | Morphological (fossil) |
Sources: Nikaido, Rooney and Okada, PNAS 96:10261, 1999; Gingerich et al., Science 293:2239, 2001; Thewissen et al., Nature 413:277, 2001.
The traditional order Artiodactyla is paraphyletic unless whales are included, because it contains the common ancestor of whales and hippopotamuses but not all of its descendants. Many classifications now combine the two into one clade, called Cetartiodactyla, or simply include whales in Artiodactyla. The case shows how molecular and fossil evidence can test each other, and how a classification is changed when a traditional group turns out not to be a clade.
Reclassification using cladistics
When cladistic analysis shows that a traditional group is not a clade, the group is redefined. Some species are moved into other groups, groups are merged or divided, and new names are created. Cladistics has led to the reclassification of many groups of plants, animals, fungi and prokaryotes.
The figwort family
The figwort family, Scrophulariaceae, was traditionally one of the largest families of flowering plants, with over 200 genera. Its members were grouped by flower structure: two-lipped flowers with fused petals and a two-chambered ovary. It included figworts (Scrophularia), mulleins (Verbascum), foxgloves (Digitalis), snapdragons (Antirrhinum), speedwells (Veronica) and the partly parasitic yellow rattles (Rhinanthus) and eyebrights (Euphrasia).

In the 1990s and early 2000s, botanists compared the base sequences of several chloroplast genes (including rbcL and ndhF) from many genera in the family and in related families of the order Lamiales. The cladograms showed that the traditional Scrophulariaceae was not a clade. Its genera fell into at least five separate clades, and other families, including the mint family (Lamiaceae) and the plantains (Plantago), were nested among them.
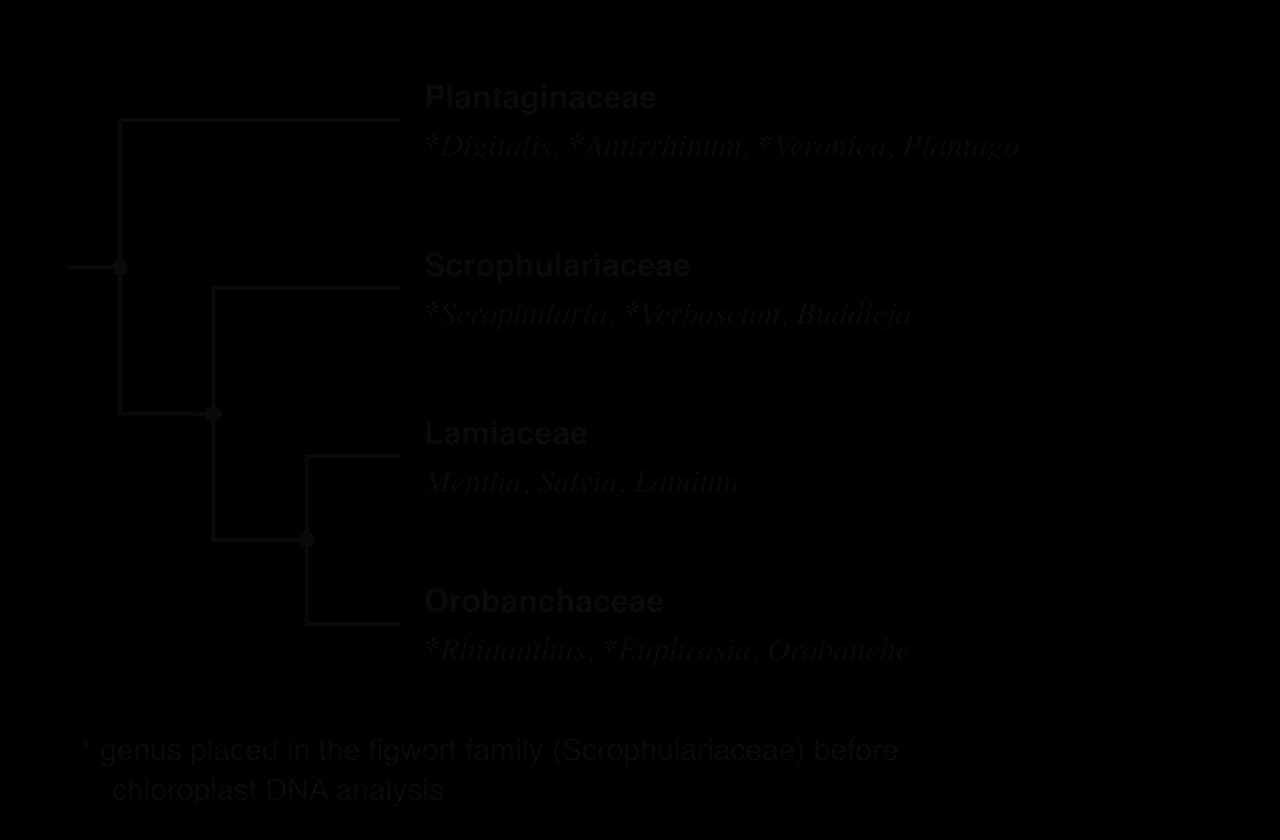
The family was reorganised so that each family is a clade:
Plantaginaceae received foxgloves, snapdragons, speedwells and many other genera, which share a clade with the plantains.
Orobanchaceae, the broomrape family of parasitic plants, received the partly parasitic genera such as yellow rattles and eyebrights. The cladogram supports a single origin of parasitism in this clade.
Scrophulariaceae kept the figworts and mulleins, and gained genera such as Buddleja (butterfly bush) from other families.
Other genera, such as monkeyflowers (Mimulus), were moved to smaller families, including Phrymaceae.
The figwort family lost more than half of its genera. Similar flower structures had evolved, or been retained from a distant ancestor, in lineages that are not each other's closest relatives, so morphology alone had grouped them wrongly. The case shows how a classification based on clades can make new predictions: knowing that yellow rattles belong to the same clade as broomrapes makes it possible to study how parasitism evolved within one lineage.
Three domains from rRNA base sequences
Until the 1970s, organisms were divided first into two types based on cell structure: prokaryotes, without a nucleus, and eukaryotes, with a nucleus. All prokaryotes were placed in one kingdom (Monera) in the five-kingdom system. The prokaryotes were assumed to be a natural group, because they all look similar under a microscope.
Woese and ribosomal RNA
In the 1970s Carl Woese and his colleagues at the University of Illinois compared the base sequences of the small-subunit ribosomal RNA (rRNA) from many prokaryotes and eukaryotes. rRNA is a good molecule for comparing all life for several reasons:
Every cellular organism has ribosomes, so the same molecule can be compared across all of life.
Its function in protein synthesis is so essential that its base sequence changes very slowly, so similarities remain detectable even between very distantly related organisms.
It is rarely transferred horizontally between lineages, so its sequence reflects the ancestry of the organism.
The results showed that the prokaryotes form two groups that are as different from each other in their rRNA as either is from eukaryotes. One group, first studied in methane-producing prokaryotes (methanogens), Woese called the archaebacteria, now Archaea. The other, including familiar bacteria such as Escherichia coli, became the Bacteria. In 1990 Woese, Otto Kandler and Mark Wheelis proposed that all life should be classified into three domains, above the rank of kingdom: Bacteria, Archaea and Eukarya.
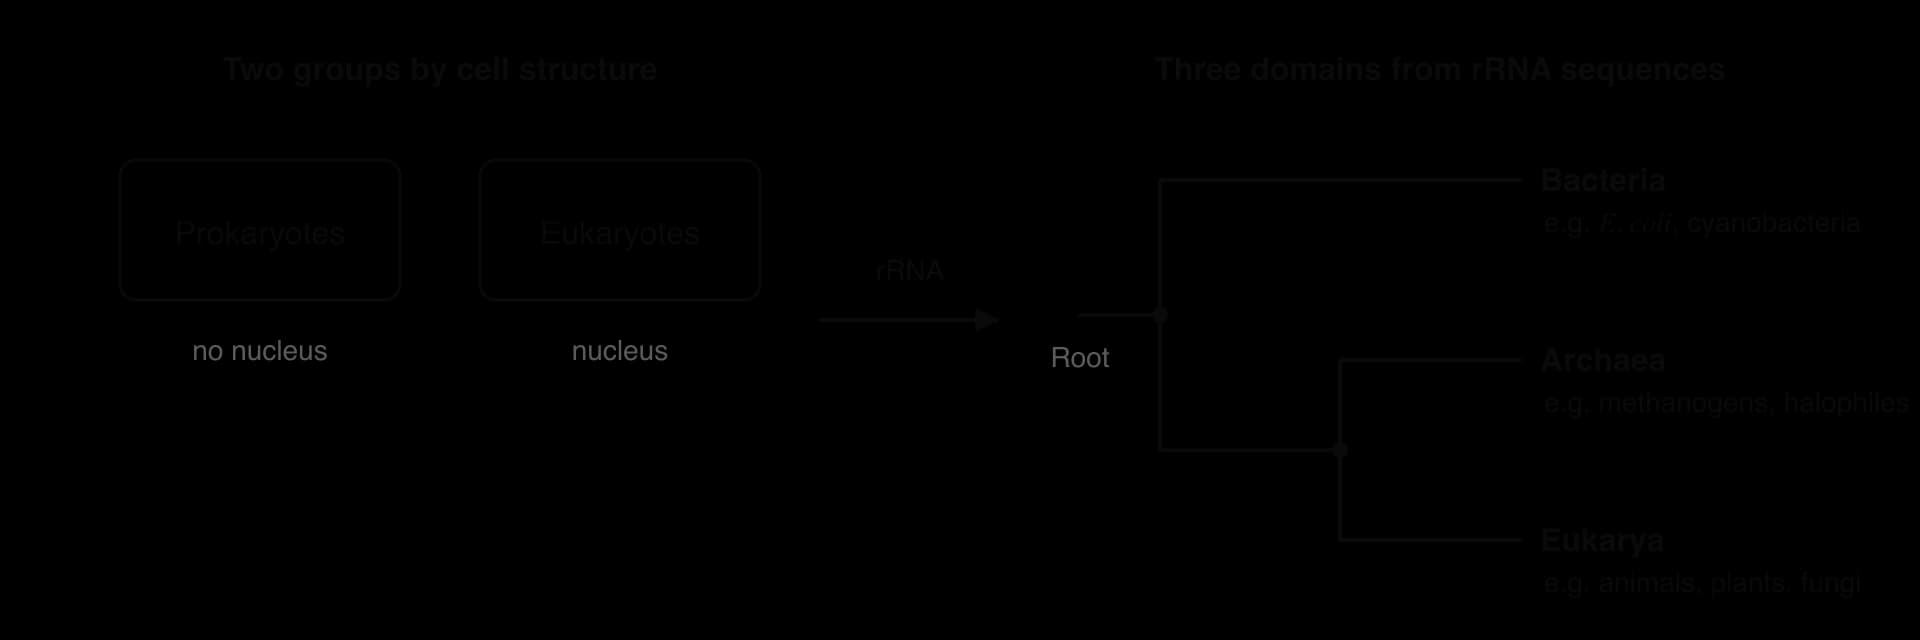
Differences between the three domains
The rRNA evidence was later supported by many other differences in cell chemistry. Archaea look like bacteria, but in several molecular features they resemble eukaryotes, and in others they are unique.
Feature | Bacteria | Archaea | Eukarya |
|---|---|---|---|
Nucleus and membrane-bound organelles | Absent | Absent | Present |
Peptidoglycan in cell wall | Present | Absent | Absent |
Membrane lipids | Unbranched fatty acids joined to glycerol by ester bonds | Branched hydrocarbon chains joined to glycerol by ether bonds | Unbranched fatty acids joined to glycerol by ester bonds |
Histone proteins associated with DNA | Absent | Present in many | Present |
Introns in genes | Very rare | Present in some genes | Common |
RNA polymerase | One simple type | Several types, complex, similar to eukaryotes | Several types, complex |
First amino acid of a protein | Formylmethionine | Methionine | Methionine |
Growth inhibited by antibiotics such as streptomycin | Yes | No | No |
Many archaea live in extreme environments: halophiles in salt lakes, thermophiles in hot springs above 80 °C, and methanogens in the oxygen-free guts of cattle and in marsh sediments. Archaea are also common in ordinary soils and oceans, so extreme habitats are not what defines the domain. The domain is defined by its rRNA sequences and molecular features.
A paradigm shift
The three-domain system was resisted at first, because the division of life into prokaryotes and eukaryotes was deeply established and based on what could be seen. It was accepted as more molecular data supported it. The change is an example of a paradigm shift: new technology (sequencing of rRNA) produced evidence that the existing framework could not explain, and the framework was replaced.
The debate has continued. Since 2015 the genomes of a group called Asgard archaea, found in deep-sea sediments, have shown many genes once thought to be found only in eukaryotes. Cladograms based on these genomes place eukaryotes inside the Archaea, as the sister group of Asgard archaea. If that is correct, there are only two primary domains, Bacteria and Archaea, with eukaryotes as a branch of Archaea that later gained mitochondria by endosymbiosis. The three-domain system remains in wide use, but the disagreement shows that a classification is a hypothesis tested against new evidence.
Exam practice
Classification and cladistics appear in Paper 1A as multiple-choice questions on reading cladograms, the order of ranks and the features of the domains. Paper 1B and Paper 2 Section A use unfamiliar cladograms, sequence alignments or tables of differences, with command terms such as deduce, identify, calculate and suggest. Extended responses in Paper 2 Section B may ask you to explain how cladograms are constructed, or to discuss the reclassification of a group or the evidence for three domains.
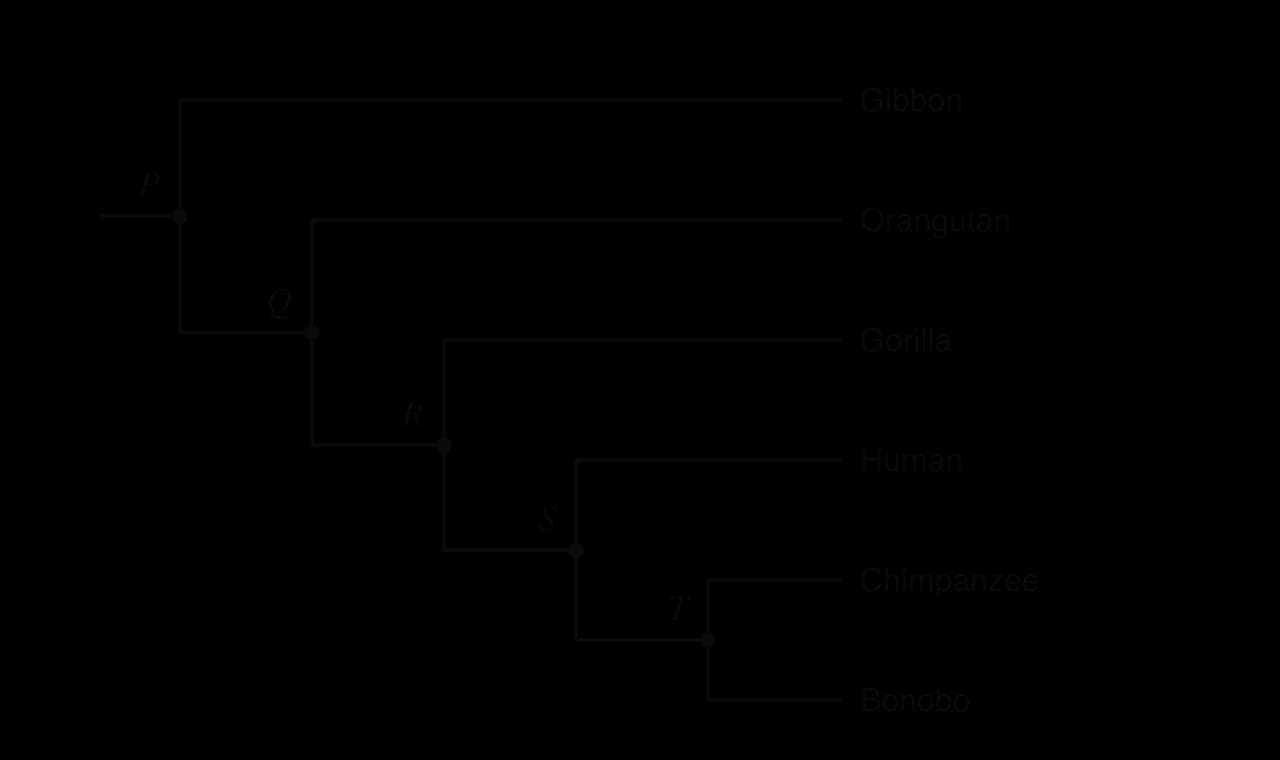
Cladograms also connect classification with the evidence for evolution, because the same diagrams are used to decide whether shared structures were inherited from a common ancestor or evolved more than once.
Self-check
- To do:
I can outline why organisms are classified and why a universally agreed system is needed.
- To do:
I can list the ranks of the traditional hierarchy from domain to species.
- To do:
I can explain why evolution makes it difficult to fit organisms into fixed ranks, using the example of reptiles.
- To do:
I can explain the advantages of classifying organisms by clades.
- To do:
I can define a clade and a shared derived characteristic, and identify clades on a cladogram.
- To do:
I can explain how a molecular clock works, calculate a divergence time and evaluate the assumptions.
- To do:
I can outline how cladograms are built from aligned sequences using parsimony analysis.
- To do:
I can use the terms root, node, terminal branch and clade to analyse a cladogram.
- To do:
I can describe how whales were shown to be even-toed ungulates, using molecular and fossil evidence.
- To do:
I can describe how cladistics led to the reclassification of the figwort family.
- To do:
I can explain how rRNA sequences led to the three-domain system and compare the three domains.