Notes on B.2.2 Fluid mechanics
Learning objectives
Outline what a projectile is and the forces that act on it during flight.
Describe the horizontal and vertical components of a projectile’s velocity and how each changes during flight.
Explain how the speed, angle and height of release determine the flight path and horizontal distance of a projectile.
Explain why the best angle of release in real sports is usually below 45°.
Distinguish between the flight paths of objects with a high and a low ratio of weight to air resistance.
Interpret graphs of projectile data, including evidence of random and systematic errors.
Explain how air density, wind, water salinity and altitude change the forces on an athlete or object (HL).
Explain buoyancy, the three types of drag, lift, Bernoulli’s principle, the angle of attack and the Magnus effect, with sporting examples (HL).
Evaluate the sporting, ethical and regulatory implications of technology that changes fluid forces (HL).
Introduction
Fluid mechanics is the study of how liquids and gases behave and how they act on objects that move through them. In sport, every thrown ball, jumping athlete, cyclist and swimmer moves through a fluid, either air or water, and the forces that fluid exerts help decide how far, how fast and in which direction they travel.
The topic serves both lenses of the course. For performance, it explains why a shot-putter does not release the shot at 45°, why a long jumper takes off at a low angle and why a shuttlecock drops steeply at the end of its flight. For health, drag provides the resistance in water-based exercise and makes walking or cycling into a headwind harder work, and an understanding of flight paths helps coaches design safe throwing areas and adapted equipment, such as lighter balls and foam javelins, for children and beginners.
Fluids and the forces they exert
A fluid is any substance that can flow and change shape to fit its container. Both liquids and gases are fluids, so the water in a swimming pool and the air around a sprinter behave in similar ways, although water is about 800 times denser than air at sea level.
When a body moves through a fluid, it has to push the fluid out of the way, and the fluid pushes back. The force that resists the motion of a body through a fluid is called drag. Drag always acts in the opposite direction to the motion of the body relative to the fluid, so it slows the body down. Drag is also called fluid resistance; drag is the standard term in biomechanics and is used throughout.
Air resistance is simply drag in air. The term is used only for projectiles, such as a ball, a javelin or a long jumper flying through the air. For every other body moving through a fluid, such as a sprinter, a cyclist or a swimmer, the force is called drag.
Drag depends strongly on speed. At walking pace it is tiny, which is why air resistance can usually be ignored for a slow, heavy object. At the speeds of elite sport it becomes large: a cyclist travelling at about 50 km h⁻¹ on flat ground uses most of their power output to overcome drag rather than friction in the bike and tyres.
Projectile motion
A projectile is any object or body that is launched into the air and then moves under the influence of gravity and air resistance only. A shot, a javelin, a football, a basketball, a golf ball and a long jumper after take-off are all projectiles. Once the object has left the hand, foot, club or ground, the athlete can no longer change its path; everything that decides the flight is set at the moment of release, which is why release is the critical instant of a throw or jump.
Projectile motion is the motion of such an object through the air. The flight path it follows is also called its trajectory.
The forces on a projectile in flight
A free-body diagram of a projectile in flight shows two forces: its weight acting vertically downwards from its centre of mass, and air resistance acting opposite to its direction of travel. There is no forward force from the thrower once the object has been released. A common error is to draw a "throwing force" in the direction of motion: the object keeps moving forward because of its inertia, as Newton’s first law describes, not because a force is still pushing it.
Horizontal and vertical components of velocity
The velocity of a projectile is a vector: it has a size (the speed) and a direction. At release, it is useful to think of this one velocity as the sum of two independent parts, a horizontal component and a vertical component. The two components are affected by different forces, so they change in different ways during flight.
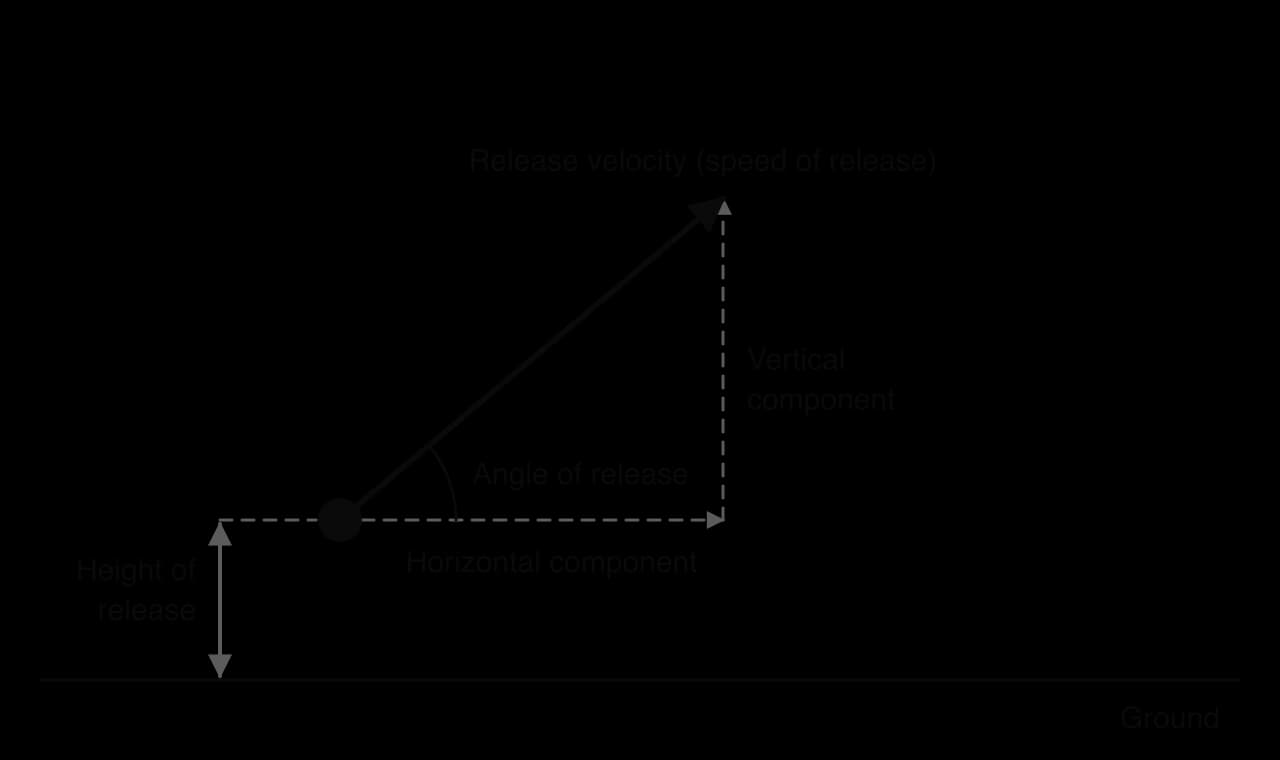
Horizontal component. Gravity acts only vertically, so it has no effect on horizontal motion. If air resistance is ignored, the horizontal component stays constant throughout the flight. It decides how far the projectile travels for every second it is in the air.
Vertical component. Gravity accelerates the projectile downwards at 9.81 m s⁻². On the way up the vertical component decreases, at the highest point it is zero, and on the way down it increases again in the downward direction. The initial vertical component, together with the height of release, decides how long the projectile stays in the air.
The horizontal distance a projectile travels (its range) depends on both: how fast it moves horizontally and how long it stays in the air. A large horizontal component with very little time in the air gives a short flight, and so does a long time in the air with very little horizontal speed. The best results come from a balance between the two, which is the reason the angle of release matters.
The parabola: flight with gravity alone
If air resistance is negligible, the only force on a projectile is its weight. The constant horizontal velocity combined with the steadily changing vertical velocity produces a symmetrical curved path called a parabola. The upward half of the path is a mirror image of the downward half, the projectile takes the same time to rise as to fall back to its release height, and it lands at the same speed as it was released.
A shot in the shot put is the best example in athletics of a near-parabolic path. It is heavy, small and travels relatively slowly, so air resistance is very small compared with its weight. Most other projectiles in sport follow paths that are close to a parabola only for short, slow flights.
Factors that determine the flight path
Three release conditions, the speed, angle and height of release, decide where a projectile lands if air resistance is small. A fourth factor, the ratio of the object’s weight to the air resistance on it, decides how far its real path differs from a parabola.
Speed of release
The speed of release is the speed of the projectile at the moment it leaves the hand, implement or ground. It is the most important factor for distance. If the speed of release increases while the angle and height stay the same, both components of velocity increase in the same proportion: the projectile travels faster horizontally and rises for longer, so the two effects multiply.
For a projectile released and landing at the same height with no air resistance, the range is proportional to the square of the speed of release. Increasing the speed of release by 10% increases the range by about 21%, because 1.1² = 1.21. Throwers and jumpers therefore spend most of their training on generating speed at release: the run-up of a javelin thrower and long jumper, the rotation of a discus or hammer thrower and the glide or spin of a shot-putter all build up speed, and the summation of joint forces transfers it from the large proximal segments to the hand.
Angle of release
The angle of release is the angle between the projectile’s direction of travel at release and the horizontal. It is also called the angle of projection. It decides how the speed of release is shared between the horizontal and vertical components: a low angle puts most of the speed into horizontal motion, a high angle puts most of it into vertical motion.
The graph shows the classic result. When the release and landing heights are equal and air resistance is negligible, an angle of release of 45° gives the greatest horizontal distance, because it shares the speed equally between the two components. Lower angles give a fast but short flight; higher angles give a long but slow one. Pairs of angles that add up to 90° (30° and 60°, 15° and 75°) give the same range, although the higher path takes longer and climbs higher.
The 45° rule holds only under those two conditions. In real sport the release height is rarely equal to the landing height, air resistance affects many projectiles, and the human body cannot produce the same speed at every angle. All three reasons push the best angle below 45° for most throws and jumps.
Height of release relative to the landing
The height of release is the vertical distance between the point of release and the point of landing (or the ground). What matters is the height of release relative to where the projectile lands or must arrive. A shot released at about 2 m above the ground lands at ground level, so it falls further than it rises; a basketball released at about 2.5 m must arrive at a ring 3.05 m high, so it finishes higher than it started.
When the release point is above the landing level, the projectile has extra time to fall after returning to its release height. That extra time already gives it the flight time a higher angle would have provided, so the athlete can lower the angle and put more of the speed into the horizontal component. The higher the release relative to the landing, the lower the best angle.
The opposite applies when the target is above the release point. A basketball free throw, a netball shot and a high jump all need to arrive at or clear a point that is higher than where they started. A steeper angle then helps: a basketball shot released at about 50° or more drops into the ring at a steeper angle, so the ring looks larger from the ball’s point of view and the shot tolerates small errors better.
Why the best angle in sport is lower still
Release height explains only part of the difference from 45°. The bigger part comes from the human body. Muscles and joints can produce more speed when an athlete pushes or throws nearly horizontally than when they push upwards, because a vertical push must also work against the weight of the body or implement, and because the body’s structure favours horizontal pushing in the shot and the jumps. As the angle of release increases, the speed of release falls.
The best angle is therefore a trade-off: raising the angle increases flight time but costs speed of release, and speed matters more. Biomechanics studies that filmed athletes throwing and jumping over a wide range of angles, measured how their release speed changed with angle, and then calculated the angle that gave each athlete the greatest distance. The calculated best angles matched the angles the athletes used in competition closely.
Event | Typical angle of release or take-off | Main reasons it is below 45° |
|---|---|---|
Long jump | About 15–27° (world-class jumpers); about 21–24° in one study of experienced jumpers | Take-off speed falls steeply if the jumper tries to jump upwards; a full-speed run-up allows only a low take-off angle |
Shot put | About 31–35° in a study of college shot-putters; 30–42° (mean about 37°) in the 2017 world final | Release about 2 m above the ground; release speed falls as the angle rises because the shot is heavy |
Javelin | About 35–38° (world-class throwers) | Release height above the ground; the javelin also produces lift during flight |
Basketball shot | Usually above 45° | The target (ring) is above the release point and a steep entry angle is more forgiving |
Sources: Linthorne, Guzman and Bridgett, Journal of Sports Sciences, 2005 (long jump, and the javelin and shot put values it reports from Red and Zogaib, 1977, and Linthorne, 2001); Dinsdale, Thomas and Bissas, IAAF biomechanical report, 2018 (2017 world final).
The long jump shows the trade-off most clearly. If a long jumper took off at 45°, they would have to slow down on the run-up so much that they would jump far less. Experienced jumpers take off at just over 20°, using their full approach speed. Because each athlete’s speed falls at a different rate as the angle rises, each athlete has their own best angle.
A computer model of a shot put (no air resistance, release height 2.1 m) shows how these effects combine. In version A of the model the speed of release is fixed at 13.0 m s⁻¹; in version B it falls as the angle increases, as it does for real athletes (hypothetical model data).
Angle of release (°) | 30 | 34 | 38 | 42 | 44 |
|---|---|---|---|---|---|
A: distance with constant speed of release (m) | 17.94 | 18.64 | 19.07 | 19.21 | 19.17 |
B: speed of release (m s⁻¹) | 14.00 | 13.76 | 13.52 | 13.28 | 13.16 |
B: distance (m) | 20.39 | 20.60 | 20.46 | 19.97 | 19.60 |
The ratio of weight to air resistance
The fourth factor compares how strongly gravity and air resistance act on the projectile. If its weight is very large compared with the air resistance on it, air resistance hardly changes its motion and the path is close to a parabola. If the air resistance is large compared with its weight, the path is strongly affected: the projectile slows quickly, does not travel as far and falls more steeply than it rose.
Air resistance has two effects on a path. It reduces the horizontal component throughout the flight, so the projectile travels less far forward each second, and it slows the upward motion, so the projectile reaches a lower peak. Because the horizontal speed keeps falling, the second half of the flight is shorter and steeper than the first: the path is asymmetric, with the highest point closer to the landing than to the release.
Projectile | Weight-to-air-resistance ratio | Shape of the path |
|---|---|---|
Shot (7.26 kg men, 4 kg women) | Very high: heavy, small, relatively slow | Close to a parabola |
Basketball, football | Moderate | Slightly asymmetric; the effect grows with speed |
Golf ball, table-tennis ball | Low at high speed | Clearly asymmetric; spin also matters |
Badminton shuttlecock | Very low: light, with a large feathered skirt | Very asymmetric: a steep, almost vertical fall at the end |
The shuttlecock is the extreme case. A badminton smash can leave the racket at very high speed, but the shuttle loses most of that speed within a few metres because its feathered skirt creates a large air resistance relative to its weight of about 5 g. A clear hit high to the back of the court slows almost to a stop and then drops nearly vertically. Players use this: a drop shot falls steeply just over the net, and a defensive clear gives time to recover position.
For the athlete, air resistance acts on the body as well as on the object. A long jumper or ski jumper is a projectile too, and their body position changes the air resistance on them. For a long jumper the effect is small compared with their weight, which is why the long jump is usually analysed as a parabola with good accuracy.
Using graphs to find errors in projectile data
Projectile motion is usually measured with video analysis: a camera films the throw or jump, and software tracks the position of the object or the athlete’s centre of mass frame by frame. Plotting the measured positions on a graph is one of the best ways to judge the quality of the data, because the physics predicts the shape the points should follow.
Two kinds of error appear on such graphs. Random error makes individual points scatter unpredictably on both sides of the best-fit curve, for example because the analyst clicks a slightly different pixel on each frame or because the object is blurred. Systematic error shifts all the points in the same direction, for example when the scale in the video is calibrated wrongly or the camera is not at right angles to the plane of motion.
The graph shows how the two errors are told apart. Random error can be reduced by repeating measurements and averaging, by using a higher frame rate and by fitting a curve through many points. Systematic error is not reduced by repeats, because every repeat contains the same bias; it is found by checking against a known reference, such as a calibration pole of known height in the camera’s field of view, and removed by correcting the method.
Environmental conditions and fluid forces (HL only)
The forces a fluid exerts depend on the fluid itself as well as on the moving body. The most important property is density: a denser fluid has more mass in every cubic metre, so a body moving through it must push more mass out of the way, and drag, lift and buoyancy are all larger. Environmental conditions change the density of air and water, and wind changes the speed at which the air meets the body.
Air density
Air density is the mass of air in a given volume, measured in kg m⁻³. At sea level and 15 °C it is about 1.225 kg m⁻³. Drag and lift are both proportional to the density of the fluid, so a fall in air density of 10% reduces both forces by 10% at the same speed.
Condition | Effect on air density | Why |
|---|---|---|
Higher altitude | Lower | Air pressure falls with height, so the air molecules are further apart |
Lower air pressure (weather) | Lower | The same effect at a smaller scale: a low-pressure weather system slightly reduces density |
Higher temperature | Lower | Warm air expands, so each cubic metre holds less mass |
Higher humidity | Lower | Water vapour molecules are lighter than the nitrogen and oxygen molecules they replace |
Humidity is the least intuitive entry. Humid air feels heavy, but it is slightly less dense than dry air at the same temperature and pressure, because a water molecule (H₂O, relative mass 18) is lighter than the nitrogen (28) and oxygen (32) molecules it displaces. The effect is small: in a standard model, air at 30 °C and 90% humidity is only about 1–2% less dense than dry air at 30 °C. Temperature and altitude have much larger effects.
Location (standard atmosphere) | Altitude (m) | Air density (kg m⁻³) | Compared with sea level |
|---|---|---|---|
Sea level, 15 °C | 0 | 1.225 | — |
Denver (Coors Field) | About 1,580 | About 1.05 | About 14% lower |
Mexico City | About 2,240 | About 0.98 | About 20% lower |
Densities are calculated from the International Standard Atmosphere model, which assumes standard temperatures; on a hot day the real values are lower still.
Altitude: Mexico City 1968 and Denver
The 1968 Olympic Games in Mexico City were held at more than 2,200 m above sea level, where the air is about a fifth less dense than at sea level. Bob Beamon’s long jump of 8.90 m, with a tailwind of exactly 2.0 m s⁻¹ (the legal limit), beat the world record by 55 cm and stood for 23 years. Lower air density reduced the drag on him during his run-up and flight, so he reached a higher take-off speed and lost less speed in the air.
The same altitude made the endurance events slower, because the lower partial pressure of oxygen causes hypoxia. Both effects come from the lower density of the air, which means less drag (a mechanical advantage) and less oxygen in every breath (a physiological disadvantage).
In baseball, Coors Field in Denver sits at about 1,580 m. Its low air density was expected to let batted balls travel further, and the ground became known for high scores. Since 2002, balls have been stored in a humidor before games, because studies suggested that the dry air, which dried the balls and made them bouncier off the bat, contributed more to the long hits than the thin air did. The thin air also reduces the Magnus force on a spinning pitch, so curveballs curve less in Denver than at sea level.
Sources: World Athletics record progression; Wikipedia, Coors Field, citing Major League Baseball and USA Today, 2002.
Wind
Drag depends on the speed of the body relative to the air, not relative to the ground. A headwind (blowing against the athlete) increases that relative speed and so increases drag; a tailwind (blowing from behind) reduces it. A sprinter running at 10 m s⁻¹ into a 2 m s⁻¹ headwind meets the air at 12 m s⁻¹; with a 2 m s⁻¹ tailwind, at 8 m s⁻¹. Because drag rises with the square of the relative speed, the drag in the headwind is (12 ÷ 8)² = 2.25 times the drag in the tailwind.
Because wind can help so much, World Athletics does not accept a record in the 100 m, 200 m, 100 m and 110 m hurdles, long jump or triple jump if the tailwind measured during the race or jump is more than 2.0 m s⁻¹. Results with a stronger tailwind count in the competition but are listed as wind-assisted.
Wind does not always favour a tailwind. A discus thrower gains distance from a moderate headwind, because the discus generates lift: a faster relative airflow increases the lift on the discus more than the extra drag costs. Crosswinds affect golf, archery, sailing and ski jumping, and ski jumping competitions are paused when the wind becomes unsafe.
Water density and salinity
Water density depends mainly on the salt it contains (its salinity) and its temperature. Fresh water in a pool has a density of about 1,000 kg m⁻³, seawater about 1,025 kg m⁻³, and very salty water such as the Dead Sea well over 1,200 kg m⁻³. Denser water produces a larger buoyant force on the same body, so swimmers float higher in the sea than in a pool.
Floating higher reduces the part of the body below the surface, so open-water swimmers in the sea need less effort to keep their legs up than in a pool. Denser water also increases drag on the parts that remain in the water, but the gain in body position usually outweighs this. Wetsuits add buoyancy too, which is why open-water and triathlon rules limit when they may be worn, based on water temperature.
Buoyancy (HL only)
Buoyancy is the upward force a fluid exerts on any body that is partly or fully immersed in it. It arises because fluid pressure increases with depth: the pressure on the lower surface of an immersed body is greater than the pressure on its upper surface, so the fluid pushes up more than it pushes down.
The size of this force is given by Archimedes’ principle: the buoyant force equals the weight of the fluid that the body displaces (pushes aside). It therefore depends on two things only, the density of the fluid and the volume of fluid displaced.
Here ρ is the density of the fluid (kg m⁻³), V is the volume of fluid displaced (m³) and g = 9.81 m s⁻². The equation is simply Archimedes’ principle written out: ρ × V is the mass of the displaced fluid, and multiplying by g gives its weight.
Floating and sinking
A body floats if the buoyant force can balance its weight before it is completely submerged. In practice this means comparing densities: a body less dense than the fluid floats, and a body denser than the fluid sinks. The average density of the human body is close to that of water, so small differences decide whether a person floats.
Body composition. Adipose tissue (fat) is less dense than water, while muscle and bone are denser. People with a higher proportion of body fat float more easily; very lean, muscular athletes may sink slowly unless they move.
Lung volume. Air in the lungs adds volume without adding much mass. A full inspiration can increase the body’s volume by several litres and turn a "sinker" into a "floater"; breathing out fully has the opposite effect.
Fluid density. The same person floats more easily in seawater than in fresh water.
Centre of buoyancy and body position
Buoyancy acts through the centre of buoyancy, the centre of mass of the displaced water. In a swimmer lying horizontally, the air-filled lungs make the chest the least dense part of the body, so the centre of buoyancy lies towards the chest. The centre of mass, where weight acts, lies nearer the hips, because the legs are dense and contain little air.
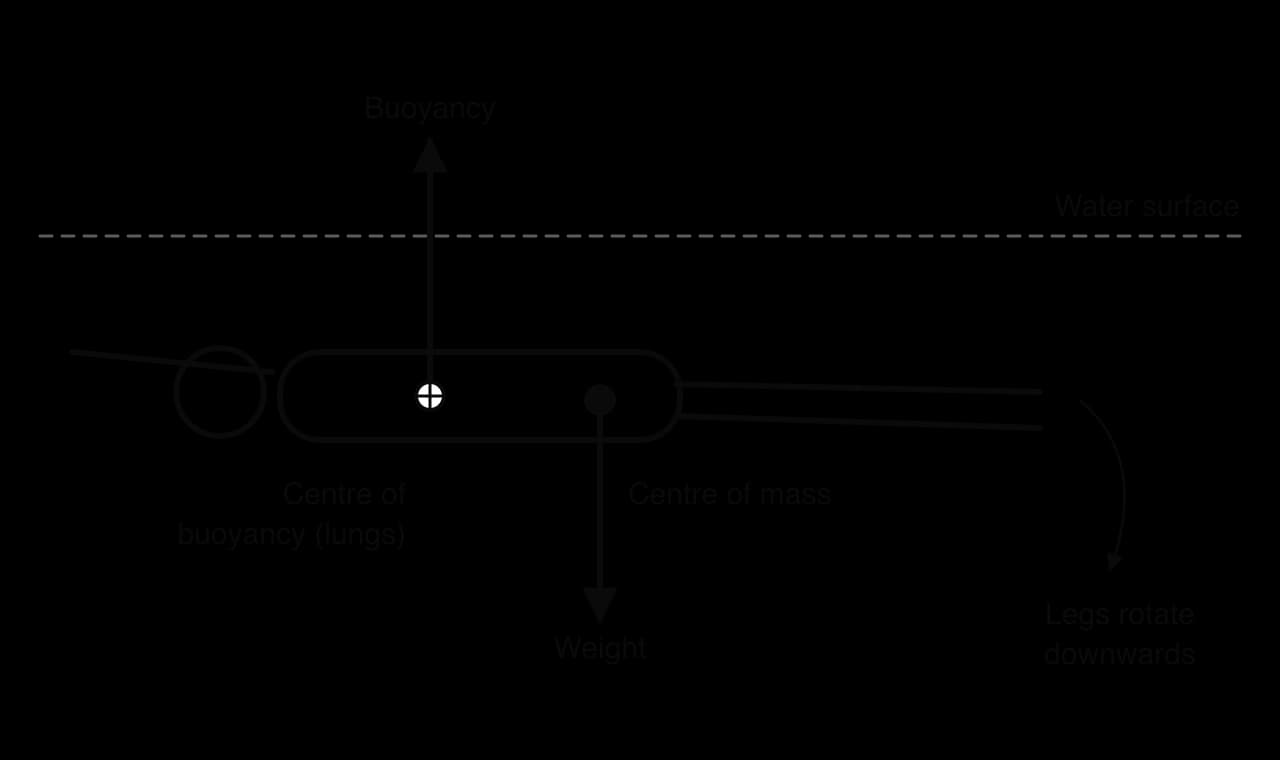
Because buoyancy acts upwards through the chest and weight acts downwards through the hips, the two forces are not in line. They produce a torque that rotates the swimmer so that the legs sink, until the centre of mass sits directly below the centre of buoyancy. A body angled with its legs low presents a larger area to the water and increases drag, so swimmers work to stay horizontal.
Swimmers "press the chest" (push the chest slightly down) to move the legs up and keep the body horizontal.
A steady flutter kick provides a small upward force at the legs that counteracts the torque.
Lean, muscular swimmers with dense legs must kick and position themselves more actively than swimmers with more body fat.
Drag in detail (HL only)
Drag arises because a moving body has to push fluid out of its way and drag a thin layer of fluid along with it. How the fluid flows around the body decides how large the drag is. Two patterns of flow are important. In laminar flow, the fluid moves in smooth, parallel layers that slide past each other without mixing. In turbulent flow, the fluid moves irregularly in eddies and swirls, and the layers mix.
As speed increases, or when the fluid meets a blunt or rough surface, the smooth layers break up.
Close to the surface of a moving body, the fluid is slowed down by friction with the surface: the fluid touching the surface moves with it, and each layer further out is dragged along a little less. This thin region of slowed fluid is the boundary layer. Whether the boundary layer is laminar or turbulent, and where it separates from the body, decides much of the drag on balls, cyclists and swimmers.

Surface drag
Surface drag (also called skin friction) is caused by friction between the surface of the body and the fluid in the boundary layer. It depends on the area of surface in contact with the fluid and on how rough that surface is. It is the main type of drag on long, thin, streamlined bodies, where little form drag is produced.
Swimmers reduce surface drag by shaving body hair before major competitions, wearing caps and tight, smooth suits, and, in the past, wearing full-body suits. Speed skaters, sprinters and cyclists wear one-piece skinsuits. On some suits, panels of textured fabric are placed on purpose where they trip the boundary layer into turbulence, which can reduce form drag in the same way as the dimples on a golf ball.
Form drag
Form drag (also called pressure drag or profile drag) is caused by the shape of the body. As fluid flows round a blunt body, it cannot follow the surface all the way round, so the flow separates from the body and leaves a turbulent, low-pressure region behind it called the wake. The fluid in front of the body is at high pressure, the wake at low pressure, and this pressure difference pulls the body backwards.
Form drag depends on the frontal area (the area the body presents to the oncoming fluid) and on its shape. Streamlining, giving a body a smooth, tapered shape, lets the fluid follow the surface further before it separates, so the wake is smaller and the pressure difference less.
Cycling. A rider in an upright position presents a large frontal area. Crouching low with the forearms on aero bars, using a teardrop-shaped helmet and disc wheels all reduce frontal area and form drag.
Skiing and speed skating. Downhill skiers hold a compact tuck between turns; skaters bend forward with the trunk nearly horizontal and an arm behind the back.
Swimming. A tight streamlined position after the start and each turn, with the arms extended and squeezed behind the head, reduces form drag while the swimmer glides.
Wave drag
Wave drag acts only on bodies moving at or near the boundary between two fluids, such as a swimmer, rower or kayaker at the water surface. Pushing water upwards and aside to make a bow wave in front and a trough behind takes energy, and the energy carried away by the waves is lost to the swimmer.
Wave drag increases very rapidly with speed, so it is a large part of the total drag on a fast swimmer. Swimming a short distance underwater, below the surface, avoids most of it. That is why elite swimmers spend several metres underwater after each start and turn using a dolphin kick. To stop races becoming mainly underwater, World Aquatics rules require swimmers in freestyle, backstroke and butterfly to break the surface within 15 m of the start and of each turn. Pool design also matters: deep pools and wave-absorbing lane ropes and gutters reduce the waves that reach other swimmers.
Factors that affect drag
Taking the three types together, the total drag on a body depends on five factors.
Factor | Effect on drag | Sporting example |
|---|---|---|
Speed relative to the fluid | Drag rises roughly with the square of the speed: doubling speed gives about four times the drag | Cyclists in a time trial spend most of their power overcoming drag |
Frontal area | A larger area facing the flow increases form drag | Aero tuck in cycling; streamlined glide in swimming |
Shape | Blunt shapes separate the flow early and create a large wake | Teardrop helmets; tapered bobsleigh noses |
Surface texture | Rough surfaces increase surface drag, but well-placed roughness can delay separation and reduce form drag | Shaving; golf ball dimples |
Fluid density | Denser fluids produce more drag | Water versus air; altitude; salinity |
The relationship with speed explains why small changes in speed have large effects. One way of writing the drag force is as being proportional to the fluid density, the frontal area and the square of the velocity:
This proportionality is a model for comparing situations rather than a formula for exact values. If the density and frontal area stay the same, the drag changes with the square of the speed ratio.
Golf ball dimples and the turbulent boundary layer
A golf ball is the clearest example of roughness that reduces drag. Around a smooth ball, the boundary layer is laminar and separates from the ball early, near its widest point, leaving a wide, low-pressure wake and a large form drag. The dimples make the boundary layer turbulent. A turbulent boundary layer carries more energy close to the surface, so it can follow the curved surface further round before it separates.
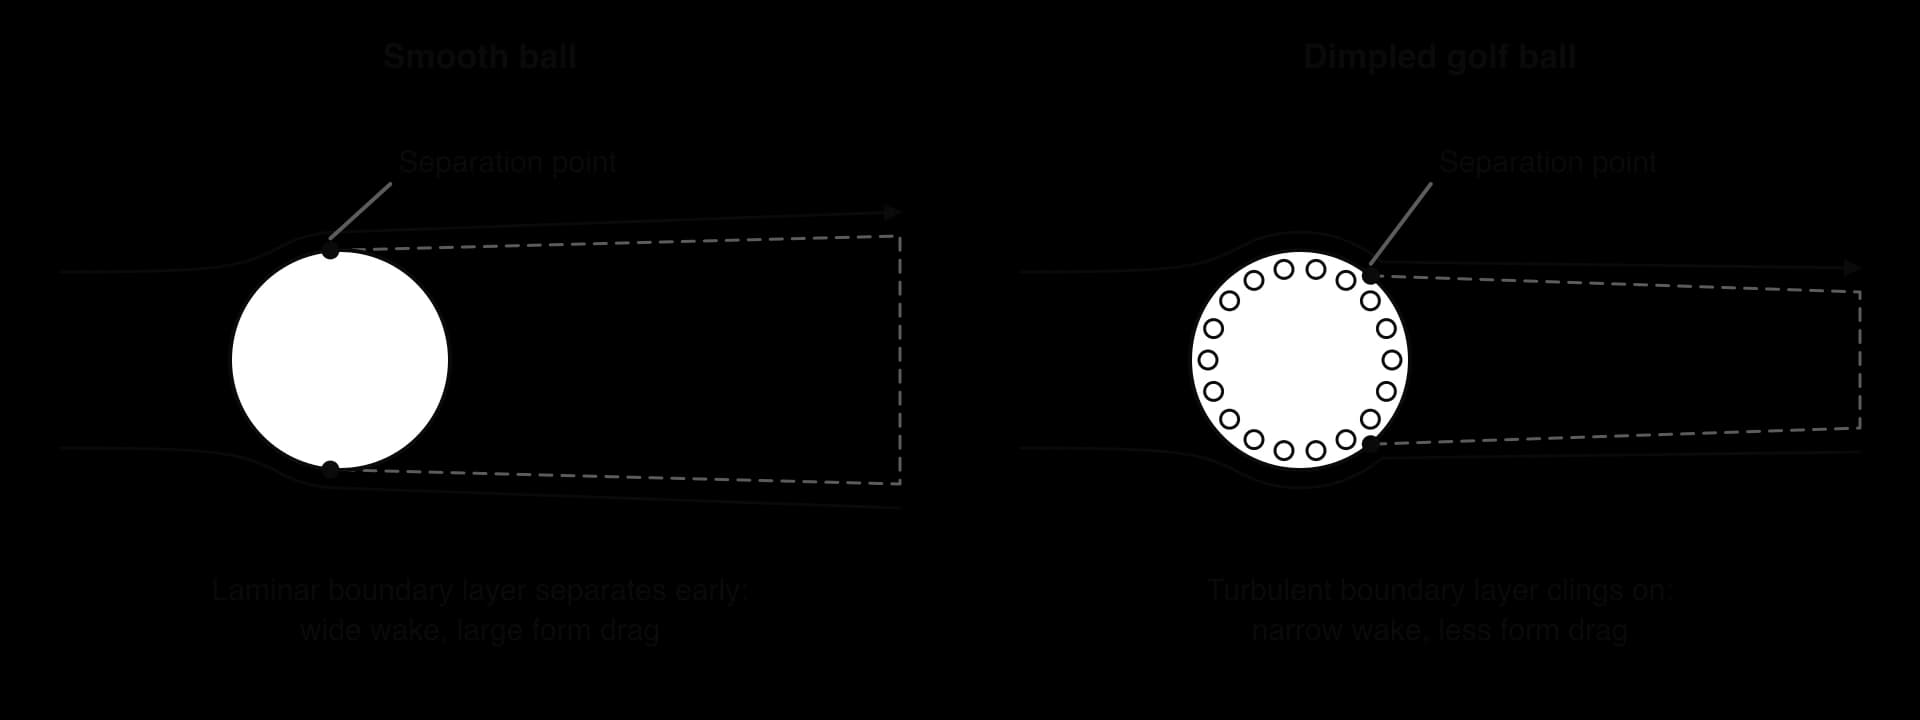
The later separation gives a much narrower wake and a smaller pressure difference between the front and back of the ball. Surface drag increases slightly because the surface is rougher, but the fall in form drag is far larger, so a dimpled ball travels much further than a smooth one when struck at the same speed. The dimples also increase the lift produced by backspin through the Magnus effect.
Drafting
Drafting means moving closely behind another athlete or vehicle so that the one in front blocks much of the oncoming air. The follower travels in the low-pressure, slower-moving air of the leader’s wake, so their drag and the energy they need at a given speed both fall. The leader also gains a small benefit, because the follower fills part of the low-pressure wake behind them.
Cycling road races are shaped by drafting: riders in the middle of the peloton work much less than those at the front, and teams take turns at the front to share the cost. In middle- and long-distance running the effect is smaller, because running speeds are lower, but it is still large enough to matter. In Eliud Kipchoge’s sub-two-hour marathon run in Vienna in October 2019, 41 pacemakers rotated in groups in a V-shaped formation ahead of him to shield him from the air, one reason the time of 1:59:40 was not eligible as a world record.
Sources: Wikipedia, INEOS 1:59 Challenge, 2019.
Increasing drag on purpose: training
Coaches sometimes increase drag deliberately to overload the muscles used in a sport. Sprinters tow small parachutes, swimmers wear drag suits or tether themselves to resistance cords, and rowers attach drag devices to the boat. The extra drag raises the force the athlete must produce at a given speed, which applies the training principles of progressive overload and specificity, because the movement pattern stays close to the competition skill. If the extra drag is too large, the technique and speed change so much that the training becomes less specific.
Lift, Bernoulli’s principle and the angle of attack (HL only)
Drag acts along the direction of the flow. Lift is the component of the fluid force that acts at right angles (perpendicular) to the direction of the flow past the body. Despite its name, lift is not always upwards: it can act sideways or downwards, depending on how the body is shaped and tilted.
Lift lets a projectile stay in the air longer than gravity alone would allow. A discus or javelin thrown well, and a ski jumper in flight, are not true parabolic projectiles: lift partly supports them, so they travel further than an object of the same mass would in a vacuum at the same release speed.
Bernoulli’s principle
Bernoulli’s principle states that where a fluid flows faster, its pressure is lower, and where it flows more slowly, its pressure is higher. An aerofoil (the cross-section of a wing) is shaped so that air flowing over its curved upper surface speeds up and air flowing under its flatter lower surface does not speed up as much. The pressure above the aerofoil is therefore lower than the pressure below it, and the pressure difference produces a lift force towards the low-pressure side.
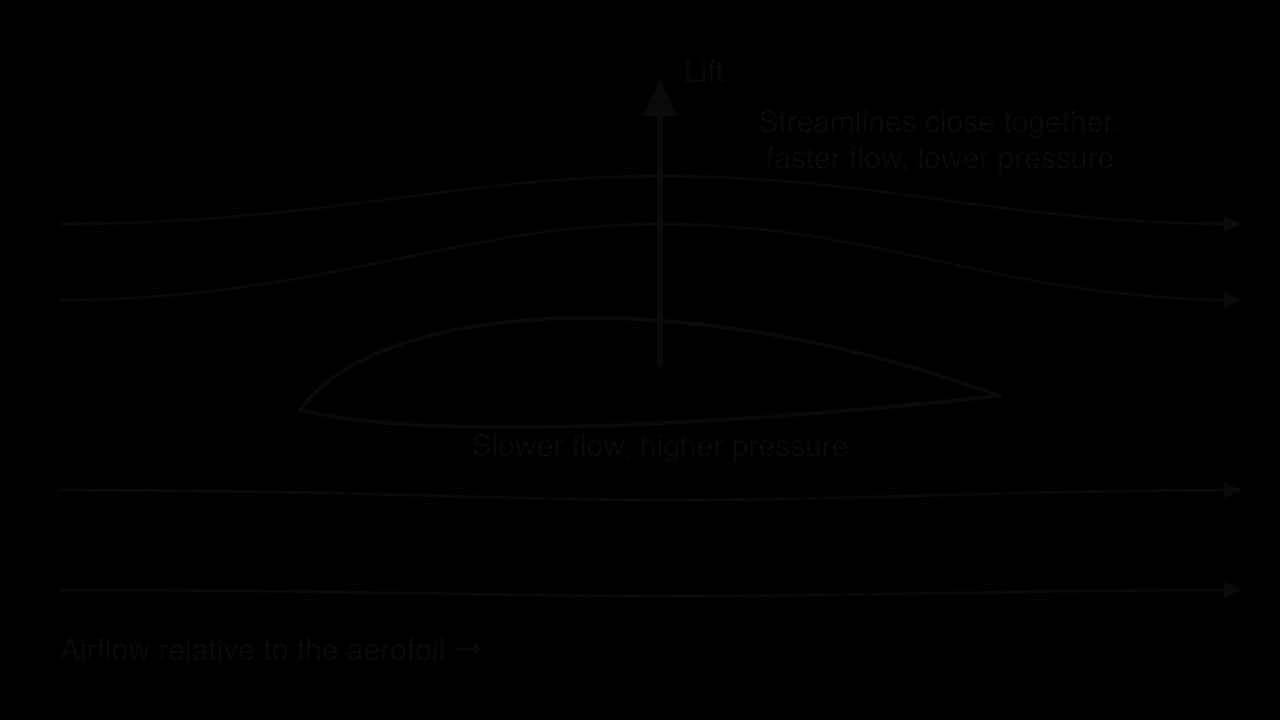
Lift can be explained step by step:
The shape and tilt of the body make the fluid flow faster over one surface than the other.
By Bernoulli’s principle, the faster-flowing side has lower pressure.
The pressure is now higher on one side of the body than on the other.
The pressure difference produces a net force from the high-pressure side towards the low-pressure side: lift, perpendicular to the flow.
Racing cars turn the principle upside down. A Formula 1 car’s front and rear wings are inverted aerofoils, so the faster, lower-pressure flow is underneath them and the lift acts downwards. This "downforce" pushes the tyres onto the track, increasing the normal reaction force and therefore the friction available, so the car can corner faster. The same reasoning explains the rear spoilers on some road cars and the shaped hulls of bobsleighs.
The angle of attack
The angle of attack is the angle between the long axis of a body (such as a discus, javelin or ski jumper) and the direction of the fluid flowing past it, which is opposite to the body’s direction of travel. Tilting a flat body to the flow deflects the fluid: air is pushed downwards off the lower surface, so, by Newton’s third law, the air pushes the body upwards. Tilting also makes the flow over the upper surface faster than underneath, adding lift through Bernoulli’s principle.
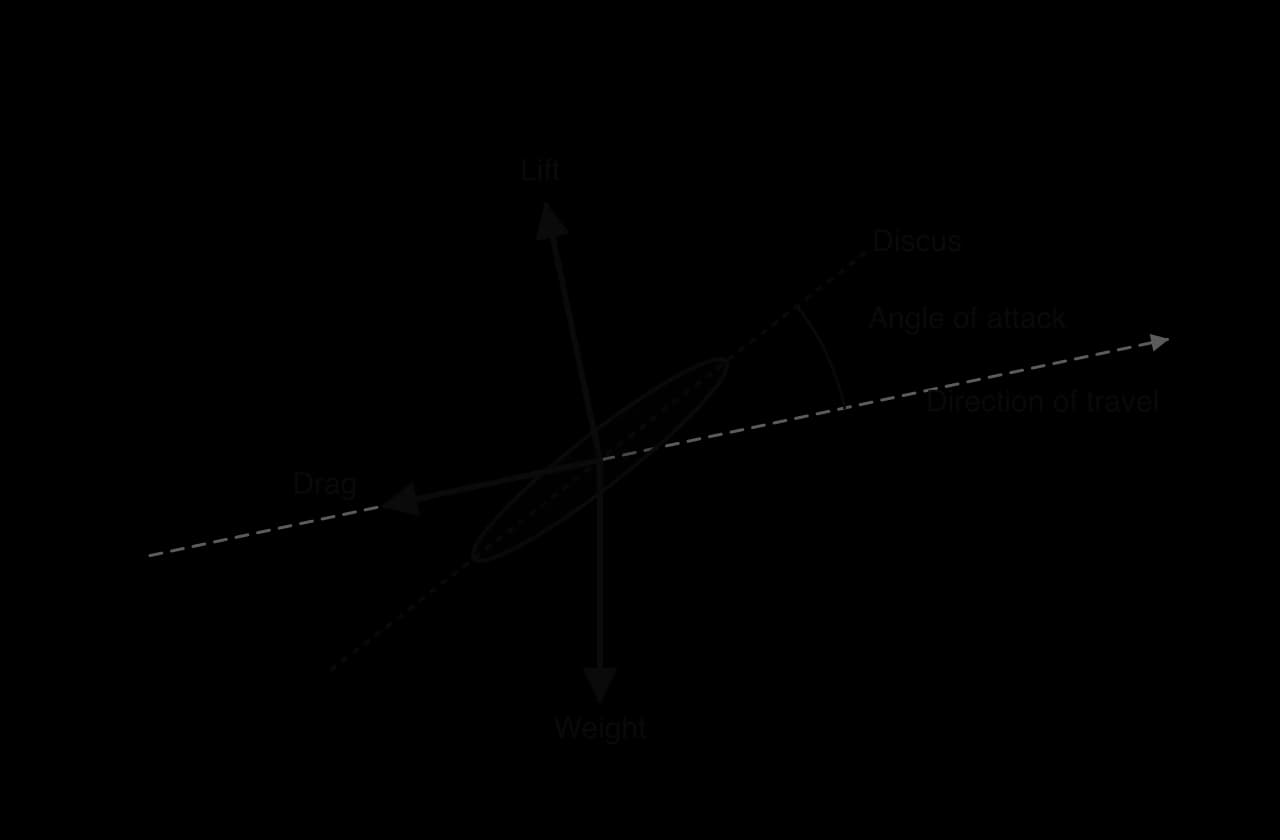
Increasing the angle of attack increases lift, but only up to a point. Drag also rises as the body presents more of its area to the flow. At a large angle of attack the flow can no longer follow the upper surface, so it separates, the wake grows, lift falls sharply and drag rises: the body "stalls". The best angle of attack is therefore a compromise that gives the most lift for the least extra drag, and it is usually small.
Sport | How lift and the angle of attack are used |
|---|---|
Discus | Released with a small angle of attack so the discus "glides"; it travels further into a moderate headwind, because lift rises with the relative air speed |
Javelin | Lift extends the flight; the rules on the javelin’s centre of mass make it tip nose-down so it lands point first |
Ski jumping | The jumper’s body and skis, held in a V shape with the body leaning far forward, act as a wing; lift slows the jumper’s descent so they travel much further than a simple projectile would |
Swimming | The hand and forearm act like a hydrofoil: pitching the hand at an angle to the water produces lift that helps propel the swimmer, together with drag on the hand |
Ski jumping shows how technique and lift interact. Until the late 1980s jumpers held their skis parallel; the V-style, with the ski tips spread apart, increased the area facing the airflow and the lift on the jumper, and it replaced the parallel style within a few years. Because the jumper’s suit and body form part of the "wing", the size and air permeability of ski jumping suits are tightly regulated.
The Magnus effect (HL only)
A ball that is spinning as it flies drags a thin boundary layer of air round with its surface. On one side of the ball, the surface moves in the same direction as the oncoming air; on the other side, it moves against it. The Magnus effect is the deflection of a spinning ball’s path that results from this difference: the ball experiences a force at right angles to its direction of travel, towards the side where the surface moves with the airflow.
The direction of the Magnus force depends on the direction of spin relative to the direction of travel.
The mechanism can be explained step by step for a ball moving to the right with topspin (its top surface moving forwards):
Relative to the ball, the air flows from front to back over both the top and the bottom of the ball.
On the top, the ball’s surface moves forwards, against the airflow. Friction in the boundary layer slows the air, so the flow is slower and the pressure higher.
On the bottom, the surface moves backwards, with the airflow, so the air there flows faster and the pressure is lower (Bernoulli’s principle).
The pressure difference produces a force from the high-pressure top to the low-pressure bottom: the Magnus force acts downwards, so the ball dips.
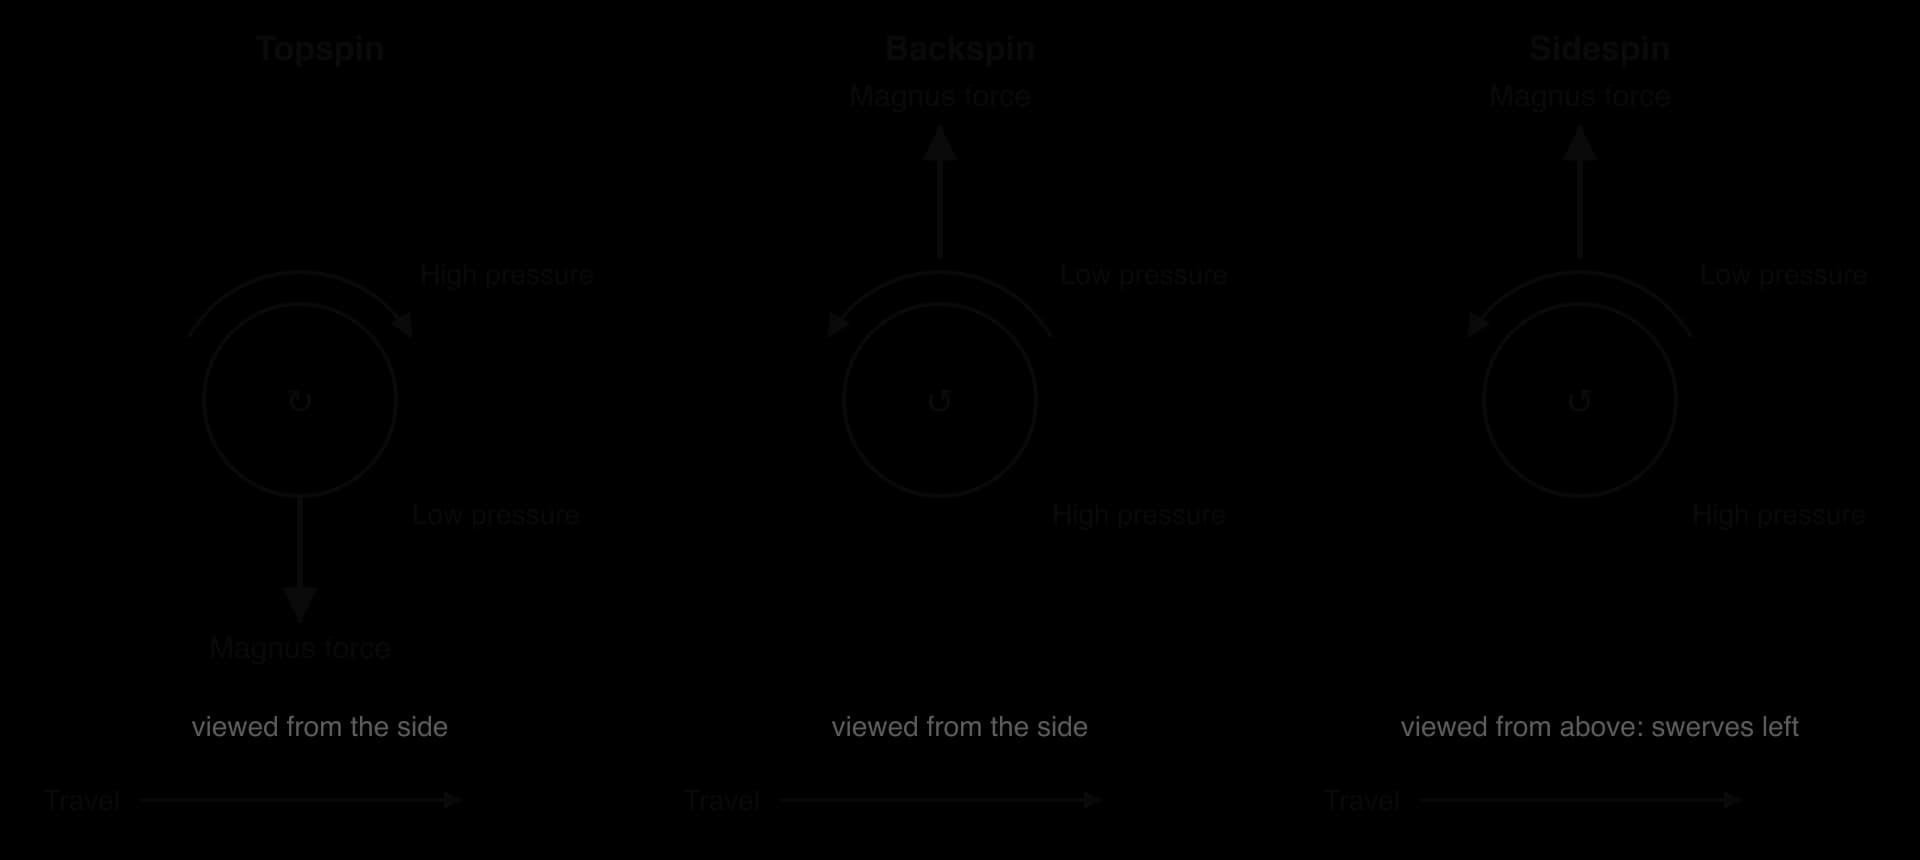
In more detail, the spinning surface also changes where the boundary layer separates on each side, so the wake behind the ball is pushed to one side. The air deflected one way pushes the ball the other way (Newton’s third law). Both explanations predict the same direction of force.
Topspin, backspin and sidespin
Type of spin | Direction of the Magnus force | Effect on the flight | Examples |
|---|---|---|---|
Topspin (top of ball moves forwards) | Downwards | The ball dips sooner than a parabola would and bounces forward and high | Tennis groundstrokes and the topspin lob; table-tennis loops; a dipping football shot |
Backspin (top of ball moves backwards) | Upwards | The ball stays in the air longer and lands at a shallower angle; it can check or bounce backwards | Golf drives and wedge shots; a tennis slice; basketball shots |
Sidespin (ball spins about a near-vertical axis) | Sideways | The ball swerves left or right; a hook or slice in golf | Football free kicks and corners; baseball curveballs; golf hooks and slices |
Tennis players use heavy topspin to hit the ball hard and still have it dip into the court: the downward Magnus force allows a faster, higher trajectory over the net without the ball landing long. In golf, the loft of the club face gives the ball backspin, and the upward Magnus force, made stronger by the dimples, keeps the ball in the air for much longer than a non-spinning ball. Too much sidespin from an off-centre strike curves the ball away from the target as a hook or a slice.
Roberto Carlos’s free kick for Brazil against France in Lyon on 3 June 1997 is the best-known sidespin example in football. Struck from about 35 m with the outside of his left foot, the ball first swerved wide of the wall and then curled back into the goal, because the sidespin kept acting as the ball slowed and its curve tightened.
 YouTube
A ball struck with almost no spin behaves very differently. A "knuckleball" free kick in football, or a float serve in volleyball, has no steady Magnus force, so small, changing differences in the airflow around the seams make it wobble unpredictably, which makes it hard for a goalkeeper or receiver to judge.
Sporting, ethical and regulatory implications (HL only)
Because fluid forces have such large effects at elite level, equipment that changes them can change results. Governing bodies then have to decide whether a new suit, ball, implement or technique is a legitimate innovation or an unfair advantage that changes the nature of the sport. Their decisions usually weigh fairness, safety, the athlete’s role compared with the technology’s, the cost of access and the meaning of records.
The javelin redesign of 1986
In July 1984, Uwe Hohn of East Germany threw the men’s javelin 104.80 m. Throws of that length were difficult to stage safely inside a stadium, and the old javelin often glided down and landed flat, causing disputes about whether a throw was valid. From 1 April 1986, the men’s javelin was redesigned: its centre of mass was moved 4 cm forward and the shape changed so that more of its area was behind the centre of mass.
The new javelin produces lift in a way that turns its nose down earlier in the flight, so it lands point first, and throws fell by about 10%. Hohn’s mark became a permanent "eternal" record with the old implement; the current world record with the redesigned javelin is 98.48 m (Jan Železný, 1996). The women’s javelin was redesigned in the same way in 1999.
Sources: Wikipedia, Javelin throw, citing World Athletics (IAAF) rules, 2026.
Ski jumping suits
A ski jumper’s suit forms part of the wing, so a larger suit or one that lets less air through produces more lift. The International Ski and Snowboard Federation (FIS) regulates suit size relative to the athlete’s body and the fabric’s air permeability, and inspects suits at competitions. At the 2025 World Championships in Trondheim, two Norwegian jumpers were disqualified after the men’s large hill event when their suits were found to have been altered after inspection, with extra stitching that increased the suit’s surface area. FIS later suspended both athletes for three months and the team’s coaches and a suit technician for 18 months.
Sources: FIS, 12 March 2025; Sport Resolutions, 2025; Flashscore, 2026.
Other regulations
Wind and altitude in athletics. Records in sprints and horizontal jumps are not accepted with a tailwind above 2.0 m s⁻¹; records set at altitude are accepted, which some argue gives an advantage that the rules do not correct.
Running shoes. Since 2020, World Athletics has limited the thickness of shoe soles. Shoes such as the Nike Vaporfly changed performance mainly through energy return from foam and carbon plates, which store and return elastic potential energy, rather than through fluid forces.
Bobsleigh. Heated runners are banned, because warming the steel runners would melt a thin layer of ice and reduce friction, giving an advantage from equipment rather than athletes.
Evaluation: innovation or unfair advantage?
Arguments for allowing technology that reduces drag or increases lift | Arguments for restricting it |
|---|---|
Sport has always used better equipment (lighter bikes, synthetic tracks); banning innovation is arbitrary | Results may depend on the equipment and its cost rather than on the athlete’s ability and training |
New technology can make sport safer (aerodynamic helmets, better-designed implements) | Athletes or nations who cannot afford the latest equipment are at a disadvantage |
Faster performances and records attract spectators and sponsors | Records set with banned equipment make comparisons across eras meaningless |
Research into fluid forces benefits other fields, such as medicine and transport | Some changes reduce safety (javelins landing outside the field) or reward manipulation of rules (illegal suits) |
Most governing bodies take a middle position. They accept changes that are available to everyone and that keep the athlete’s skill and physiology at the centre of performance, and they restrict changes that alter the basic nature of the event or that only some athletes can obtain. The difficulty is drawing the line: a shaved swimmer, a dimpled golf ball and a full-body polyurethane suit all reduce drag, but only the last was banned. A useful test is whether the technology changes how the sport is performed and who can win, rather than whether it improves performance at all.
Polyurethane swimsuits, 2008–2009 (HL only)
On 13 February 2008, six months before the Beijing Olympic Games, Speedo launched the LZR Racer, a full-body suit made of woven elastane-nylon with bonded polyurethane panels and welded rather than stitched seams. The manufacturer reported that it reduced skin friction (surface drag) by 24% compared with its previous suit. Within a week, swimmers wearing it had set world records, and at the Beijing Games 23 of the 25 world records were set by swimmers in the suit.
Rival companies responded with suits made entirely of polyurethane, such as Arena’s X-Glide, Adidas’s Hydrofoil and the Italian Jaked suits. At the 2009 World Championships in Rome, swimmers set 43 world records in the long-course pool, more than at any previous competition.
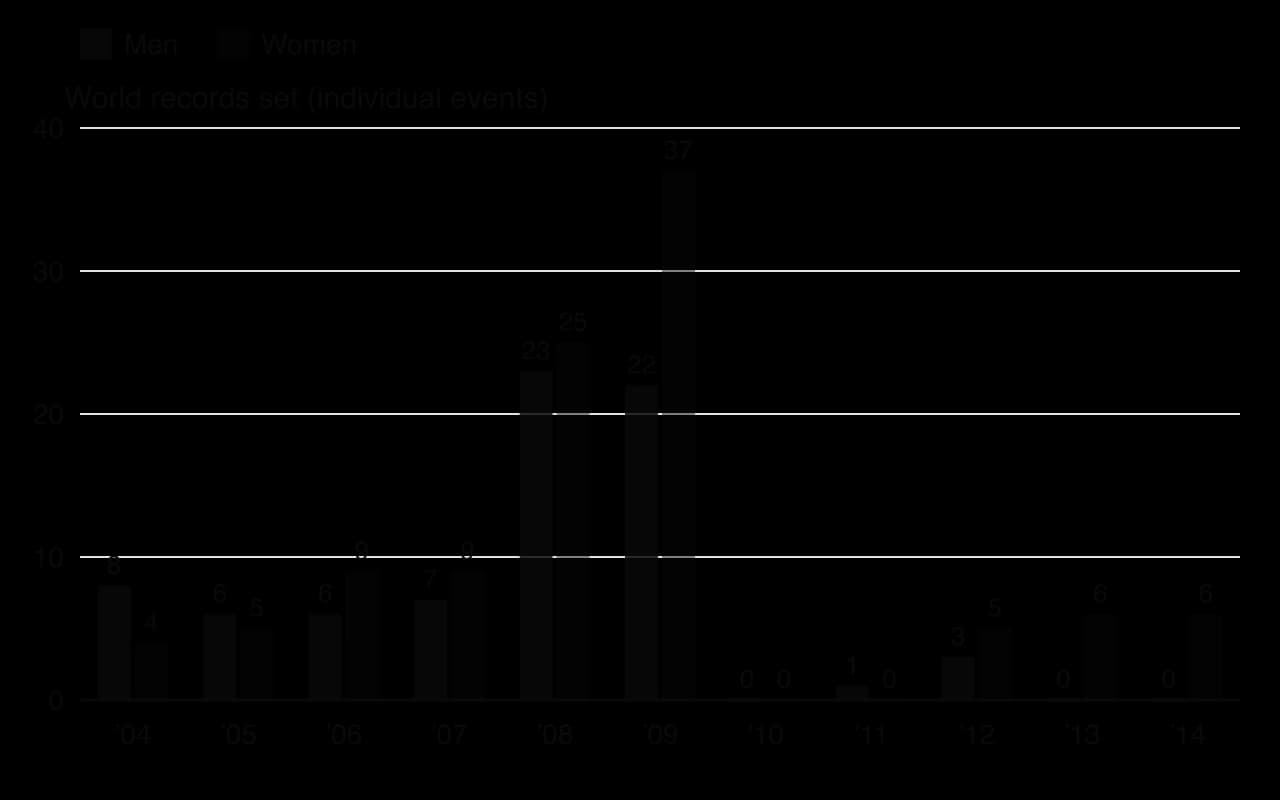
The chart shows how sudden the change was. From 2004 to 2007, swimmers set an average of 13.5 world records a year in the 34 individual long-course events. In 2008 and 2009 they set 107, almost four times the earlier rate. In 2010, the first year after the suits were banned, no individual long-course world record was set, and the numbers stayed low for several years afterwards.
The mechanisms: how the suits changed the fluid forces
Surface drag. Polyurethane is smoother than woven fabric, and welded seams removed the stitching that disturbs the boundary layer. The suits therefore reduced surface drag over almost the whole body.
Form drag. The suits were very tight and compressed the body into a more streamlined shape, reducing the frontal area and smoothing the outline, particularly around the hips and thighs. Compression also reduced the vibration of soft tissue, which disturbs the flow.
Buoyancy and wave drag. The non-permeable suits trapped air against the body and added buoyancy, especially at the hips and legs; FINA’s 2009 rules specifically limited suit buoyancy. The swimmer floated higher and more horizontally, which reduced form drag and moved more of the body out of the water, reducing wave drag. It also counteracted the torque that makes the legs sink.
Each mechanism is a direct application of fluid mechanics: less drag at the same speed means less power is needed, or more speed for the same power. Because drag rises with the square of speed, even a few per cent less drag produced visible improvements in race times, and the benefit appeared to be greater for some swimmers, depending on body shape and how much the suit improved their body position.
The regulatory response
Date | Decision |
|---|---|
February 2008 | LZR Racer launched; approved for competition |
August 2008 | Beijing Olympic Games: 23 of 25 world records set by swimmers wearing the LZR Racer |
March 2009 | FINA (now World Aquatics) introduces limits on suit thickness and buoyancy; suits may not extend beyond the shoulders and ankles |
24 July 2009 | The FINA Congress in Rome votes almost unanimously to ban full-body suits |
1 January 2010 | New rules: suits must be made of textile; men’s suits may cover from waist to knee and women’s from shoulder to knee; no zips |
The governing body’s reasoning was that performance should depend on the swimmer, not on the suit. Swimmers sponsored by one company were tied to suits that might be slower than their rivals’, and many argued that times set in 2008–2009 could not be fairly compared with times before or after. Most of the records set in the suits nevertheless remained on the books, so for several years afterwards some events had records that textile-suited swimmers found very hard to beat.
What the case shows, and its limits
The episode is a natural experiment: a technology was introduced, records multiplied, and when the technology was removed the records almost stopped. That pattern is strong evidence that the suits caused much of the improvement, because training, nutrition and talent did not change suddenly in 2008 or in 2010. A study of top swimming performances from 1990 to 2010 examined the other possible explanations, such as rule changes, improvements in training science and exceptional individual talent, alongside the suits.
The evidence still has limits. A count of world records is a crude measure: one exceptional swimmer can break several, and Olympic years often produce more records than other years. The exact size of each mechanism is hard to measure, because laboratory drag tests on suits were often carried out or funded by the manufacturers, and swimmers knew which suit they were wearing, so expectation (a placebo effect) may have added to the benefit.
Sources: Wikipedia, LZR Racer and world record progression pages, citing FINA/World Aquatics, 2026; O’Connor and Vozenilek, Journal of Strength and Conditioning Research, 2011.
Analysis questions
Using the chart, calculate the percentage change in the number of world records from 2007 to 2009.
Explain which type of drag a suit that increased buoyancy at the hips would reduce, and why.
To what extent does the fall in world records in 2010 prove that the suits caused the earlier rise? Consider other factors that change the number of records in a year.
Shaving body hair, wearing a cap and wearing a polyurethane suit all reduce drag. Suggest criteria a governing body could use to decide which to allow.
Case study: release speed, angle and height in the men’s shot put final, London 2017
At the 2017 World Championships in London, a biomechanics team from Leeds Beckett University, working for the IAAF (now World Athletics), filmed the men’s shot put final with three high-speed cameras recording 150 frames per second. A calibration frame of known size was filmed around the throwing circle before and after the competition, so that the position of the shot could be reconstructed in three dimensions. For the best throw of each of the twelve finalists, the team calculated the three release conditions that decide a projectile’s path: the speed, angle and height of release.
Place | Athlete | Distance of analysed throw (m) | Speed of release (m s⁻¹) | Angle of release (°) | Height of release (m) |
|---|---|---|---|---|---|
1 | Tomas Walsh (NZL) | 22.03 | 14.15 | 35.1 | 2.12 |
2 | Joe Kovacs (USA) | 21.66 | 13.84 | 39.9 | 2.22 |
3 | Stipe Žunić (CRO) | 21.46 | 13.68 | 37.8 | 2.20 |
4 | Tomáš Staněk (CZE) | 21.41 | 13.88 | 36.1 | 2.11 |
5 | Michał Haratyk (POL) | 21.41 | 13.65 | 39.6 | 2.15 |
6 | Ryan Crouser (USA) | 21.20 | 13.72 | 36.4 | 2.10 |
7 | Ryan Whiting (USA)* | 20.66 | 13.49 | 41.9 | 2.24 |
8 | Konrad Bukowiecki (POL) |
The table gives the release values of each finalist’s best throw (*Whiting’s second-best throw, because his best could not be recorded). The shot is a heavy, compact projectile with a very high ratio of weight to air resistance, so its path is close to a parabola. The team confirmed this by calculating each throw’s range from its release values with the equations of projectile motion: the calculated ranges differed only slightly from the official distances.
Speed of release
Walsh won with 22.03 m and had the highest speed of release, 14.15 m s⁻¹. Across the twelve finalists, the speed of release varied by only about 7%, from 13.24 to 14.15 m s⁻¹, yet the throwers with higher speeds generally threw further. The graph shows a strong positive correlation between speed of release and distance, with a correlation coefficient of r = 0.78. For twelve pairs of values this is above the critical value of about 0.58 at p = 0.05, so the relationship is unlikely to be due to chance.
Neither the angle of release (r = 0.16) nor the height of release (r = 0.09) was significantly correlated with distance in this group. This does not mean that angle and height are unimportant: all the finalists used angles and heights within a fairly narrow range, so differences in speed explain more of the differences in distance.
Angle and height of release
No finalist released the shot at 45°. The angles of release ranged from 30.4° to 41.9°, with a mean of 36.7°. Two effects explain this: the shot is released about 2 m above the ground and lands at ground level, and a thrower can produce a greater speed of release at lower angles. Bukowiecki shows the cost of going too low: he had the second-highest speed of release (14.02 m s⁻¹) but the lowest angle (30.4°), and finished eighth with 20.89 m. Kovacs released the shot more slowly, at 13.84 m s⁻¹, but at 39.9° and from 2.22 m, and won the silver medal with 21.66 m.
Release heights ranged from 1.97 m to 2.29 m. Height of release depends on technique as well as body size. Kovacs, the shortest finalist at 1.81 m, released the shot at 2.22 m (122% of his height), while Crouser, listed at 2.01 m, released it at 2.10 m (105%). The three throwers who released the shot furthest beyond the stop board had among the lowest release heights and angles, which suggests another trade-off between the release conditions.
 YouTube
What the case shows, and its limits
The data support the theory of projectile motion. Speed of release separated the finalists most clearly, and the three medallists combined a high speed of release with angles of 35–40° and release heights of 2.1–2.2 m. No single condition decided the result: the third, fourth and fifth places were separated by only 5 cm, and each of those throwers used a different combination of speed and angle.
The study also has limits. Only one throw per athlete was analysed, which may not represent that athlete’s usual technique; Crouser and Kovacs each had a longer throw that was ruled a foul and was not analysed. The sample was twelve elite men, eleven of whom used the rotational technique, so the findings may not apply to women, junior throwers or the glide technique. With twelve throwers, a correlation shows an association rather than proving cause. To check the reliability of the measurements, the same operator digitised a whole throw again 48 hours later and found only minimal random and systematic errors.
Analysis questions
Calculate the percentage difference in speed of release between Walsh and Gag, relative to Gag.
Using the data for Bukowiecki and Kovacs, explain why the athlete with the greater speed of release did not throw further.
Suggest why the height of release correlated only weakly with distance in this group, although a higher release point increases the range of a projectile.
Sources: Dinsdale, Thomas and Bissas, Biomechanical report for the IAAF World Championships London 2017: shot put men’s, Leeds Beckett University and IAAF, 2018.
Exam practice
Projectile questions range from one-mark recall to sketches and calculations, and HL questions add the fluid forces and their regulation.
Paper 1A-style multiple-choice questions
Questions on the components of velocity test whether students separate the two components.
Some questions describe an object and ask about the shape of its path.
HL questions (HL only)
HL structured questions often ask for a calculation using a proportional relationship, followed by an explanation.
Paper 1B-style data-based question
Researchers filmed three experienced male long jumpers with video cameras at the take-off board (100 Hz for athletes 1 and 3, 50 Hz for athlete 2). Jumps with a wind speed outside ±2 m s⁻¹ were excluded. For each athlete they measured the take-off speed and angle in competition jumps, and then used each athlete’s jumps over a wide range of angles to calculate his optimum take-off angle.
Athlete | Competition jumps analysed (athlete 2: simulated competition) | Official distance (m) | Take-off speed (m s⁻¹) | Competition take-off angle (°) | Calculated optimum take-off angle (°) |
|---|---|---|---|---|---|
1 | 23 | 7.89 ± 0.16 | 9.56 ± 0.43 | 21.4 ± 1.6 | 20.9 ± 0.7 |
2 | 4 | 7.80 ± 0.26 | 9.78 ± 0.26 | 23.5 ± 1.0 | 21.6 ± 2.1 |
3 | 12 | 7.05 ± 0.17 | 8.70 ± 0.26 | 22.7 ± 0.5 | 25.4 ± 1.6 |
Sources: Linthorne, Guzman and Bridgett, Journal of Sports Sciences, 2005 (Tables II and VI; competition values are mean ± SD, optimum angles ± standard error).
Paper 2-style structured questions
Extended-response question
HL extended-response question (HL only)
Summary
A projectile moves under gravity and air resistance only; its path is set at release, and with gravity alone it is a symmetrical parabola.
The horizontal component of velocity is constant without air resistance; the vertical component falls to zero at the peak and then increases downwards.
Speed of release has the largest effect on distance; 45° is optimal only when release and landing heights are equal and air resistance is negligible.
A release height above the landing level, and the fall in release speed at steeper angles, make the best angle in most throws and jumps well below 45°.
A low ratio of weight to air resistance gives a shorter, asymmetric path with a steep descent (shuttlecock); a high ratio gives a near-parabola (shot).
Random errors scatter points about a best-fit curve; systematic errors shift every point in the same direction.
Air density falls with altitude, temperature and humidity, reducing drag and lift; wind changes the relative air speed; salt water increases buoyancy (HL).
Buoyancy equals the weight of fluid displaced; drag has surface, form and wave components that athletes reduce by surface treatment, streamlining and swimming underwater (HL).
Lift acts perpendicular to the flow and comes from Bernoulli’s principle and the angle of attack; the Magnus effect makes spinning balls dip, rise or swerve (HL).
Technology that changes fluid forces raises questions of fairness, cost and safety, and has led to rules on swimsuits, javelins and ski jumping suits (HL).
Self-check
- To do:
I can outline what a projectile is and draw the forces acting on it in flight.
- To do:
I can describe how the horizontal and vertical components of velocity change during flight.
- To do:
I can explain how speed, angle and height of release affect the distance a projectile travels.
- To do:
I can explain why the best angle of release in the shot put and long jump is below 45°.
- To do:
I can sketch and explain the paths of objects with high and low ratios of weight to air resistance.
- To do:
I can identify random and systematic errors on a graph of projectile data.
- To do:
I can explain how altitude, temperature, humidity, wind and salinity change fluid forces (HL).
- To do:
I can explain buoyancy, surface, form and wave drag, lift and the Magnus effect with sporting examples (HL).
- To do:
I can evaluate the regulation of technology that changes fluid forces, such as polyurethane swimsuits (HL).