
Describe motion with displacement, velocity and acceleration, use motion graphs and the equations of motion, and analyse free fall, stopping distances and projectiles.
Each is in the Physics glossary, with every other term in the subject.
The rate of change of velocity, ; a vector quantity measured in .
The acceleration of a body falling under gravity alone, ; near the Earth's surface , directed downwards.
A graph of acceleration against time; the area between the line and the time axis is the change in velocity.
The displacement of a body divided by the time taken, ; on a displacement–time graph, the gradient of the chord between two times.
The distance a vehicle travels from the moment the brakes are applied until it stops; for a constant deceleration it is proportional to the square of the initial speed.
One of two perpendicular vectors that together add up to a given vector; a vector at angle to the horizontal has components and .
The change in position of a body, from its initial to its final position; a vector quantity measured in metres.
A graph of displacement (or position) against time; its gradient at any time is the velocity.
The total length of the path travelled by a body; a scalar quantity measured in metres.
The four equations linking , , , and for a body moving in a straight line with uniform acceleration.
The force exerted by a gas or liquid on a body moving through it, opposite to the body's velocity relative to the fluid; it increases with speed.
Motion under the influence of gravity alone, with no other force (such as fluid resistance) acting.
The velocity of a body at one instant; on a displacement–time graph, the gradient of the tangent at that time.
The description of motion in terms of position, velocity and acceleration, without considering its causes.
The fixed reference point from which positions are measured.
Where a body is relative to a chosen origin, given as a distance with a direction (or sign).
A body that has been launched and then moves under gravity (and, in real cases, fluid resistance) with no other force acting.
The horizontal distance travelled by a projectile between its launch point and the point where it lands.
The time between a person seeing (or hearing) a signal and starting to respond to it, such as a driver seeing a hazard and pressing the brake.
A quantity that has magnitude only, such as distance, speed, mass or time.
The rate of change of distance travelled; a scalar quantity measured in . It is the magnitude of the velocity.
The total distance a vehicle travels from the moment the driver sees a hazard until it stops: thinking distance plus braking distance.
The constant speed reached by a body falling through a fluid when the upward forces on it balance its weight, so that its acceleration is zero.
The distance a vehicle travels at constant speed during the driver's reaction time: speed × reaction time.
The total time a projectile spends in the air, from launch until it lands.
The path followed by a moving body; for a projectile with no fluid resistance it is a parabola.
Acceleration that stays the same in magnitude and direction, so that the velocity changes by equal amounts in equal times.
A quantity that has both magnitude and direction, such as displacement, velocity, acceleration or force.
The rate of change of displacement; a vector quantity measured in .
A graph of velocity against time; its gradient is the acceleration and the area between the line and the time axis is the displacement.
Kinematics is the description of motion without asking what causes it. It answers three questions about a moving body: where it is, how fast its position is changing, and how fast that rate is itself changing. The same small set of quantities is used to time athletics races, to design safe road speeds, to aim a free kick and to plan the path of a spacecraft.
Kinematics is the starting point of mechanics. Forces and momentum (A.2) explain why velocities change, and energy (A.3) gives a second way to solve many of the same problems, but both rely on the language of displacement, velocity and acceleration built up here.
122 exam-style questions on this subtopic, written in the style of the IB papers. The first has its markscheme open. Counted on
A ball is thrown vertically upwards. Air resistance is negligible. Which is correct about the ball at its highest point?
One of 80 short multiple-choice questions on A.1. Pick an answer to see why it's right or wrong.
A ball is launched twice at the same speed and angle: once with negligible fluid resistance and once with significant fluid resistance. How do the maximum height and the range compare with fluid resistance?
The official deck for this part of the syllabus.
What is kinematics?
State the three quantities used to describe the motion of a body.
The entries of the physics data booklet that A.1 uses. Each opens in the explained booklet.
With a free account, Augment remembers where you stopped and what you have practiced.
To describe where a body is, a reference point called the origin is chosen, together with a positive direction. The position of the body is then its distance from the origin, with a sign or a direction attached. A train 3 km east of a station has position +3 km if east is taken as positive, and a train 3 km west has position −3 km.
Quantities in kinematics come in two kinds. A scalar has a size (magnitude) only: distance, speed, time and mass are scalars. A vector has a magnitude and a direction: displacement, velocity and acceleration are vectors. In motion along a straight line, the direction is given by a sign, positive or negative, so the choice of positive direction must be stated and then used consistently. In two dimensions a vector is drawn as an arrow, and two vectors add by placing them tip to tail.
Because displacement depends only on the start and end points, the route in between does not affect it. Distance, by contrast, is the total length of the path, and it can only increase as the body moves. Distance is a scalar: it has a size but no direction.
The track diagram shows the two quantities separating as soon as a path curves. After one complete 400 m lap the runner is back on the start line, so the displacement is zero while the distance is 400 m. The two are equal only for motion in a straight line in one direction.
Speed is the rate at which distance is covered, and velocity is the rate of change of displacement. Over a time interval , the average velocity is
and it points in the direction of the displacement. Average speed uses the distance instead, so it is always positive. Both are measured in . Speed is the magnitude of velocity at any instant, but average speed and the magnitude of average velocity are equal only when the path is a straight line with no change of direction.
Quantity | Symbol and unit | Scalar or vector | Found from |
|---|---|---|---|
Distance | , m | Scalar | Length of the path |
Displacement | , m | Vector | Final position − initial position |
Speed | Scalar | Distance ÷ time | |
Velocity | (or initially), | Vector | Displacement ÷ time |
Acceleration | , | Vector | Change in velocity ÷ time |
When a journey has parts in different directions, the displacement is found by adding the parts as vectors. For two perpendicular parts this is Pythagoras' theorem, and the direction comes from trigonometry.
A body rarely moves at a steady rate, so its velocity at one moment, the instantaneous velocity, can differ from the average over a longer interval. A car speedometer shows an instantaneous speed; a journey of 120 km in 2.0 hours gives an average speed of , even if the car stopped at traffic lights and sometimes travelled at .
On a displacement–time graph the average velocity between two times is the gradient of the straight line (the chord) joining the two points. The instantaneous velocity at a single time is the gradient of the tangent to the curve at that time. As the time interval used for a chord is made shorter, the chord approaches the tangent, so the average velocity over a very short interval is the instantaneous velocity.
Whenever a velocity changes, the body is accelerating. Because velocity is a vector, this includes speeding up, slowing down and changing direction at constant speed. The average acceleration over a time interval is the change in velocity divided by the time taken:
where is the initial velocity and the final velocity. The unit is metres per second per second, : an acceleration of means the velocity changes by every second. As with velocity, the instantaneous acceleration is the gradient of the tangent to a velocity–time graph, and the average acceleration is the gradient of a chord.
The sign of an acceleration says which way it points, not whether the body is speeding up. A body speeds up when its velocity and acceleration have the same sign and slows down when they have opposite signs. A ball thrown upwards (up positive) has a positive velocity and a negative acceleration on the way up, so it slows; on the way down both are negative, so it speeds up. "Deceleration" is an everyday word for slowing down; in calculations it is clearer to keep a single sign convention and let the sign of do the work.
Graphs show a whole motion at once and make it easy to see when a body speeds up, slows down or changes direction. Three graphs are used, each against time: displacement, velocity and acceleration. Each is linked to the next by its gradient, and each is linked to the one before by the area under it.
Graph | Gradient gives | Area under the graph gives |
|---|---|---|
Displacement–time (–) | Velocity | (not used) |
Velocity–time (–) | Acceleration | Displacement |
Acceleration–time (–) | (not used) | Change in velocity |
The gradient of a displacement–time graph at any time is the velocity at that time. A horizontal line means the body is at rest. A straight sloping line means a constant velocity, and the steeper the line, the faster the motion. A line sloping downwards has a negative gradient: the body is moving in the negative direction, back towards (and possibly past) the origin.

A curve means the velocity is changing. If the curve gets steeper with time the body is speeding up; if it flattens, the body is slowing down. Where the curve has a maximum or minimum, the tangent is horizontal, so the velocity is momentarily zero: this is where a ball thrown upwards reaches its highest point, or where a car reverses direction.
The gradient of a velocity–time graph is the acceleration. A horizontal line means constant velocity (zero acceleration); a straight sloping line means uniform acceleration; a curve means the acceleration is changing. The line crosses the time axis wherever the body stops and reverses.
The area between the line and the time axis is the displacement. This follows from : over a short time, the displacement is a thin strip of height and width , and adding all the strips gives the total area. Area above the time axis counts as positive displacement and area below it as negative displacement. The distance travelled is the total area counted as positive.

An acceleration–time graph shows how the acceleration varies. The area between the line and the time axis is the change in velocity, , added up over the motion. For uniform acceleration the graph is a horizontal line. An acceleration–time graph says nothing about the starting velocity, so to find the actual velocity at a later time the initial velocity must be known and the area added to it.
A ball thrown straight up and caught at the same height is a standard case for linking the three graphs. Taking upwards as positive, the displacement rises to a maximum and falls back, the velocity decreases steadily from a positive value to the same negative value, and the acceleration is constant and negative throughout.

The three graphs agree with each other. At the top of the flight the displacement–time curve is flat, so its gradient, the velocity, is zero: that is where the velocity line crosses the axis. The velocity line has a constant gradient of −9.8 m s⁻², which is the horizontal acceleration line. The areas under the velocity line above and below the axis are equal, so the total displacement when the ball is caught is zero.
When the acceleration changes, the velocity–time graph is curved and the equations of motion cannot be used. The graph still gives everything. The acceleration at a moment is the gradient of the tangent at that moment, and the displacement is the area under the curve, found by counting grid squares (including squares that are more than half under the curve and leaving out the rest) and multiplying by the displacement that one square represents.
A bouncing ball combines both kinds of motion. Between bounces it is in free flight with uniform acceleration, so its velocity–time graph is a set of parallel straight lines. During each bounce, which lasts only a few milliseconds, the velocity changes very quickly from downward to upward: the graph is almost vertical there, showing a very large acceleration.

Each rebound speed is smaller than the impact speed before it, because some kinetic energy is transferred to internal energy and sound in the bounce. So each triangle on the graph is smaller than the last, and the ball rises less high each time. A stroboscopic photograph, taken with a flash at equal time intervals, shows the same motion as positions in space.
The other two graphs of the bounce follow from the velocity–time graph. The height–time graph (up positive, floor as origin) is a series of arches, each a parabola, that meet the time axis in sharp points at the bounces, where the gradient changes suddenly from negative to positive; each arch is lower and shorter than the one before. The acceleration–time graph is a horizontal line at during every flight, interrupted at each bounce by a very short, very large positive spike while the floor pushes the ball upwards.

In the 100 m final at the 2009 World Championships in Berlin, Usain Bolt ran 9.58 s, still the world record. Electronic timing recorded the moment he passed every 10 m mark, so his race can be analysed as a problem in kinematics. The split times are measured from the starting gun and include his reaction time, the 0.146 s between the gun and his first push on the blocks.
Distance / m | 10 | 20 | 30 | 40 | 50 | 60 | 70 | 80 | 90 | 100 |
|---|---|---|---|---|---|---|---|---|---|---|
Time / s | 1.89 | 2.88 | 3.78 | 4.64 | 5.47 | 6.29 | 7.10 | 7.92 | 8.75 | 9.58 |
Time for that 10 m / s | 1.89 | 0.99 | 0.90 | 0.86 | 0.83 | 0.82 | 0.81 | 0.82 | 0.83 | 0.83 |
Data: IAAF split times for the 2009 Berlin final, as tabulated by Helene and Yamashita (2010).
His average speed for the whole race was , but his speed changed a great deal during the race. Dividing 10 m by the time for each interval gives his average speed over each 10 m, and plotting these against the middle time of each interval gives an approximate velocity–time graph.

The graph shows non-uniform acceleration. In the first two seconds the gradient is large: Bolt's speed rose from zero to about , an average acceleration of roughly . The gradient then decreased, and between 50 m and 80 m it was close to zero, at a speed of about . His fastest 10 m, from 60 m to 70 m, took 0.81 s, an average of , and he slowed very slightly over the last 20 m. The area under the curve, from the start of his run to 9.58 s, is the 100 m race distance.
When the acceleration is uniform, the velocity–time graph is a straight line and its area is a simple shape. This leads to four equations of motion (often called the "suvat" equations after their five symbols) linking the displacement , initial velocity , final velocity , acceleration and time :
The first equation is the definition of acceleration rearranged. With uniform acceleration , so : the final velocity is the initial velocity plus the change, .
The second comes from the area under the graph. The line goes from to over time , so the area is a trapezium of parallel sides and and width : . In words, for uniform acceleration the average velocity is halfway between the initial and final velocities.

The third equation splits the same area into two shapes: a rectangle of height and width (area ) and a triangle on top with height and base (area ). Adding them gives .
The fourth equation removes . From the first equation ; substituting this into gives
Acceleration is the rate of change of velocity, . If is constant, integrating once gives , and since , integrating again gives . The area under a velocity–time graph is the integral of with respect to time, which is why areas give displacements. The same reasoning shows that for a non-uniform acceleration the equations fail: cannot be taken outside the integral.
Each equation leaves out one of the five quantities, so a problem is solved by listing the three quantities that are known and the one that is wanted, and choosing the equation that does not contain the fifth.
Equation | Quantity it leaves out |
|---|---|
A body in free fall moves under the influence of gravity alone. Near the Earth's surface, all bodies in free fall have the same downward acceleration, whatever their mass, shape or what they are made of. This is the acceleration of free fall, , and its value near the surface is . In everyday life a feather falls more slowly than a hammer because fluid resistance has a much larger effect on the feather, not because it is lighter. On the Moon, where there is no atmosphere, the two fall together.
 YouTube
At the end of the last Apollo 15 moonwalk in August 1971, the astronaut David Scott dropped a geological hammer and a falcon feather together. They hit the lunar surface at the same moment, falling with the Moon's free-fall acceleration of about . The demonstration tested a prediction made by Galileo, that in the absence of fluid resistance all bodies fall with the same acceleration. The experiment was a genuine test: a different result would have falsified the prediction.
Free fall is uniformly accelerated motion, so the equations of motion apply with . The sign depends on the direction chosen as positive: with up positive, whether the body is rising or falling. The motion is symmetrical: a body thrown up at speed returns to its launch height with the same speed downwards, and takes as long to rise as to fall back.
When a body is thrown upwards from a height, the whole flight can be treated in one step, because the acceleration is the same on the way up and on the way down. The final displacement is then negative (below the launch point), and the quadratic equation for the time has one positive solution.
A common method uses a small steel ball held by an electromagnet above a trapdoor or a light gate. Switching off the magnet releases the ball and starts an electronic timer; the ball stops the timer when it reaches the trapdoor. Measuring the time for several drop heights and using (with ) shows that a graph of against should be a straight line through the origin with gradient .
Plotting a straight-line graph uses all the data at once and shows up systematic errors. A delay in the magnet releasing the ball adds the same small time to every reading, which shifts the points and lowers the gradient, so the value of g is too small and the line does not pass through the origin. Repeating readings reduces random error but cannot remove a systematic error of this kind.
Many real journeys consist of stages with different accelerations: a train accelerating, cruising and braking, or a rocket whose engine burns for a few seconds and then cuts out. The equations of motion apply within each stage, where the acceleration is uniform, but not across the whole journey. The link between stages is the velocity: the final velocity of one stage is the initial velocity of the next. A velocity–time graph is the clearest way to plan such a problem.
A driver who sees a hazard does not brake instantly. The reaction time is the time between seeing the hazard and starting to press the brake pedal, typically about 0.7 s for an alert driver and much longer for a driver who is tired, distracted (for example by a phone) or affected by alcohol or drugs. During the reaction time the car keeps moving at its original speed.
The stopping distance of a vehicle therefore has two parts:
the thinking distance, travelled at constant speed during the reaction time: ;
the braking distance, travelled while the car decelerates to rest: from with , .

The two parts depend on speed in different ways. Thinking distance is proportional to speed, so doubling the speed doubles it. Braking distance is proportional to the square of the speed, so doubling the speed makes it four times as large. At high speeds the braking distance is by far the larger part.
Speed / mph | Speed / m s⁻¹ | Thinking distance / m | Braking distance / m | Stopping distance / m |
|---|---|---|---|---|
20 | 8.9 | 6 | 6 | 12 |
30 | 13.4 | 9 | 14 | 23 |
40 | 17.9 | 12 | 24 | 36 |
50 | 22.4 | 15 | 38 | 53 |
60 | 26.8 | 18 | 55 | 73 |
70 | 31.3 | 21 | 75 | 96 |
Data: typical stopping distances for a car, UK Highway Code (Rule 126; wet and icy roads, Rules 227 and 230). The thinking distances correspond to a reaction time of about 0.67 s and the braking distances to a deceleration of about 6.5 m s⁻².
The braking deceleration depends on the road surface, the tyres and the brakes. On a wet or icy road the maximum deceleration is much smaller, so the braking distance is much longer. Stopping distances are at least double on wet roads and can be ten times greater on ice. The mass of the vehicle affects the deceleration that a given braking force produces, which is a question about forces (A.2).
Reaction time can be measured with a ruler. One person holds a metre ruler vertically with its zero mark between the open fingers of a second person, then lets go without warning. The second person catches it as quickly as possible, and the distance the ruler falls before being caught is read from the scale. Because the ruler is in free fall from rest, , so the reaction time is .
A projectile is a body that has been launched and then moves under gravity alone, such as a ball after it is kicked, a stone after it is thrown or a parcel dropped from an aircraft. Its path, or trajectory, is curved. When fluid resistance is negligible, the trajectory is a parabola.
The key to projectile problems is that the horizontal and vertical motions are independent of each other. Gravity acts only vertically, so with no fluid resistance there is no horizontal force and no horizontal acceleration: the horizontal velocity stays constant. Vertically, the projectile accelerates downwards at , exactly as if it had been dropped. The two motions share only the time.

The diagram of the two released balls shows this directly. A ball launched horizontally and a ball dropped from rest at the same moment hit a level floor at the same time. At every instant they are at the same height, because their vertical motions are identical; the launched ball also moves sideways by equal distances in equal times. The stroboscopic photograph of a bouncing ball shows the same pattern.
To solve a projectile problem, the initial velocity is resolved into a horizontal component and a vertical component. For a launch at speed at angle above the horizontal:
The horizontal motion uses (constant velocity). The vertical motion uses the equations of motion with (taking up as positive). The time is usually found from the vertical motion and then used in the horizontal motion.
Horizontal | Vertical (up positive) | |
|---|---|---|
Initial velocity | ||
Acceleration | 0 | |
Velocity at time t | (constant) | |
Displacement at time t |
For a horizontal launch, , so the initial vertical velocity is zero. The time of flight depends only on the height of the launch point: a ball rolled faster off the same table takes the same time to reach the floor, but lands further away.
When a projectile is launched upwards at an angle, its vertical velocity decreases by every second, becomes zero at the highest point and then increases downwards. The horizontal velocity does not change at any point. At the top the velocity is not zero: it is horizontal and equal to .

On level ground, with the launch and landing at the same height, the motion is symmetrical about the highest point. Three quantities are usually asked for.
Maximum height : from the vertical motion with at the top, , so .
Time of flight : the time of flight is the time for the vertical displacement to return to zero,
Range : the range is the horizontal displacement during the flight, .
These results are worked out from the components each time rather than memorised, because they hold only when the projectile lands at its launch height.
For a given launch speed on level ground, the range depends on the angle. Combining the results gives , which is largest when , so a launch at gives the greatest range. Angles that add up to , such as and , give the same range: the steeper launch spends longer in the air but moves forward more slowly.
 YouTube
When the launch and landing points are at different heights, the symmetry is lost and the shortcuts for and no longer apply. The method is unchanged: write the vertical displacement at landing with its sign (negative if the landing point is below the launch point), solve the quadratic equation for the time, and use that time in the horizontal motion. A launch below the horizontal simply has a negative initial vertical component, with up positive.
A launch below the horizontal, such as a stone thrown down from a bridge or a ball smashed downwards in tennis, gives the body a downward vertical velocity from the start, so it reaches the ground sooner and faster than a horizontal launch at the same speed.
The energy check in the bridge example is a useful link to A.3. Without fluid resistance, the speed of a projectile at a given height depends only on its launch speed and the height fallen, , whatever the launch angle. The direction of the velocity still needs the components.
Real projectiles move through air or water. The force a fluid exerts on a body moving through it, opposing its motion relative to the fluid, is called fluid resistance; air resistance is the everyday example of it. Fluid resistance increases with the speed of the body, and is larger for a body with a larger cross-sectional area, a less streamlined shape or a denser fluid. Because it depends on speed, the acceleration of a body moving through a fluid is not constant, and the equations of motion no longer apply.
Fluid resistance acts opposite to the velocity, so it has a horizontal component that slows the forward motion and a vertical component that opposes the vertical motion. Compared with the same launch in a vacuum:
the horizontal velocity decreases throughout the flight instead of staying constant;
the acceleration is no longer g: on the way up the body slows faster than g, because gravity and fluid resistance both act downwards; on the way down it speeds up more slowly than g, because fluid resistance now acts upwards;
the maximum height and the range are both smaller;
the trajectory is not a parabola and is not symmetrical: the highest point is reached sooner and nearer the landing point, and the descent is steeper than the climb;
the time to fall from the top is longer than the time to rise to it, and the landing speed is smaller than the launch speed;
the time of flight on level ground is shorter, because the body rises for less time to a lower maximum height, and its slower descent does not make up the difference.

Whether fluid resistance matters depends on the body. For a steel ball moving at a few metres per second it is very small, and the vacuum model fits measurements well. For a shuttlecock, a table-tennis ball or a golf ball driven at high speed it dominates the motion. Choosing when an effect can be neglected is part of modelling: the parabolic trajectory is a model, accurate only when the resistive force is small compared with the weight.
A body falling from rest through a fluid has two main forces acting on it: its weight, which is constant, and fluid resistance, which grows as the body speeds up (for bodies in a liquid, buoyancy also acts upwards, a force covered in A.2). At the moment of release the speed is zero, so there is no fluid resistance and the acceleration is . As the speed increases, fluid resistance increases, the resultant downward force decreases and the acceleration decreases. Eventually fluid resistance becomes equal to the weight, the resultant force is zero, and the body falls at a constant speed called its terminal speed.

The velocity–time graph of a falling body therefore starts with a gradient equal to g and curves over until it is horizontal at the terminal speed. A skydiver in a spread position reaches a terminal speed of roughly 55 m s⁻¹ (about 200 km h⁻¹). Opening a parachute greatly increases the area facing the air, so fluid resistance suddenly becomes much larger than the weight. The resultant force is now upwards, the skydiver decelerates, and fluid resistance falls as the speed falls until the forces balance again at a much lower terminal speed of about 5 m s⁻¹, slow enough to land safely.

The acceleration–time graph of the same fall (downwards positive) starts at and falls to zero as terminal speed is reached. When the parachute opens the acceleration becomes large and negative, because the resultant force is upwards, and it then returns to zero at the lower terminal speed. In each stage the area under the acceleration–time graph equals the change in velocity shown on the velocity–time graph.
Terminal speed also depends on the density of the fluid. In the Red Bull Stratos jump of October 2012, Felix Baumgartner stepped off a capsule at 38 969 m. The air there is so thin that fluid resistance stayed small even at high speed, and he reached a maximum speed of (), faster than the speed of sound. As he fell into denser air, fluid resistance at that speed became larger than his weight, and he slowed down long before opening his parachute.
A group of students drop a steel ball from an electromagnet. An electronic timer starts when the magnet is switched off and stops when the ball opens a trapdoor a height h below. The table shows the mean time t for five heights; the timer reads to ±0.001 s and repeated readings varied by ±0.002 s.
h / m (± 0.005) | 0.200 | 0.400 | 0.600 | 0.800 | 1.000 |
|---|---|---|---|---|---|
t / s (± 0.002) | 0.214 | 0.298 | 0.362 | 0.416 | 0.464 |

I can distinguish between scalars and vectors, and between distance and displacement.
I can calculate average speed and average velocity, including for journeys in two perpendicular directions.
I can find average velocity from a chord and instantaneous velocity from a tangent of a displacement–time graph.
I can define acceleration and use the signs of velocity and acceleration to decide whether a body is speeding up or slowing down.
I can find velocity and acceleration from the gradients of displacement–time and velocity–time graphs.
I can find displacement, distance and change in velocity from the areas under velocity–time and acceleration–time graphs, including areas below the time axis.
I can sketch and interpret the displacement–time, velocity–time and acceleration–time graphs of a ball thrown upwards and of a bouncing ball.
I can derive the equations of motion from a velocity–time graph and choose the right one for a problem.
I can solve free-fall problems with a consistent sign convention, including a body thrown upwards from a height.
I can solve problems with several stages, using the final velocity of one stage as the initial velocity of the next.
I can calculate thinking, braking and stopping distances and explain how each depends on speed and reaction time.
I can resolve a launch velocity into components and find the time of flight, maximum height, range and velocity at impact of a projectile.
I can solve projectile problems for launches horizontally, above the horizontal and below the horizontal, from any height.
I can describe the effects of fluid resistance on a projectile and explain how a falling body reaches terminal speed.
Gravity still acts at the highest point, so the acceleration is downwards throughout the flight. Only the velocity is momentarily zero.
The answer is B.
A cyclist of total mass 80 kg rides along a straight, level road. The graph shows how her velocity changes with time .
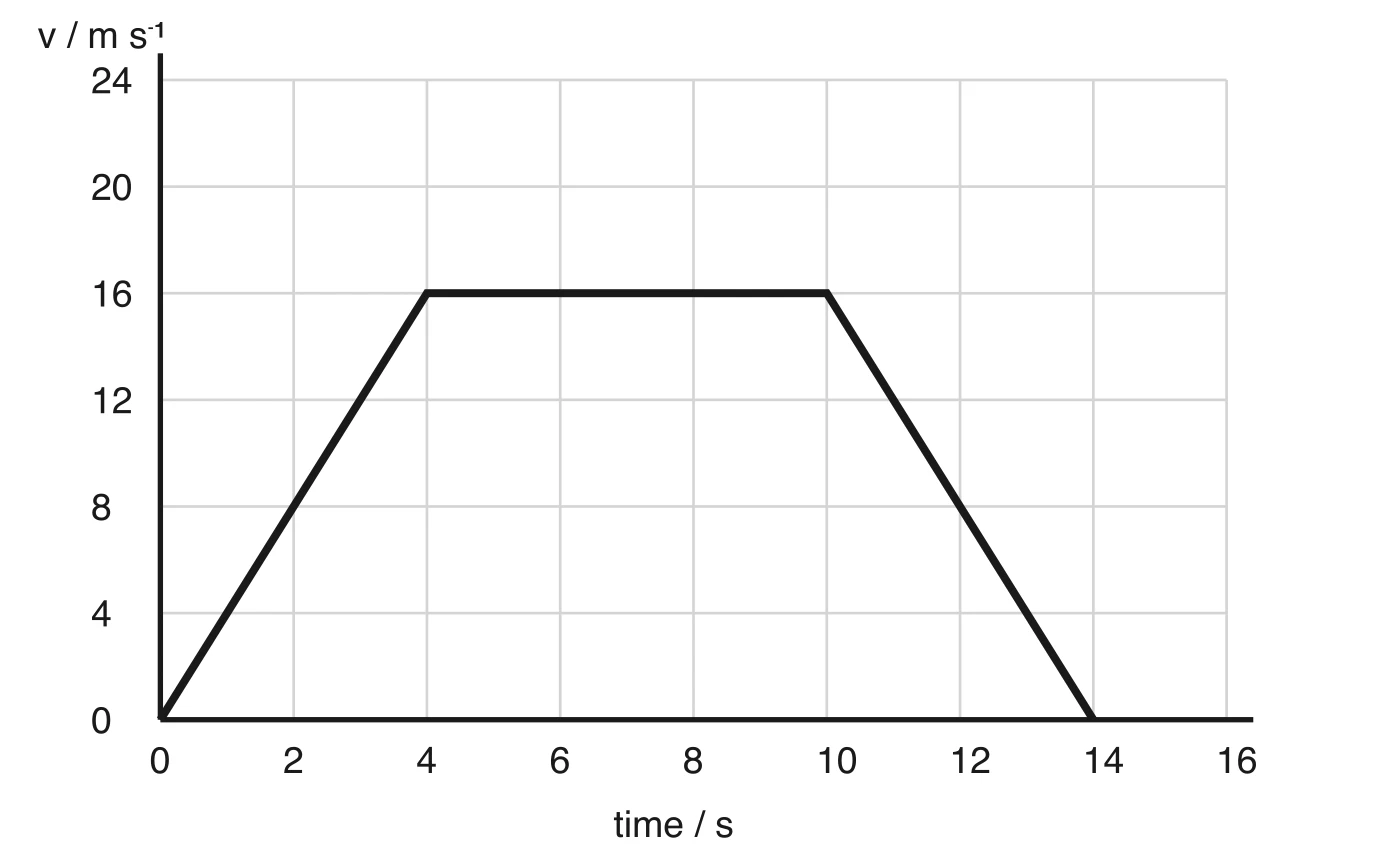
Calculate her acceleration during the first 4.0 s.
2 marks
Determine the total distance travelled.
2 marks
Calculate her maximum kinetic energy.
1 mark
Calculate the average power with which she gains kinetic energy in the first 4.0 s.
2 marks
A delivery robot in a warehouse moves 30 m due east along a straight aisle. It then moves 40 m due west along the same aisle. What are the distance travelled by the robot and its displacement from its starting point?
(b) Thinking distance . Braking distance . Stopping distance .
A 50 % increase in speed doubles the stopping distance. The thinking distance rises by 50 %, but the braking distance rises by a factor of 1.5² = 2.25.
so the graph should be a straight line through the origin with gradient ✓
(b) percentage uncertainty in = ✓
percentage uncertainty in = «≈ 2 %» ✓
(c) gradient from two well-separated points on the line, e.g. «m s⁻²» ✓
✓
Accept 9.3–9.6 m s⁻². Allow ECF from an incorrect gradient.
(d) the ball is released a short time after the timer starts / delay in the magnet releasing the ball (or residual magnetism) ✓
so every measured time is too long, which makes t² too large: the gradient «and g» is too small and the line cuts the h axis below zero ✓
Do not accept "human reaction time": the timing is electronic.
stopping distance «m», which is less than 60 m, so the car stops «2.4 m» before the tree ✓
Allow ECF from (a). The final mark needs a comparison with 60 m.
(c) distance available for braking «m» ✓
, so «m s⁻¹» ✓
(d) horizontal line at from 0 to 0.80 s ✓
straight line falling from at 0.80 s to zero at 4.0 s «0.80 + 3.2 s» ✓