E.5 Fusion and stars · IB Physics | Augment Education
E.5 Fusion and stars
How fusion powers the stars and keeps them stable, how stars are measured and placed on the Hertzsprung–Russell diagram, and how a star’s mass decides its life and death.
IB Physics
Part of E Nuclear and quantum physics
SL and HL
Key terms introduced here
Each is in the Physics glossary, with every other term in the subject.
A region of space where matter has collapsed so far that its gravity prevents anything, even light, from escaping; formed from the cores of the most massive stars.
A graph of stellar luminosity (vertical, log scale) against surface temperature (horizontal, log scale, decreasing to the right), on which stars fall into groups such as the main sequence, giants and white dwarfs.
A narrow, nearly vertical band of the HR diagram, at surface temperatures of roughly 5000–8000 K, in which evolved stars pulsate, regularly changing in size and luminosity.
The distance light travels in a vacuum in one year, 9.46×10¹⁵m
Notes on E.5 Fusion and stars
37 min readLast reviewed
A star is a huge ball of hot gas, held together by its own gravity and powered by nuclear fusion in its core. The Sun turns about four million tonnes of mass into energy every second, and has done so for 4.6 billion years. Almost every element heavier than helium, including the carbon and oxygen in living things and the iron in blood, was made by fusion inside stars or in their violent deaths.
Stars are too far away to visit, so everything known about them comes from the light they send. Measuring how bright a star looks, how its brightness changes as Earth orbits the Sun, and how its light is spread across wavelengths is enough to find its distance, power output, temperature and size.
Questions on E.5
74 exam-style questions on this subtopic, written in the style of the IB papers. The first has its markscheme open. Counted on
Question 1 · PHY-002591 mark
A red giant star has a luminosity of 100L⊙ and a surface temperature half that of the Sun. L⊙ is the luminosity of the Sun and R⊙
Try a quick-fire question
One of 60 short multiple-choice questions on E.5. Pick an answer to see why it's right or wrong.
The graph shows how the binding energy per nucleon varies with nucleon number A. Fusion of nuclei from which part of the graph releases energy?
Flashcards for E.5
The official deck for this part of the syllabus.
E.5 Fusion and stars · front
Define nuclear fusion.
E.5 Fusion and stars · front
Nuclear fusion joins two […] nuclei to form a heavier nucleus. It releases energy when the product has a higher binding energy per nucleon than the reactants.
E.5 Fusion and stars218 cards
From the data booklet
The entries of the physics data booklet that E.5 uses. Each opens in the explained booklet.
The band on the HR diagram, from hot luminous stars to cool dim ones, of stars fusing hydrogen into helium in their cores; stars spend most of their lives on it.
The extremely dense remnant core of a massive star after a supernova, about 20 km across, made mostly of neutrons and supported by the pressure of the closely packed neutrons.
A large, luminous star with a cool surface, formed when a low-mass star has used up the hydrogen in its core; its main energy source is helium fusion in the core.
The hot, dense, Earth-sized remnant core of a low-mass star, in which no fusion takes place; it is supported by the pressure of closely packed electrons and slowly cools.
Fusion: the energy source of stars
The curve of binding energy per nucleon rises steeply from hydrogen to a peak near iron-56. On the steep left-hand side, joining small nuclei into larger ones increases the binding energy per nucleon, so the product has less mass than the reactants and the difference Δm is released as energy E=Δmc2. This rise is much steeper than the slow fall on the right that powers fission, so fusion releases far more energy per kilogram of fuel.
One fusion reaction studied for future power stations joins two isotopes of hydrogen, deuterium and tritium:
12H+13H→24He+01n
Hydrogen fusion in the Sun
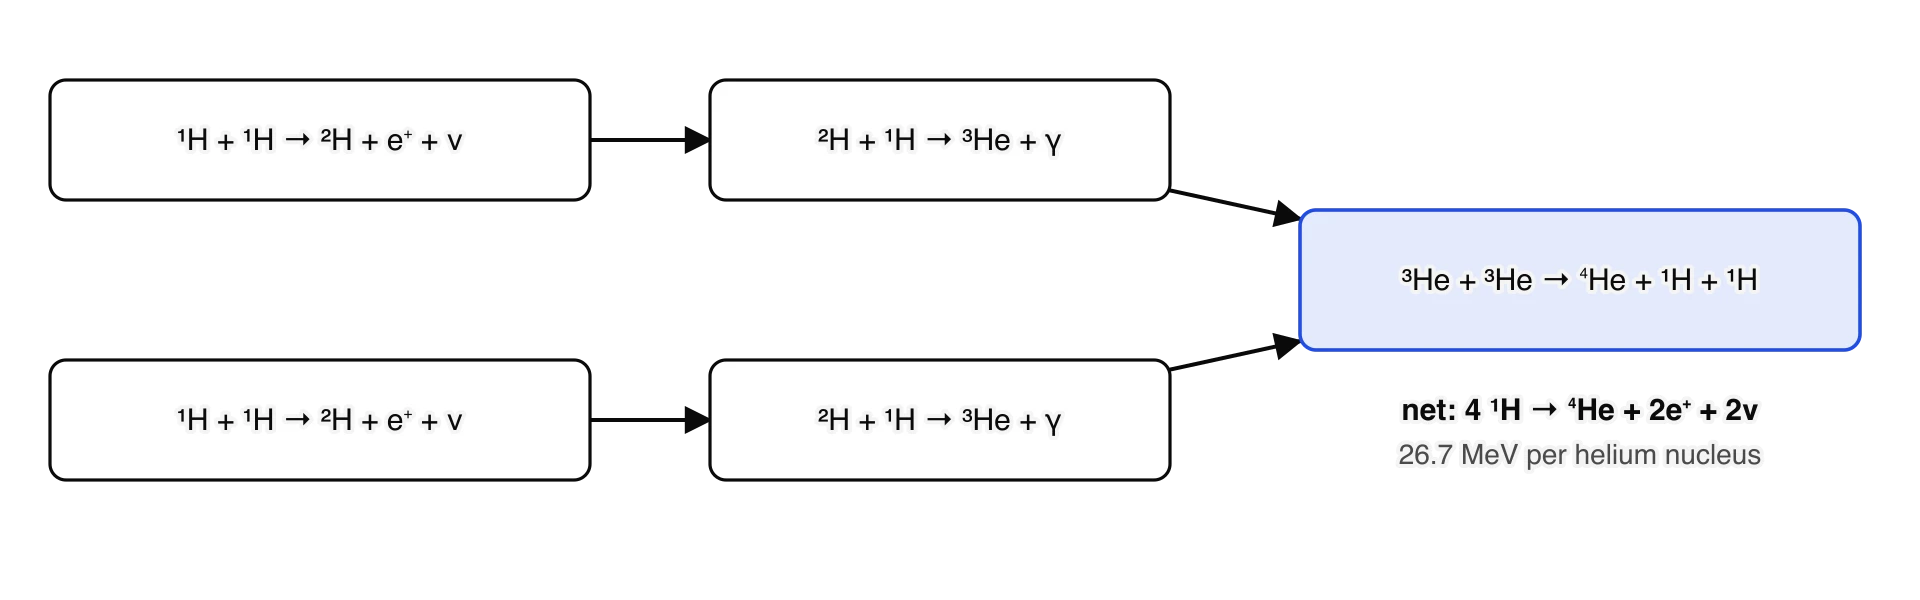
In the core of the Sun, hydrogen nuclei (protons) are fused into helium-4. Four protons cannot collide all at once, so the change happens in steps, each joining just two particles. The main sequence of steps in the Sun is called the proton–proton chain.
The main sequence of reactions that fuses hydrogen into helium in the Sun. Each step joins only two particles. The first step happens twice for every helium-4 nucleus made.
Two of the protons become neutrons along the way, each emitting a positron and a neutrino. The positrons annihilate with electrons in the core, adding their energy, and the neutrinos stream straight out of the Sun. The net change is
411H→24He+2+10e+2νe
The Sun’s energy output tells how fast this happens. Its luminosity, L⊙=3.83×1026W, means that every second it loses a mass
ΔtΔm=c2L⊙=(3.00×10⁸)23.83×1026=4.3×10⁹kg s−1
Since only 0.71% of the hydrogen’s mass is converted, the Sun must fuse about 4.3×10⁹/0.0071≈6×1011 kg of hydrogen each second, roughly 600 million tonnes. The Sun is so massive, about 2×1030 kg, that it can keep this up for about ten billion years on the main sequence.
The conditions for fusion
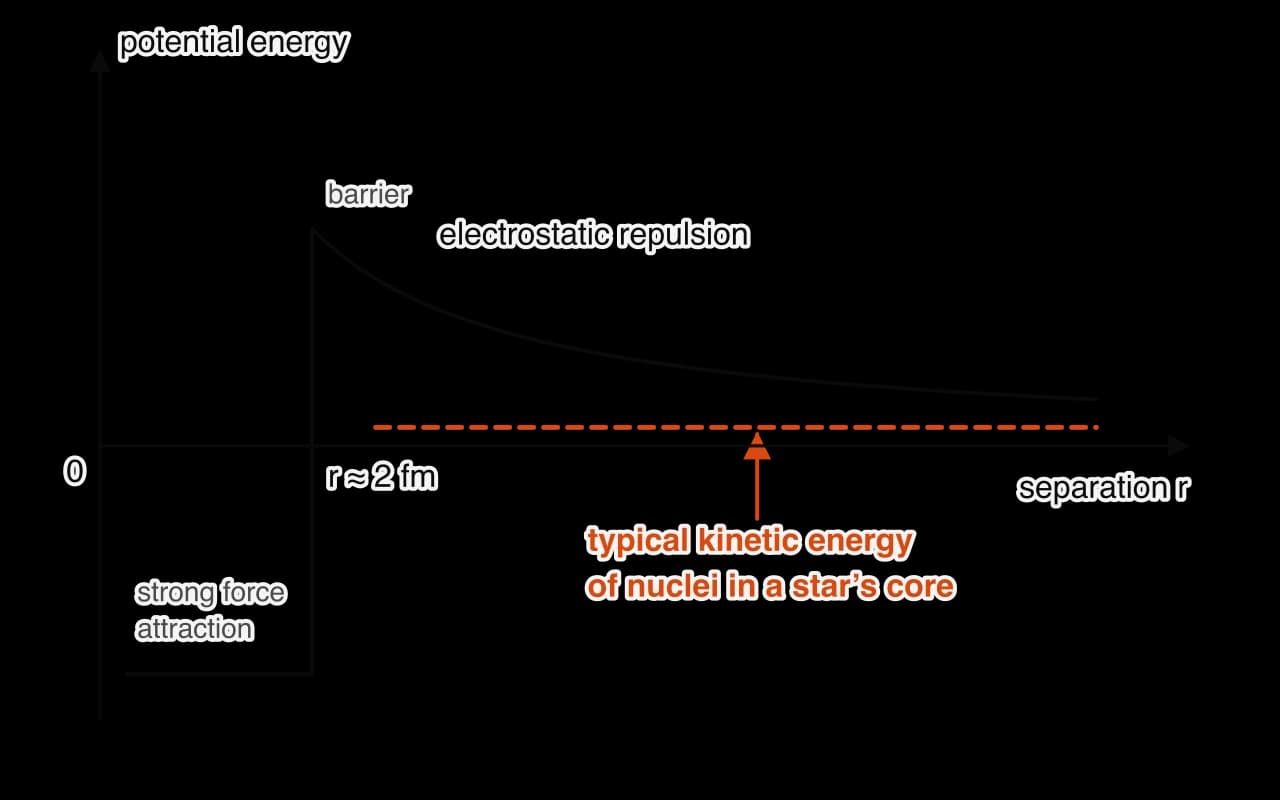
All nuclei are positively charged, so two nuclei repel each other through the electrostatic force. The repulsion grows as they get closer, in proportion to 1/r2. Only when they are within a few times 10−15 m of each other does the attractive strong nuclear force, which has a very short range, take over and bind them together. The repulsion they must overcome first is called the Coulomb barrier.
Two nuclei must approach to within about 2 fm, where the strong force takes over, before they can fuse. The electrostatic barrier is far higher than the typical kinetic energy of nuclei even in a star’s core (not to scale; the real gap is a factor of several hundred).
High temperature
To get close enough, nuclei must collide at very high speeds. The average kinetic energy of particles in a gas is proportional to its absolute temperature, Eˉk=23kBT, so fusion needs an extremely hot gas. At these temperatures the atoms are completely ionised: the gas is a plasma of bare nuclei and free electrons.
High density
Even at a high temperature, only a tiny fraction of collisions lead to fusion. A high density makes collisions frequent enough for fusion to release energy faster than it escapes. In the Sun’s core the density is about 1.5×10⁵kg m−3, more than ten times that of lead, and the temperature is about 15 million K.
In a star, gravity provides both conditions. As a cloud of gas contracts under its own gravity, gravitational potential energy is transferred into kinetic energy of its particles, so the centre becomes hotter and denser until fusion begins. On Earth no such gravity is available, so experiments must heat a plasma to over 100 million K and hold it with magnetic fields or squeeze it with lasers. In December 2022 the National Ignition Facility in the United States released 3.15 MJ of fusion energy from a fuel pellet heated by 2.05 MJ of laser light, the first time a fusion experiment released more energy than the laser light delivered to it.
The stability of stars
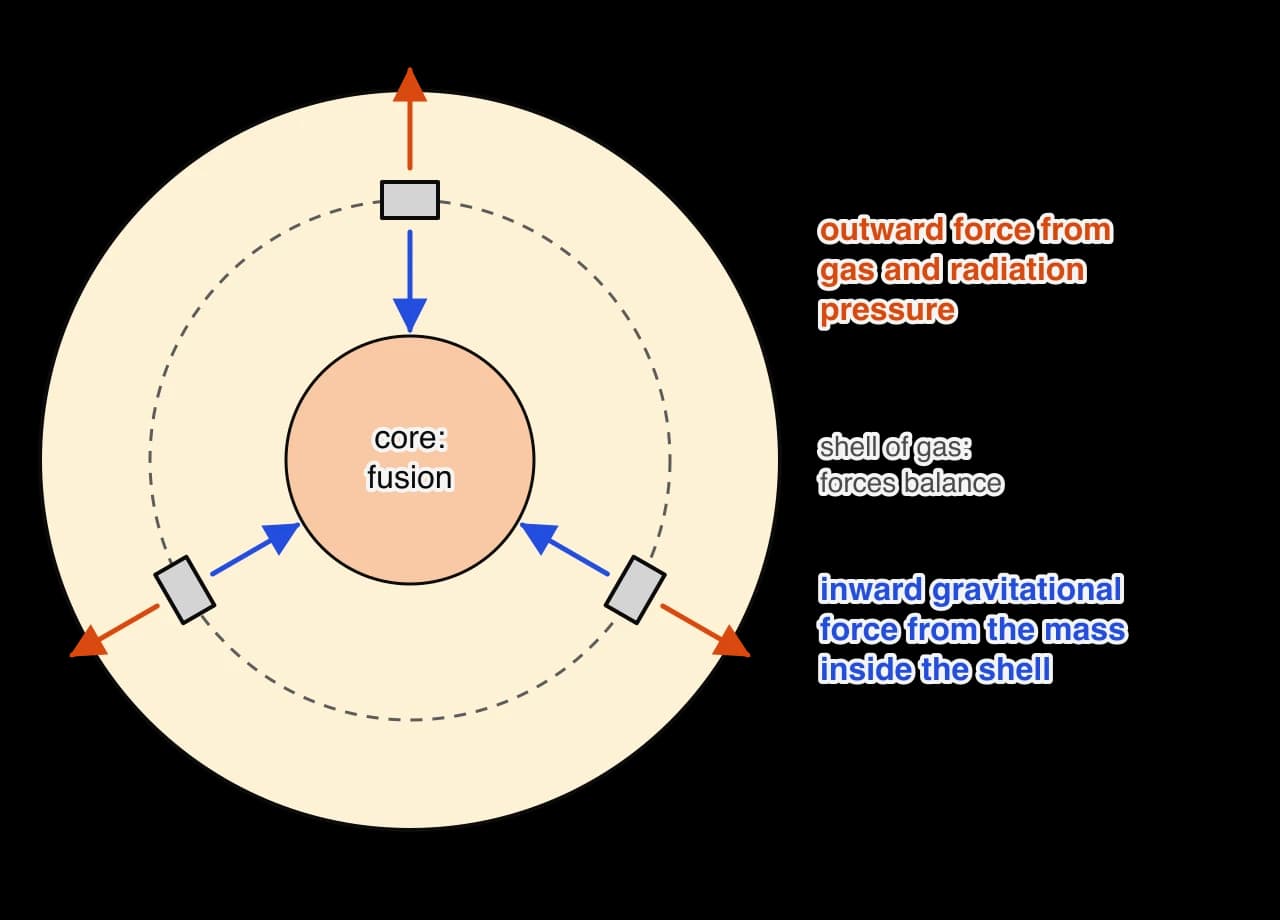
A star is held together by gravity. Every part of the star is attracted towards its centre by the mass inside it, so on its own gravity would make the star collapse. Collapse is resisted by pressure. The hot gas exerts a thermal pressure, and the intense radiation streaming out from the core exerts a radiation pressure, because photons carry momentum and push on the matter that absorbs them.
In a stable star, every layer is in equilibrium: the outward force from gas and radiation pressure (orange) balances the inward gravitational force (blue). The arrows are equal in length because the forces are equal in size.
In a main-sequence star this balance is very stable, because it corrects itself. Fusion in the core supplies the energy that keeps the gas hot and the pressure high.
If the core contracts slightly, it becomes hotter and denser. The fusion rate rises steeply, the pressure increases, and the core expands back.
If the core expands slightly, it cools and becomes less dense. The fusion rate falls, the pressure drops, and gravity pulls the core back in.
This negative feedback keeps a main-sequence star at almost constant size and luminosity for most of its life. When the Sun formed 4.6 billion years ago it was about 70% as luminous as it is today, a very slow change. The equilibrium ends only when the fuel in the core runs out, and the changes that follow make up the rest of a star’s life.
Luminosity, apparent brightness and spectra
Two quantities describe how much light a star gives out and how much reaches Earth. A star’s luminosityL is the total power it radiates, in watts. Treating the star as a black body of radius R and surface temperature T, the Stefan–Boltzmann law gives
L=σAT4=σ4πR2T4
where σ=5.67×10⁻⁸W m−2K−4 and A=4πR2 is the star’s surface area. Stellar luminosities are often given as multiples of the Sun’s, L⊙=3.83×1026 W.
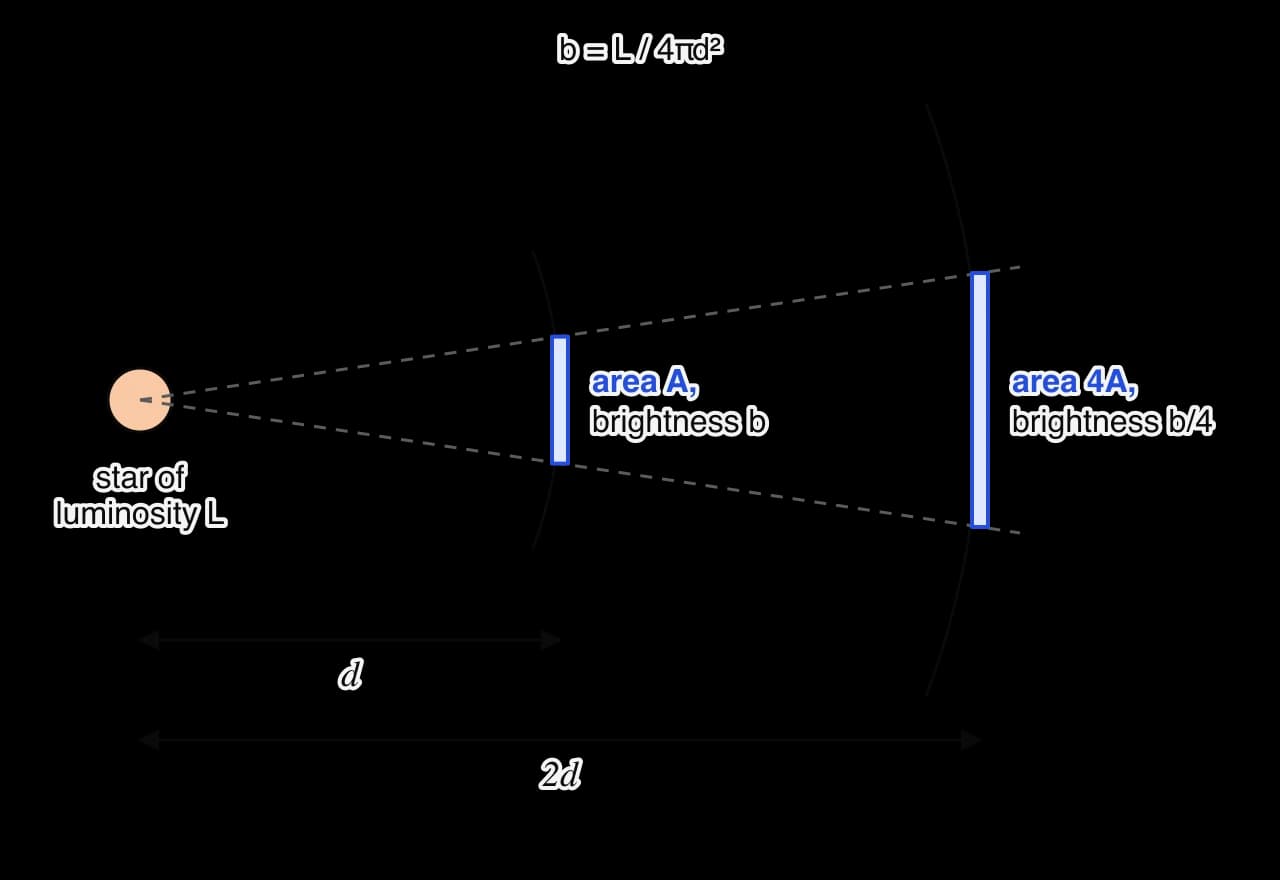
The radiation leaving a star spreads out equally in all directions. At a distance d the power L is spread over the surface of a sphere of area 4πd2, so
b=4πd2L
The same power spreads over an area four times as large when the distance doubles, so the apparent brightness falls to a quarter: b ∝ 1/d².
This is an inverse-square law: doubling the distance spreads the same power over four times the area, so the apparent brightness falls to a quarter. A star can look bright because it is very luminous or because it is close. Sirius, the brightest star in the night sky, is only 8.6 light-years away and 25 times as luminous as the Sun; Rigel, also one of the brightest stars in the sky, is about 120 000 times as luminous but about 100 times further away.
Rearranged for d, the same relation gives the distance to a star whose luminosity is known.
Temperature and composition from the spectrum
The light from a star covers a range of wavelengths, close to a black-body spectrum. The wavelength at which the intensity is greatest, λmax, is inversely proportional to the surface temperature, as Wien’s displacement law states:
λmaxT=2.9×10⁻³m K
Sirius A, 9940 K
Sun, 5772 K
Betelgeuse, 3600 K
Black-body spectra of three stars, each scaled to the same peak height. The hotter the star, the shorter its peak wavelength: λmax = 2.9 × 10⁻³ m K / T. The dashed lines mark the visible range.
Hot stars peak at short wavelengths and look blue-white; cool stars peak in the infrared and look orange or red. Measuring where a star’s spectrum peaks therefore gives its surface temperature, whatever its distance.
A star’s spectrum is also crossed by dark absorption lines. Atoms in the cooler outer layers of the star absorb photons whose energies match the differences between their energy levels. Each element absorbs its own pattern of wavelengths, so the lines identify which elements are present in the star’s atmosphere. In this way the Sun was found to be about 74% hydrogen and 24% helium by mass, and helium itself was first identified in the solar spectrum before it was found on Earth.
Stellar distances: parallax and the parsec
Distances to stars are so large that the metre is an inconvenient unit. Astronomers use three larger units.
Unit
Definition
Value
Astronomical unit (AU)
The mean distance between Earth and the Sun
1AU=1.50×10¹¹m
Light-year (ly)
The distance travelled by light in a vacuum in one year
1ly=9.46×10¹⁵m
Parsec (pc)
The distance at which 1 AU subtends an angle of 1 arc-second
1pc=3.26ly=3.09×10¹⁶m
The astronomical unit suits distances within the Solar System, and the light-year and parsec suit distances between stars. The nearest star after the Sun, Proxima Centauri, is 4.2 ly or 1.3 pc away.
Stellar parallax
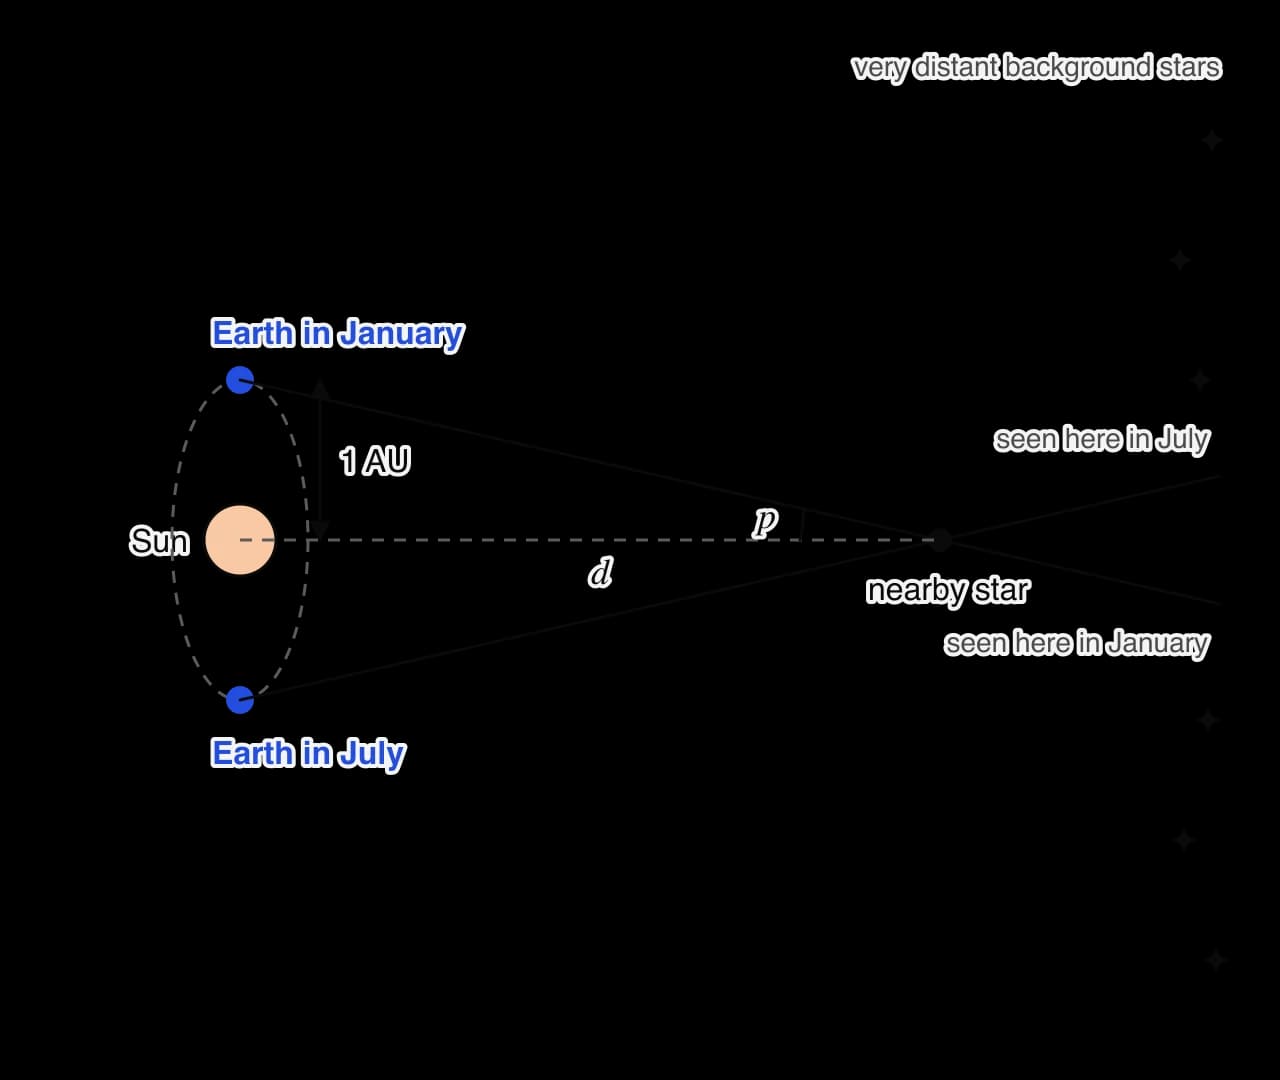
A finger held at arm’s length seems to jump against the background when it is viewed with each eye in turn. The same effect, seen from opposite sides of Earth’s orbit, makes a nearby star seem to shift against much more distant stars. This apparent shift is stellar parallax.
Seen from opposite sides of Earth’s orbit, a nearby star appears to shift against the distant background. The parallax angle p is half the total shift, the angle subtended at the star by 1 AU (not to scale: real angles are under 1 arc-second).
Earth moves from one side of its orbit to the other in six months, a baseline of 2 AU. The parallax anglep is half the total angular shift: the angle subtended at the star by a distance of 1 AU. The closer the star, the larger the parallax angle. Parallax angles are tiny, so they are measured in arc-seconds: one degree is divided into 60 arc-minutes and each arc-minute into 60 arc-seconds.
For such small angles, tanp≈p in radians, so the distance is inversely proportional to the parallax angle. With d in parsecs and p in arc-seconds the relation becomes simply
d(parsec)=p(arc-second)1
Where the value of the parsec comes from
One arc-second is 36001 of a degree, or 36001×180π=4.85×10⁻⁶ rad. For a small angle, the distance at which 1 AU subtends this angle is
d=p1AU=4.85×10−61.50×1011=3.09×10¹⁶m
which is 3.09×10¹⁶/9.46×1015≈3.27 ly (3.26 ly with more precise values of the AU and the light-year), or about 206 000 AU.
The limits of parallax
Parallax measures distance directly, using only geometry, which makes it the foundation of all other methods of measuring astronomical distance. Its limit is the smallest angle that can be measured. Turbulence in Earth’s atmosphere blurs star images, so telescopes on the ground can measure angles down to about 0.01 arc-seconds, giving distances of up to about 100 pc. Satellites above the atmosphere do far better. The European Space Agency’s Gaia satellite, launched in 2013, has measured parallaxes for over a billion stars, with the best measurements precise to a few hundred-thousandths of an arc-second, reaching stars thousands of parsecs away.
Determining the radius of a star
Stars are so far away that even the largest telescopes see almost all of them as points, so their radii cannot usually be measured directly. Instead, the radius is calculated from the luminosity and the surface temperature:
the surface temperature T comes from the peak wavelength of the spectrum (Wien’s law);
the luminosity L comes from the apparent brightness and the distance, L=4πd2b, with d from parallax;
the radius then follows from L=σ4πR2T4.
It is often quicker to compare a star with the Sun. Dividing the Stefan–Boltzmann law for the star by the same law for the Sun cancels σ and 4π:
L⊙L=(R⊙R)2(T⊙T)4⇒R⊙R=L⊙L(TT⊙)2
The same comparison shows how small a star can be when it is hot but very dim.
The Hertzsprung–Russell diagram
In the early twentieth century Ejnar Hertzsprung and Henry Norris Russell independently plotted the luminosities of stars against their temperatures. Instead of a random scatter, the stars fell into a few distinct groups. The Hertzsprung–Russell diagram (HR diagram) built from such data is the most important tool for understanding stars, because the groups correspond to different stages in the lives of stars.
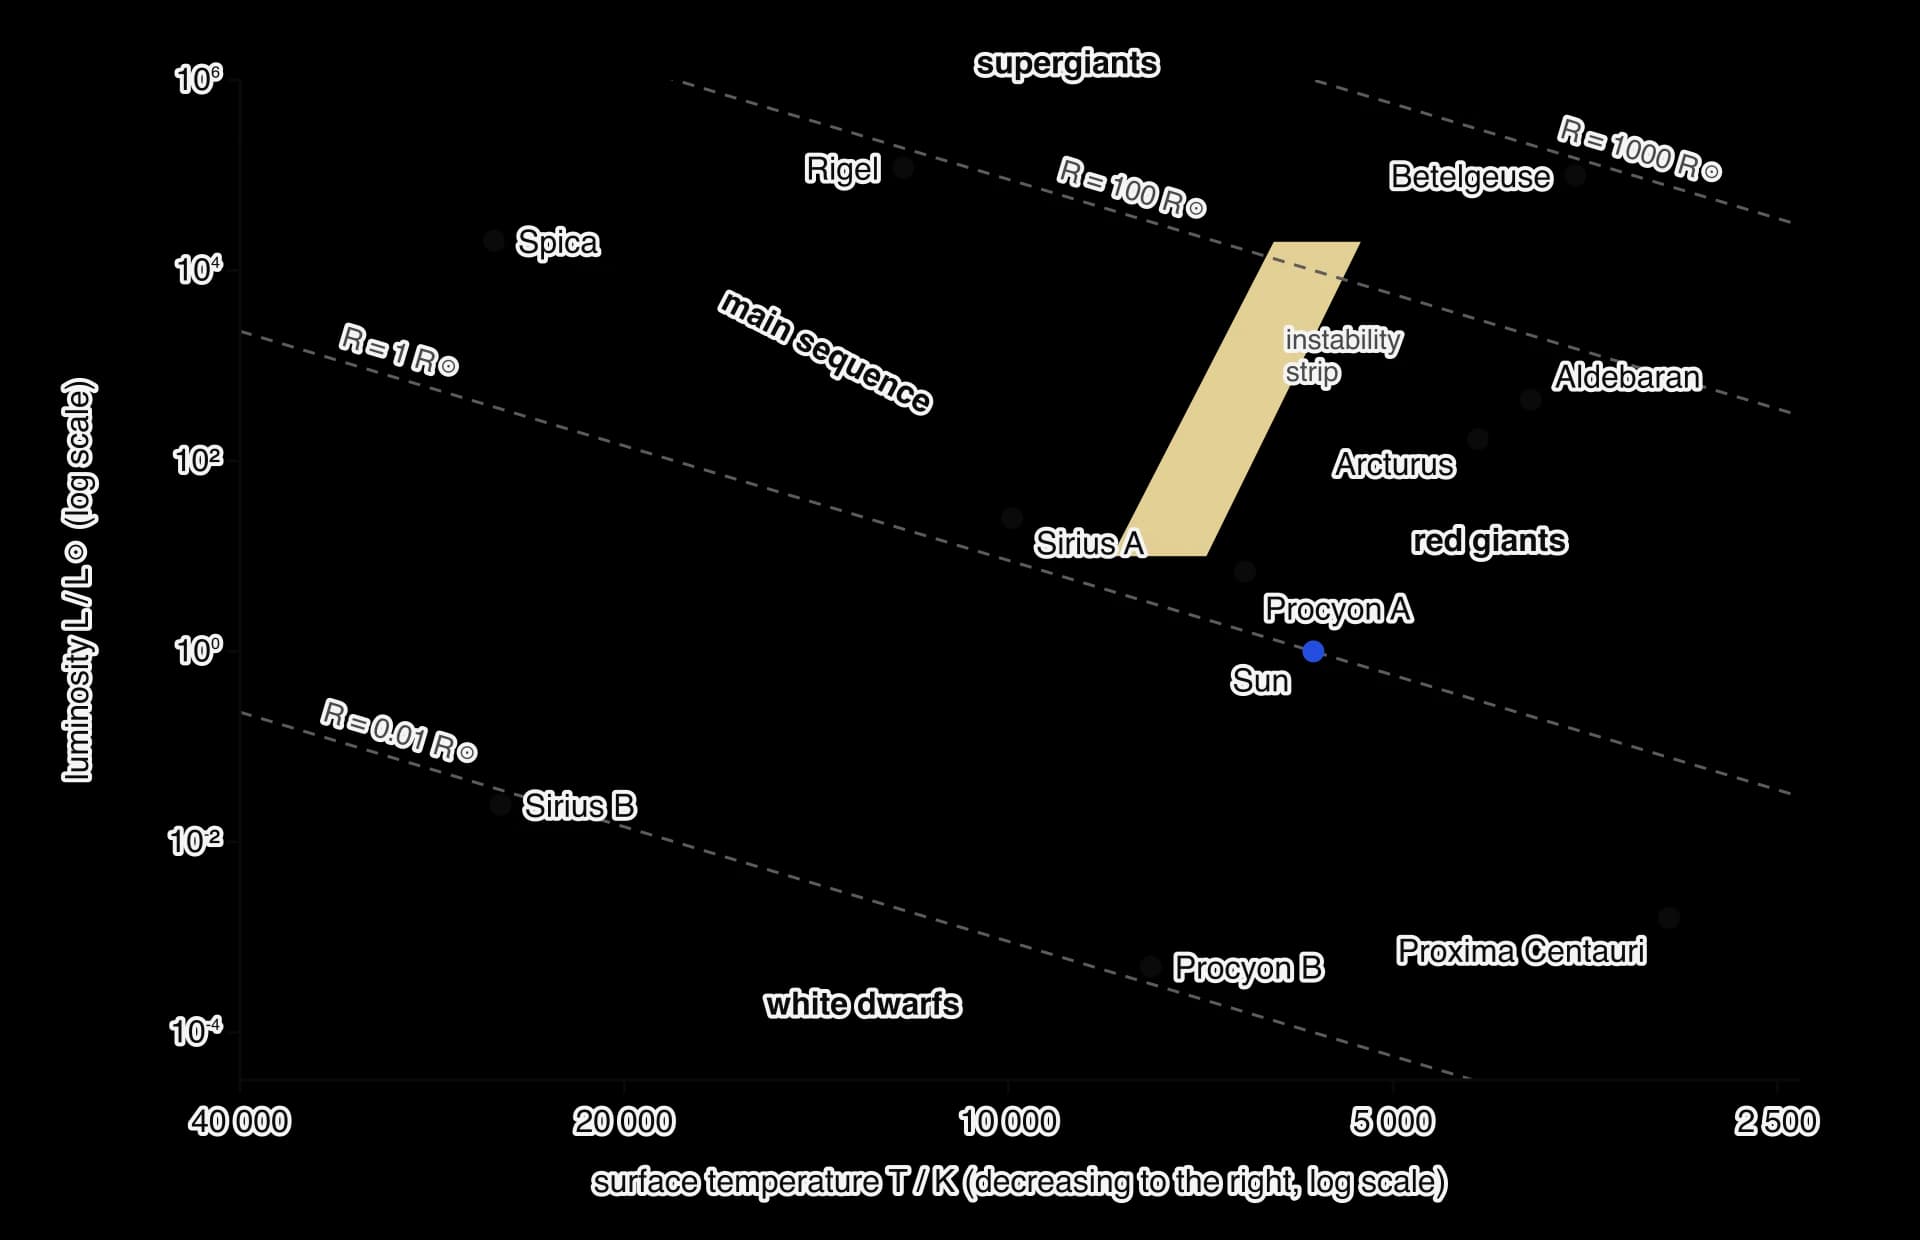
Real stars on an HR diagram. Hot stars are on the left. The dashed lines join stars of equal radius (0.01, 1, 100 and 1000 solar radii), so size increases towards the top right. The yellow band is the instability strip, where stars pulsate. The Sun is blue. Data: published luminosities and temperatures of each star as summarised in its Wikipedia article, 2026; values for supergiants are uncertain by tens of per cent.
How the axes are drawn
Vertical axis: luminosity, usually in units of L⊙, on a logarithmic scale running from about 10−4 to 106.
Horizontal axis: surface temperature, on a logarithmic scale, with temperature decreasing from left to right (from about 40 000 K to 2500 K).
Logarithmic scales are needed because luminosities span ten powers of ten. The reversed temperature axis is a historical convention: the diagram was first drawn with spectral types ordered from hot to cool.
The main regions
The main sequence is the diagonal band from hot, luminous stars at the top left to cool, dim stars at the bottom right. About 90% of stars lie on it, including the Sun, because stars spend most of their lives fusing hydrogen into helium in their cores. A star’s position on the main sequence is set by its mass: the more massive the star, the hotter and more luminous it is.
Region
Surface temperature
Luminosity / L⊙
Radius / R⊙
What is happening
Examples
Main sequence
2500–40 000 K
10−4 to 106
0.1–20
Hydrogen fusion into helium in the core
Sun, Sirius A, Proxima Centauri
Red giants
3500–5000 K
10 to 103
10–100
Helium fusion in the core; hydrogen fusion in a shell around it
Aldebaran, Arcturus
Supergiants
3500–40 000 K
104 to 106
30–1000
Fusion of heavier elements in massive stars
Betelgeuse (red), Rigel (blue)
White dwarfs
5000–40 000 K
10−4 to 10−1
about 0.01
No fusion; the hot core of a dead star cooling down
Sirius B, Procyon B
Red giants lie above and to the right of the main sequence: cool, but luminous, so large. Supergiants lie across the top of the diagram and are the largest and most luminous stars of all. White dwarfs lie below and to the left of the main sequence: hot, but very dim, so tiny.
Lines of constant radius
Because L=σ4πR2T4, stars of the same radius lie on a straight line, a line of constant radius, on an HR diagram with logarithmic axes. Taking logarithms,
logL=4logT+2logR+log(4πσ)
For a fixed R this is a straight line of gradient 4 in logL against logT. Since temperature decreases to the right, each line slopes downwards from top left to bottom right; how steep it looks depends on the scales chosen for the two axes. Lines for larger radii lie further up and to the right. The dashed lines on the HR diagram of real stars show that white dwarfs are about 100 times smaller than the Sun and red supergiants such as Betelgeuse several hundred times larger.
The instability strip
A narrow, almost vertical band crosses the HR diagram between the main sequence and the supergiants, at surface temperatures of roughly 5000–8000 K. This is the instability strip. Stars passing through it are not in steady equilibrium: their outer layers swell and shrink regularly, so their radius, temperature and luminosity rise and fall with periods from a few hours to many days. Most of these pulsating variable stars are evolved stars crossing the region as they change, not stars on the main sequence.
YouTube
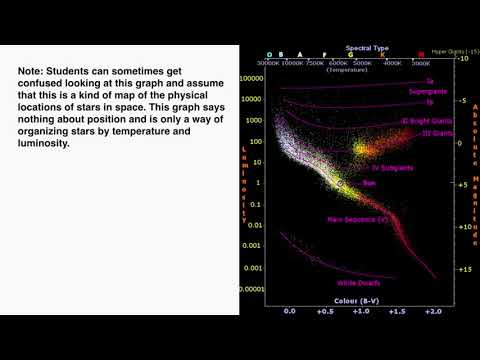
IB Physics – Andy Masley: Hertzsprung–Russell diagrams of stars.
Stellar evolution and the effect of mass
From nebula to main sequence
Stars form in a nebula, a vast cloud of gas (mostly hydrogen and helium) and dust. A region of the cloud that is dense enough begins to collapse under its own gravity. As it contracts, gravitational potential energy is transferred into internal energy and the centre heats up, forming a protostar. When the core reaches about 10 million K and is dense enough, hydrogen fusion begins. The outward pressure then stops the collapse, and the star settles onto the main sequence.
The effect of mass on a star’s life
The most important property of a star is its mass. It decides where the star joins the main sequence, how long it stays there, and how it ends. A more massive star has a stronger gravitational pull, so its core must be hotter and denser to hold it up. The fusion rate rises very steeply with temperature, so a massive star is far more luminous and uses up its fuel much faster, even though it has more of it.
Mass of star / M⊙
Main-sequence lifetime
Final stage
0.5
several tens of billions of years
White dwarf (none yet formed: the universe is too young)
1 (the Sun)
about 10 billion years
White dwarf
5
about 100 million years
White dwarf
15
about 15 million years
Neutron star
40
about 5 million years
Black hole
Lifetimes and final stages are approximate, from models of stellar evolution; the outcome also depends on how much mass a star loses during its life.
Estimating a main-sequence lifetime
For main-sequence stars, luminosity rises steeply with mass, roughly as L∝M3.5. The fuel available is proportional to M, and it is used at a rate proportional to L, so the lifetime t is
t∝LM∝M3.5M=M−2.5
A star of 10M⊙ therefore lasts about 10−2.5≈3001
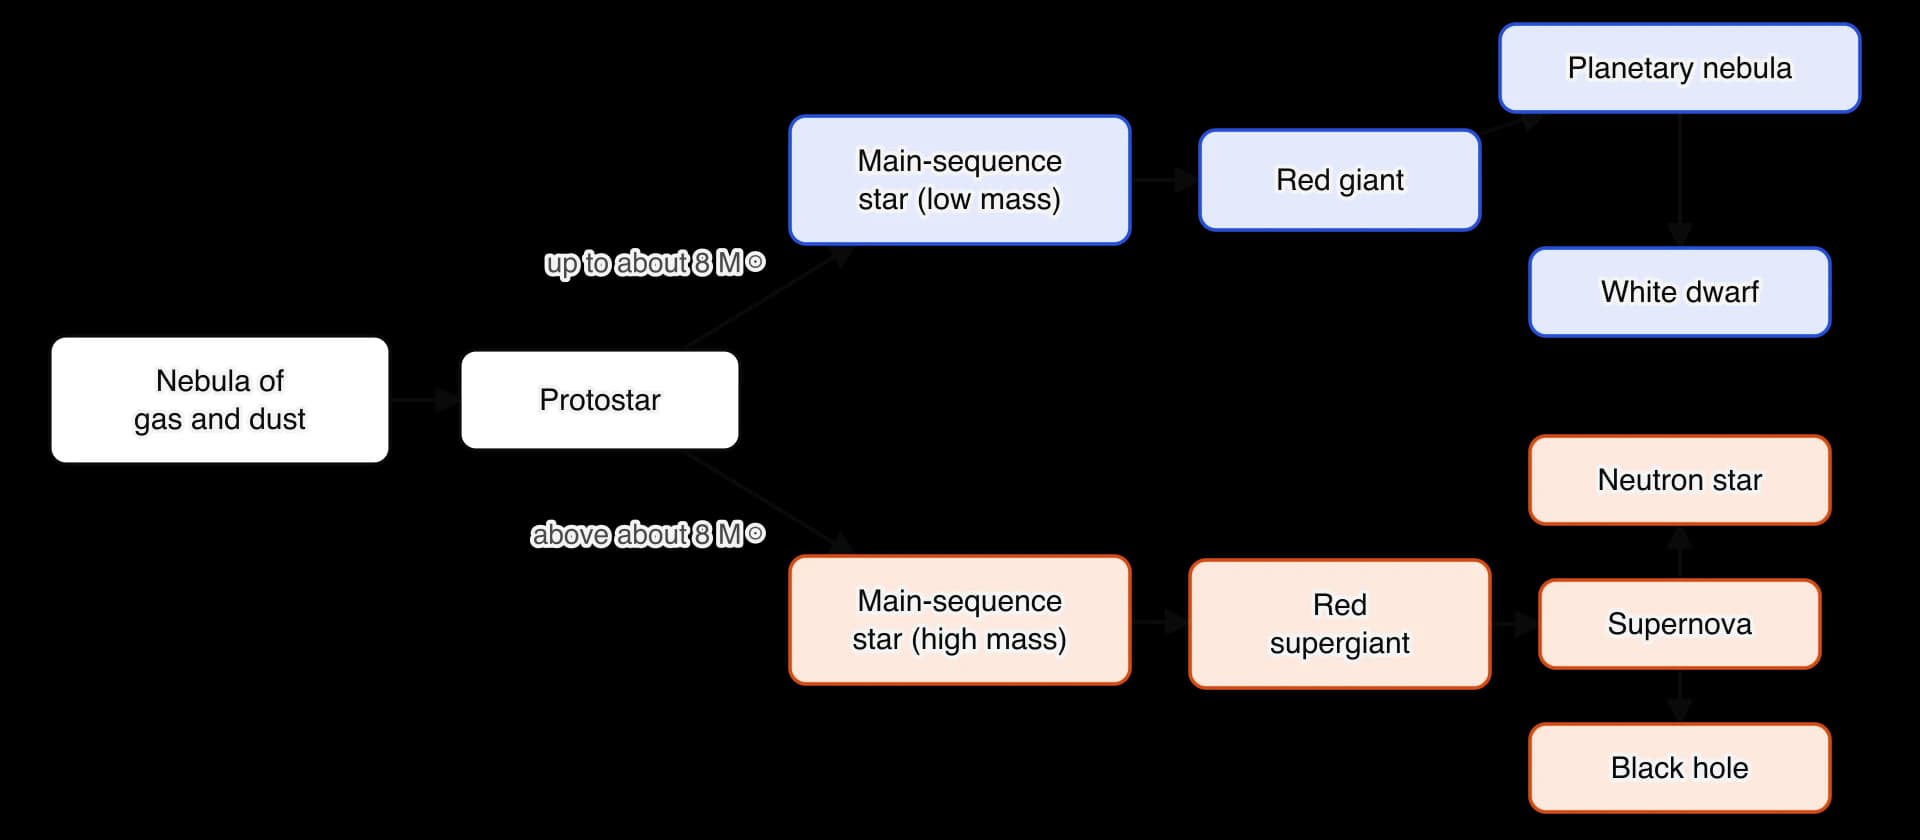
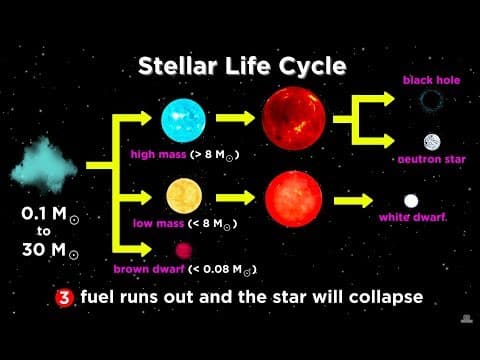
The life of a star depends on its mass. Low-mass stars such as the Sun (blue) end as white dwarfs; stars more massive than about 8 solar masses (orange) end in a supernova, leaving a neutron star or a black hole.
Low-mass stars: the Sun’s future
Stars with masses up to about 8M⊙, including the Sun, follow the same general path.
Main sequence. Hydrogen fuses to helium in the core for most of the star’s life.
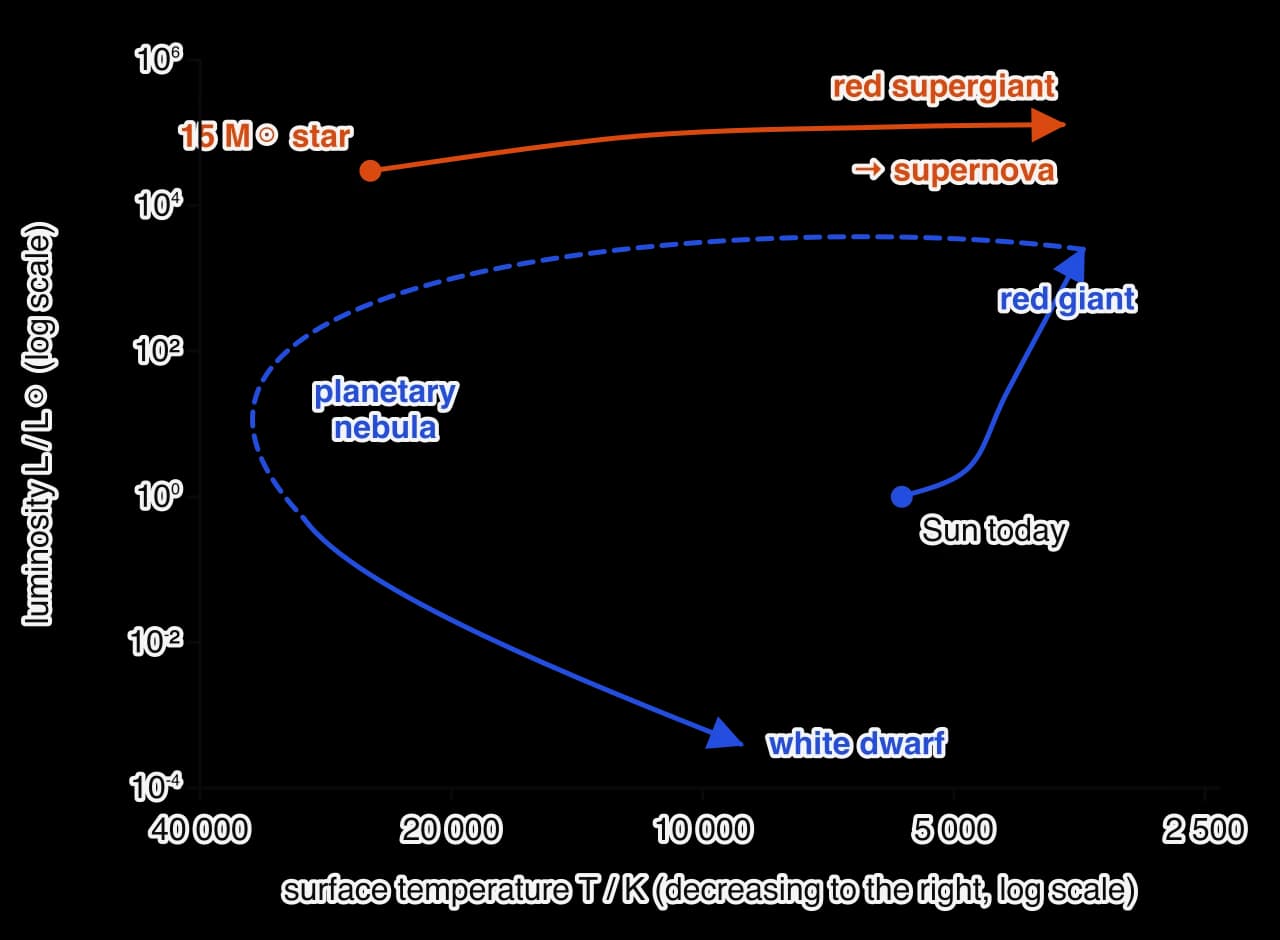
Red giant. When the hydrogen in the core runs out, fusion there stops and the core contracts under gravity, heating up. Hydrogen begins to fuse in a shell around the core, and the extra energy makes the outer layers expand enormously and cool. The star becomes a red giant: its luminosity rises, its surface temperature falls, and it moves up and to the right on the HR diagram. When the core reaches about 100 million K, helium nuclei fuse to carbon (and some oxygen), and helium fusion in the core becomes the star’s main energy source.
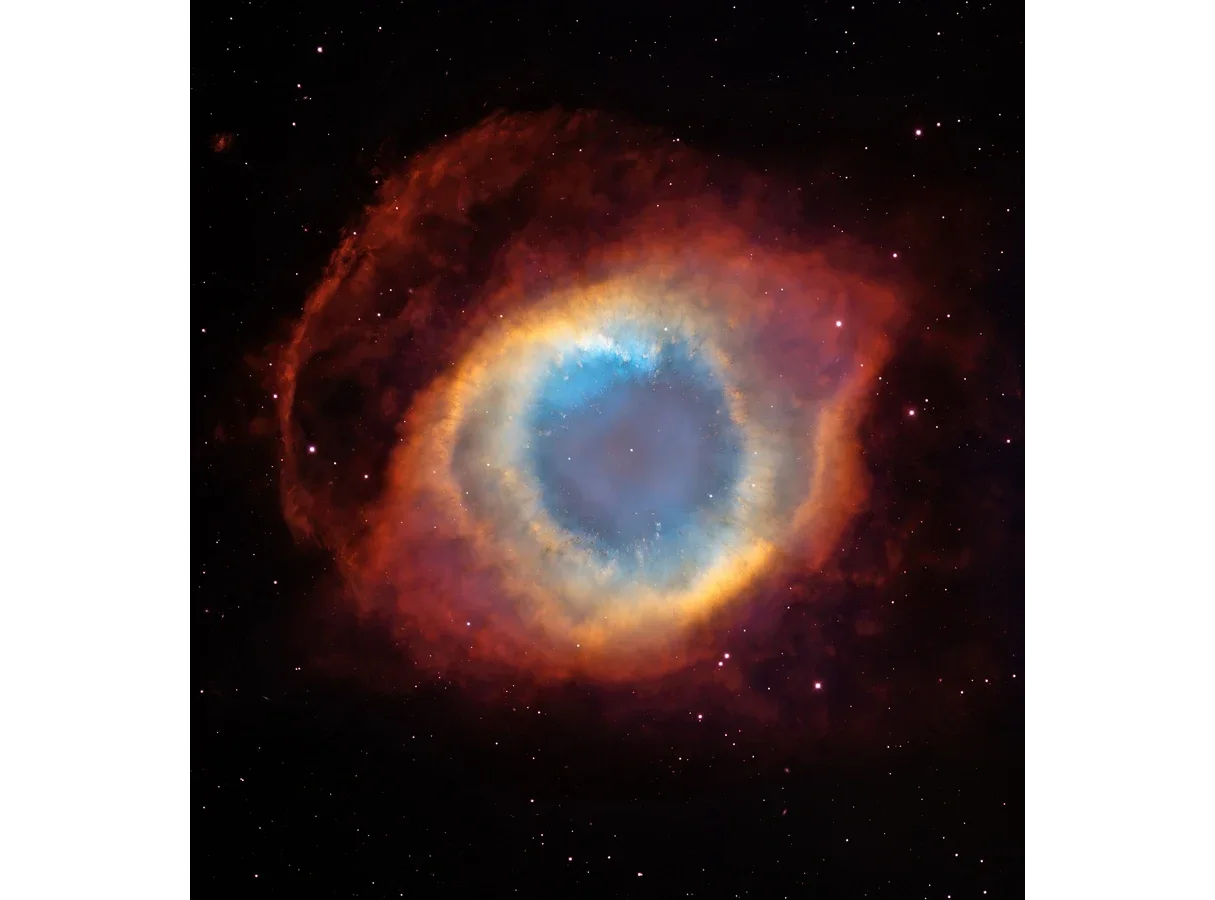
Planetary nebula. When the helium in the core is used up, the star cannot become hot enough to fuse carbon. Its outer layers drift away into space as a glowing shell of gas, a planetary nebula.
White dwarf. The exposed core, made mostly of carbon and oxygen, remains as a white dwarf: very hot, very dense and about the size of Earth. No fusion happens in it. Gravity is balanced by the pressure of electrons packed tightly together, a quantum effect that does not depend on temperature, so the white dwarf simply cools and fades over billions of years.
Evolutionary paths on an HR diagram. The Sun (blue) will swell into a red giant, shed its outer layers and end as a white dwarf. A massive star (orange) moves across the top to become a red supergiant before exploding as a supernova.
In about 5 billion years the Sun will become a red giant more than 100 times its present radius, swallowing Mercury and Venus and possibly Earth. It will then shed its outer layers and end as a white dwarf of about half its present mass.
The Helix Nebula, a planetary nebula about 650 light-years away. The glowing shells are the outer layers of a star like the Sun, thrown off at the end of its red-giant stage; the hot white dwarf left behind sits at the centre. Image: Wikimedia Commons (public domain).
High-mass stars
Stars of more than about 8M⊙ evolve much faster and end in an explosion.
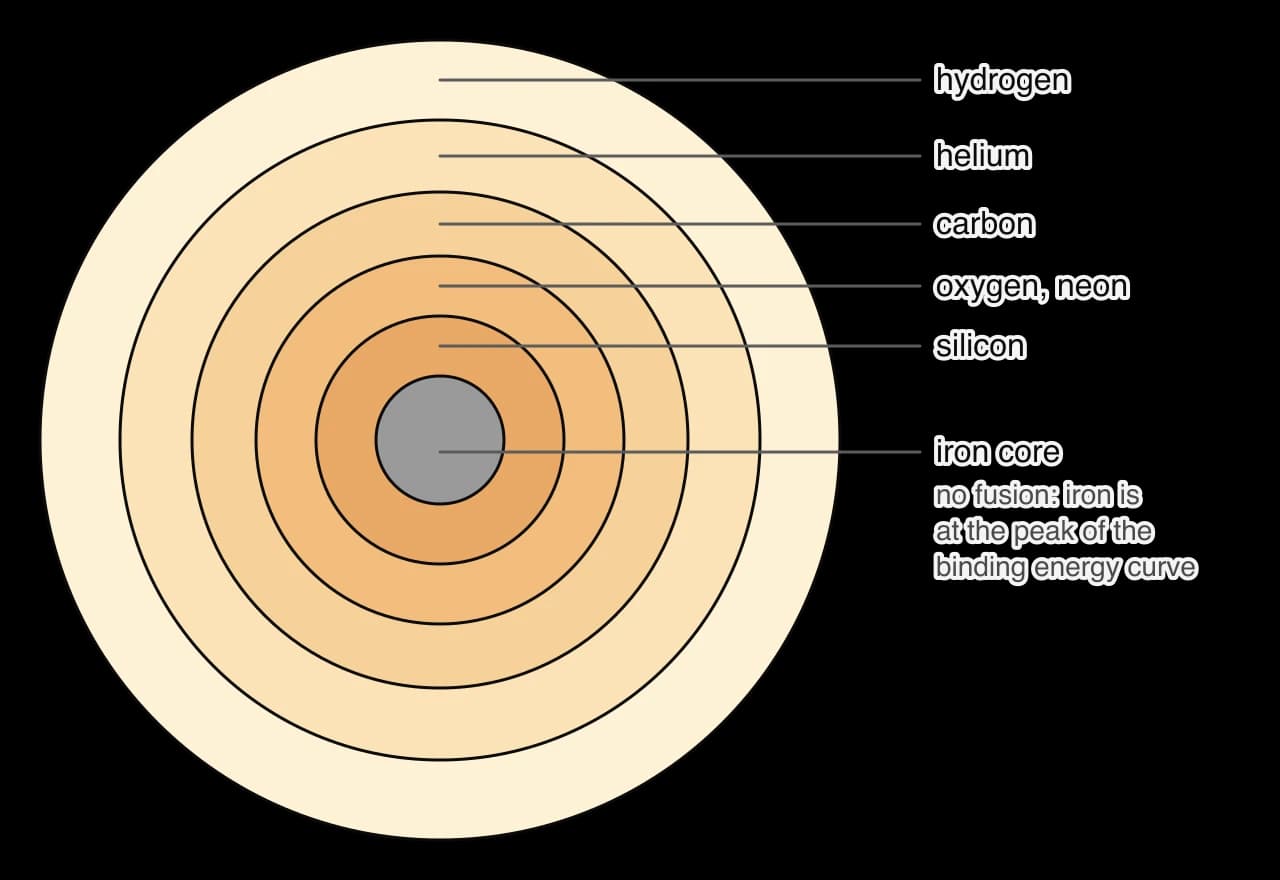
Red supergiant. When hydrogen in the core runs out, the star swells into a supergiant. Its core is so hot that after helium it fuses carbon, then neon, oxygen and silicon, each stage lasting a shorter time than the last. The star ends with layers of different elements around an iron core.
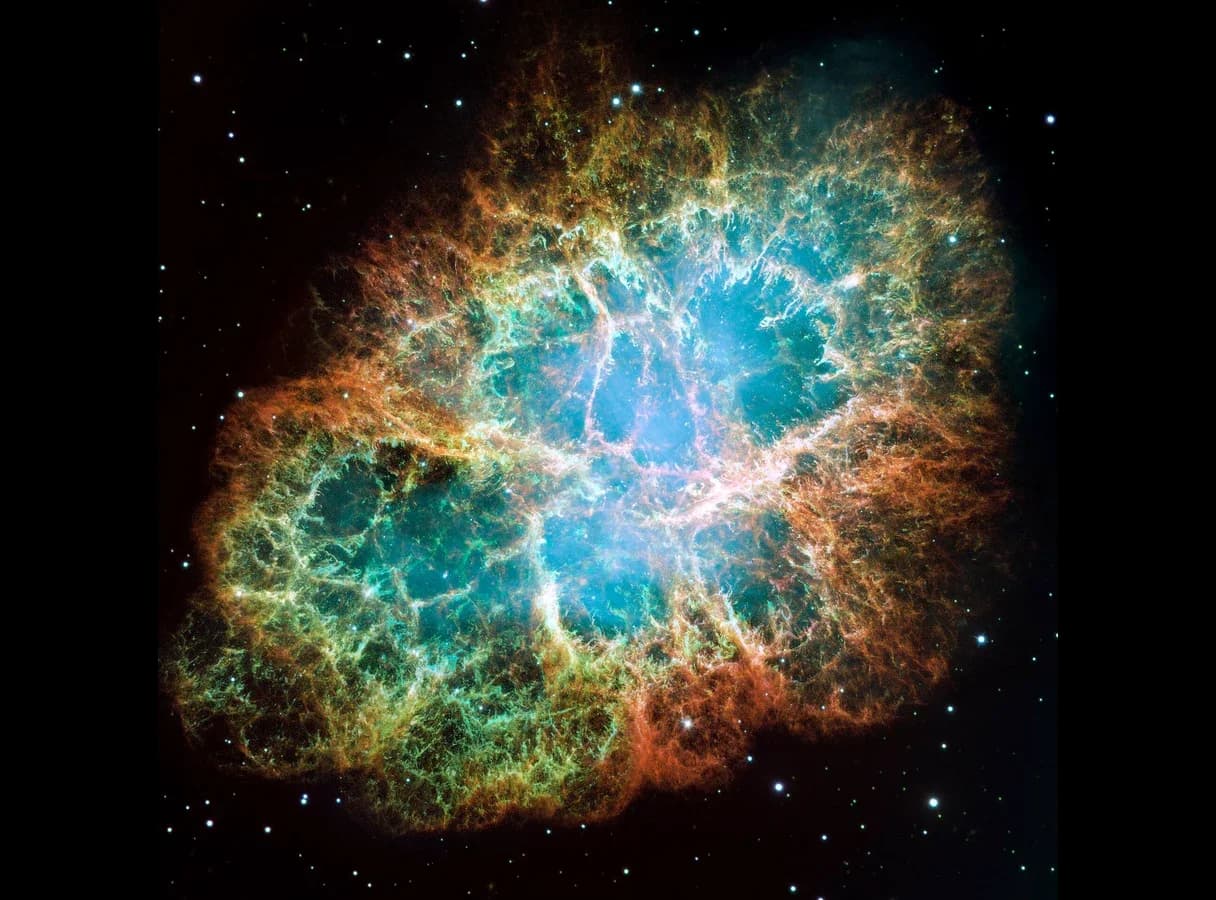
Supernova. Iron is at the peak of the binding energy curve, so fusing it releases no energy. With no energy source in the core, nothing can resist gravity: in less than a second the core collapses. The outer layers fall in, rebound and are blown out in a supernova, an explosion that can briefly outshine a whole galaxy.
Neutron star or black hole. If the remaining core has a mass of up to about 3M⊙, protons and electrons combine into neutrons and the pressure of the closely packed neutrons stops the collapse, leaving a neutron star about 20 km across. If the core is more massive still, nothing can stop the collapse, and it becomes a black hole, a region whose gravity is so strong that not even light can escape from it.
Late in its life a massive star fuses heavier and heavier elements in nested shells around its core (not to scale). Fusion stops at iron, because making nuclei heavier than iron absorbs energy instead of releasing it.
Making the elements
Fusion in stars is the origin of most of the chemical elements, a process called nucleosynthesis. Main-sequence stars make helium; red giants make carbon and oxygen; massive stars build up elements as far as iron. Elements heavier than iron cannot be made by fusion that releases energy. They are formed by neutron capture in supernovae and other extreme events, which also scatter all these elements into space, where they are taken up by new stars and planets.
The Crab Nebula, the expanding remains of a supernova recorded by astronomers in 1054. At its centre is a neutron star that spins about 30 times a second. Image: Wikimedia Commons (public domain).
Betelgeuse, a red supergiant of about 15–20 solar masses, is expected to explode as a supernova within the next 100 000 years. Between late 2019 and early 2020 it dimmed to about a third of its usual brightness, which led to speculation that it was about to explode; observations showed that the dimming was caused mainly by a cloud of dust thrown off by the star, together with a cooler patch on its surface.
The end states compared
White dwarf
Neutron star
Black hole
Formed from
Stars up to about 8 M☉, after a planetary nebula
Stars of about 8–25 M☉, after a supernova
The most massive stars, after a supernova
Typical mass
About 0.6 M☉ (always below about 1.4 M☉)
About 1.4–2 M☉
Above about 3 M☉
Typical size
About the size of Earth
About 20 km across
No surface; the region from which light cannot escape is tens of km across for a black hole of a few solar masses
What resists gravity
Pressure of closely packed electrons
Pressure of closely packed neutrons
Nothing
Example
Sirius B
The neutron star in the Crab Nebula
Cygnus X-1
YouTube
Professor Dave Explains: the life and death of stars, white dwarfs, supernovae, neutron stars and black holes.
Applying the ideas in exam questions
Questions on stars usually combine several relationships in one calculation, such as Wien’s law for temperature, parallax for distance, the inverse-square law for luminosity and the Stefan–Boltzmann law for radius. Setting out each step separately, with its equation, earns method marks even if an early number is wrong.
Paper 1A: distance from parallax
Paper 1A: radius from luminosity and temperature
Paper 1A: the energy source of a red giant
Paper 1B: measuring a parallax
A group of students uses archive images of a star taken six months apart. They measure the total angular shift of the star against background stars five times.
Trial
1
2
3
4
5
Total shift / arc-second (± 0.002)
0.052
0.049
0.051
0.048
0.050
Paper 2: the properties of a star
Paper 2: fusion and the stability of the Sun
Self-check
To do:
I can explain why fusion of light nuclei releases energy, using the binding energy per nucleon curve.
To do:
I can calculate the energy released in a fusion reaction from the masses of the particles.
To do:
I can explain why fusion needs a high temperature and a high density.
To do:
I can explain how gas and radiation pressure balance gravity in a stable star, and why the balance corrects itself.
To do:
I can use b = L/4πd² and L = σ4πR²T⁴ to find luminosity, brightness, distance and temperature.
To do:
I can find a star’s surface temperature from the peak wavelength of its spectrum, and explain how its composition is found from absorption lines.
To do:
I can explain stellar parallax, define the parsec and use d = 1/p.
To do:
I can convert between AU, light-years, parsecs and metres.
To do:
I can determine the radius of a star from its luminosity and surface temperature, including by comparison with the Sun.
To do:
I can sketch an HR diagram with correct axes, and mark the main sequence, red giants, supergiants, white dwarfs, the instability strip and lines of constant radius.
To do:
I can place a star on an HR diagram from its data and compare the radii of stars from their positions.
To do:
I can describe the evolution of low-mass and high-mass stars and explain the role of mass.
To do:
I can describe white dwarfs, neutron stars and black holes and how each is formed.
is the radius of the Sun.
What is the radius of the red giant?
A
2.5R⊙
B
20R⊙
C
40R⊙
D
1600R⊙
Explanation
L=σ4πR2T4, so R2∝T4L: R⊙2R2=100×24=1600 and R=40R⊙. A divides by 24 instead of multiplying, B uses T2 and D forgets the square root.
The answer is C.
Question 2 · PHY-002601 mark
Star X has twice the luminosity of star Y and is four times as far from the Earth.
What is apparent brightness of Yapparent brightness of X?
A small uncrewed probe is to travel from Earth to a star 4.4 ly away in the reference frame of Earth. The probe is accelerated by a powerful laser beam to a cruising speed of 0.20c and then travels at this constant speed. Ignore the motion of the star relative to Earth.
(a)
The probe accelerates from rest to 0.20c with a constant acceleration of 1500m s−2. Calculate the time taken and the distance travelled during this acceleration. Use Newtonian mechanics.
[2]2 marks
(b)
Outline why it is reasonable to use Newtonian mechanics in (a).
[1]1 mark
(c)
The acceleration distance and time are negligible for the rest of the question. Calculate, in years, the time taken for the journey to the star in the reference frame of Earth.
[1]1 mark
(d)
Calculate the time for the journey measured by a clock on the probe.
[2]2 marks
(e)
Calculate the distance between Earth and the star in the reference frame of the probe.
[1]1 mark
(f)
On arrival, the probe sends a radio signal to Earth. Determine, in the reference frame of Earth, the time between the probe passing Earth at its cruising speed and the signal arriving at Earth.
[2]2 marks
(g)
Sketch a spacetime diagram in the reference frame of Earth, with x and ct axes, showing the world lines of Earth, the probe and the radio signal. Label the coordinates of the arrival at the star and the reception of the signal.
[3]3 marks
(h)(i)
The probe's instruments are powered by a radioactive source of plutonium-238, which has a half-life of 88 years. Outline why the time measured on the probe, rather than the time measured on Earth, determines how much of the plutonium decays during the journey.
[1]1 mark
(h)(ii)
The power output of the source is 300 W at the start of the cruise. Calculate the power output when the probe reaches the star. Assume the power is proportional to the activity of the source.
[2]2 marks
(i)
The luminosity of the star is 1.5 times the luminosity of the Sun, which is 3.83×1026 W. Mission scientists want to study a planet that receives the same intensity of starlight, 1.36×10³W m−2
(j)
The surface temperature of the star is 6100 K. Determine the radius of the star.
This is close to the measured 8.6 ly. Finding a distance this way needs the luminosity, which for most stars is itself known only once the distance has been measured another way, such as parallax.
Betelgeuse is about 800 times the radius of the Sun. Placed at the centre of the Solar System, it would extend beyond the orbit of Mars. Its luminosity is uncertain by tens of per cent, so published radii range from about 700 to 1000 R⊙. A star that is cooler than the Sun yet far more luminous must be enormous, because each square metre of its cooler surface radiates less.
Sirius B is hotter than the Sun but far less luminous, so it must be very small: about the size of Earth, although it has about the mass of the Sun. It is a white dwarf.
as long as the Sun: about 30 million years instead of 10 billion. This relation is only approximate, and different ranges of mass follow different powers.
.
C comes from ignoring the temperature; B from using (1/2) instead of (1/2)2; D from 16/2.
m «≈
3.5×10¹⁷
m» ✓
(b) L=4πd2b=4π(3.5×10¹⁷)2(5.0×10⁻⁸)=7.7×1028 W ✓
L/L⊙=7.7×1028/3.83×1026=200 ✓ (allow 190–210)
(c) T=2.9×10⁻³/680×10−9=4.3×103 K ✓
(d) R⊙R=200×(43005800)2 ✓ (or R=L/4πσT4 in metres)
=14.1×1.82=26 ✓ (allow ECF from (b) and (c))
(e) red giant, because it is cooler than the Sun but much larger / more luminous ✓
(f) it will lose its outer layers as a planetary nebula ✓; the core remains as a white dwarf ✓
J ✓
✓
, as Earth receives from the Sun. Determine, in AU, the distance of this planet from the star.