4.8 The binomial distribution · IB Maths AA | Augment Education
4.8 The binomial distribution
Recognise binomial situations, calculate binomial probabilities by formula and with a GDC, use the mean np and variance np(1 − p), and find n or p from a given probability.
IB Mathematics: Analysis and Approaches
Part of 4 Statistics and probability
SL and HL
Key terms introduced here
Each is in the Maths AA glossary, with every other term in the subject.
The distribution of the number of successes X in n independent trials, each with the same probability of success p
Notes on 4.8 The binomial distribution
24 min readLast reviewed
Questions on 4.8
58 exam-style questions on this subtopic, written in the style of the IB papers. The first has its markscheme open. Counted on
Question 1 · AA-0039014 marks
A town has 6400 households. An energy company selects a simple random sample of 250 of these households. Of the households in the sample, 48 have solar panels.
(a)
Estimate the number of households in the town that have solar panels.
[2]2 marks
Markscheme (a)
25048×6400
Try a quick-fire question
One of 38 short multiple-choice questions on 4.8. Pick an answer to see why it's right or wrong.
X∼B(20,0.2). Using only cumulative probabilities P(X≤r), which expression gives P(X≥5)
From the formula booklet
The entries of the mathematics: analysis and approaches formula booklet that 4.8 uses. Each opens in the explained booklet.
The probability that a random variable takes a value less than or equal to a given value, P(X≤x). A GDC's binomial cdf function gives it directly.
for
X∼B(n,p)
, with and without a GDC.
Use the binomial pdf and cdf functions of a GDC for "at most", "at least", "more than", "fewer than" and "between".
Calculate the mean np and the variance np(1−p), and interpret them in context.
Find n or p from a given probability, by algebra or with a GDC table or solver.
Solve multi-stage problems that combine the binomial distribution with other probability rules.
Many random processes repeat the same simple trial a fixed number of times and count how often something happens: the number of free throws a basketball player scores out of 10, the number of faulty items in a box of 50, the number of correct answers when a student guesses on a multiple-choice test. When the trials are independent and each has the same probability of success, the count follows the binomial distribution. It is the most widely used discrete probability distribution.
The binomial distribution has a formula for every probability, a simple expression for its mean and variance, and built-in functions on every graphic display calculator (GDC). It connects the counting methods of the binomial theorem (1.9) with the expected values of discrete random variables (4.7).
When the binomial model applies
Bernoulli trials
The building block of the binomial distribution is a single trial with exactly two outcomes. The outcome being counted is called a success and the other a failure, whatever they mean in context: a "success" may be a faulty item or a patient who catches a disease.
Many trials with more than two outcomes can be turned into Bernoulli trials by grouping the outcomes. Rolling a die has six outcomes, but "roll a six" and "do not roll a six" are two, with p=61.
The four conditions
A random variable X follows a binomial distribution when it counts the number of successes in a sequence of Bernoulli trials that satisfy four conditions.
Fixed number of trials: the number of trials n is decided in advance.
Two outcomes: each trial results in success or failure.
Constant probability: the probability of success p is the same for every trial.
Independence: the outcome of one trial does not affect the outcome of any other.
The conditions are assumptions about the real situation, and in context they are often only approximately true. A basketball player's free throws are usually modelled as independent with a constant success rate, although tiredness or confidence may change the rate during a game. Stating which assumptions a model makes, and judging whether they are reasonable, is part of modelling with the binomial distribution.
The binomial probability formula
Deriving the formula from a tree diagram
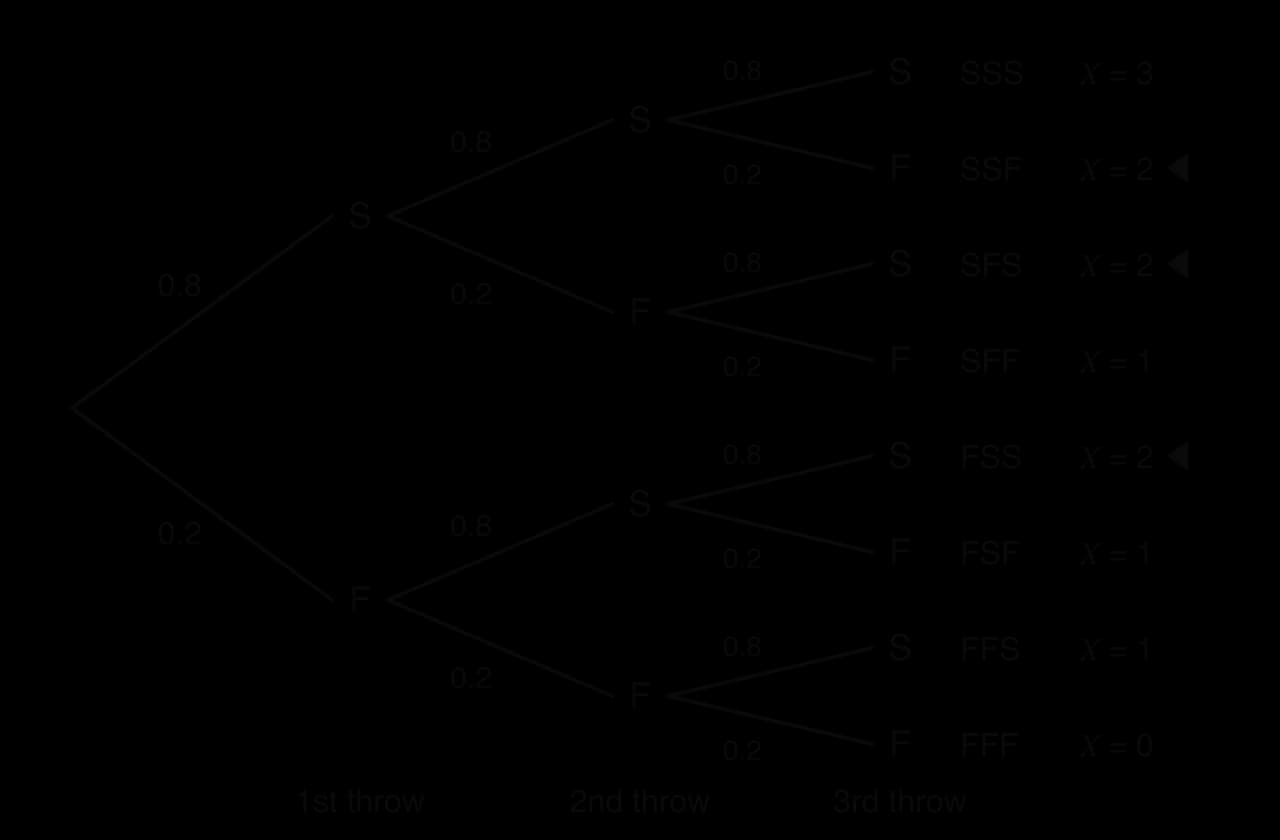
A basketball player scores each free throw with probability 0.8, independently of the others. She takes three free throws. Let X be the number she scores. Each throw is a success S or a failure F, so there are 23=8 possible sequences.
Three of the eight sequences contain exactly two successes, and each of them has probability 0.8 × 0.8 × 0.2, in some order.
Three sequences give exactly two successes: SSF, SFS and FSS. Each contains two factors of 0.8 and one of 0.2, so each has probability 0.82×0.2=0.128, and
P(X=2)=3×0.82×0.2=0.384
The same reasoning applies to any number of successes. With n trials, a sequence with r successes and n−r failures has probability pr(1−p)n−r, whatever the order. The number of such sequences is the number of ways to choose which r of the n trials are the successes, the binomial coefficient (rn) from 1.9. Here (23)=3.
Applying the formula to each value of r gives the complete distribution of the number of free throws scored, X∼B(3,0.8).
r
0
1
2
3
P(X=r)
0.23=0.008
3(0.8)(0.2)2=0.096
3(0.8)2(0.2)=0.384
0.83=0.512
Why the probabilities add up to 1
The terms (rn)pr(1−p)n−r are exactly the terms of the binomial expansion of (p+(1−p))n, which is where the distribution gets its name. Their sum is therefore
r=0∑n(rn)pr(1−p)n−r=(p+(1−p))n=1n=1
so every binomial distribution is a valid probability distribution. For B(3,0.8): 0.008+0.096+0.384+0.512=1.
Using the formula
To use the formula, identify n, p and the number of successes r, then substitute. Exact answers come from fractions when p is a simple fraction; otherwise give answers to 3 significant figures.
When p is a simple fraction, the formula gives exact answers that can be worked out by hand. Complements are especially useful: "at least one success" is the complement of "no successes", and P(X=0)=(1−p)n is a single power.
The shape of a binomial distribution
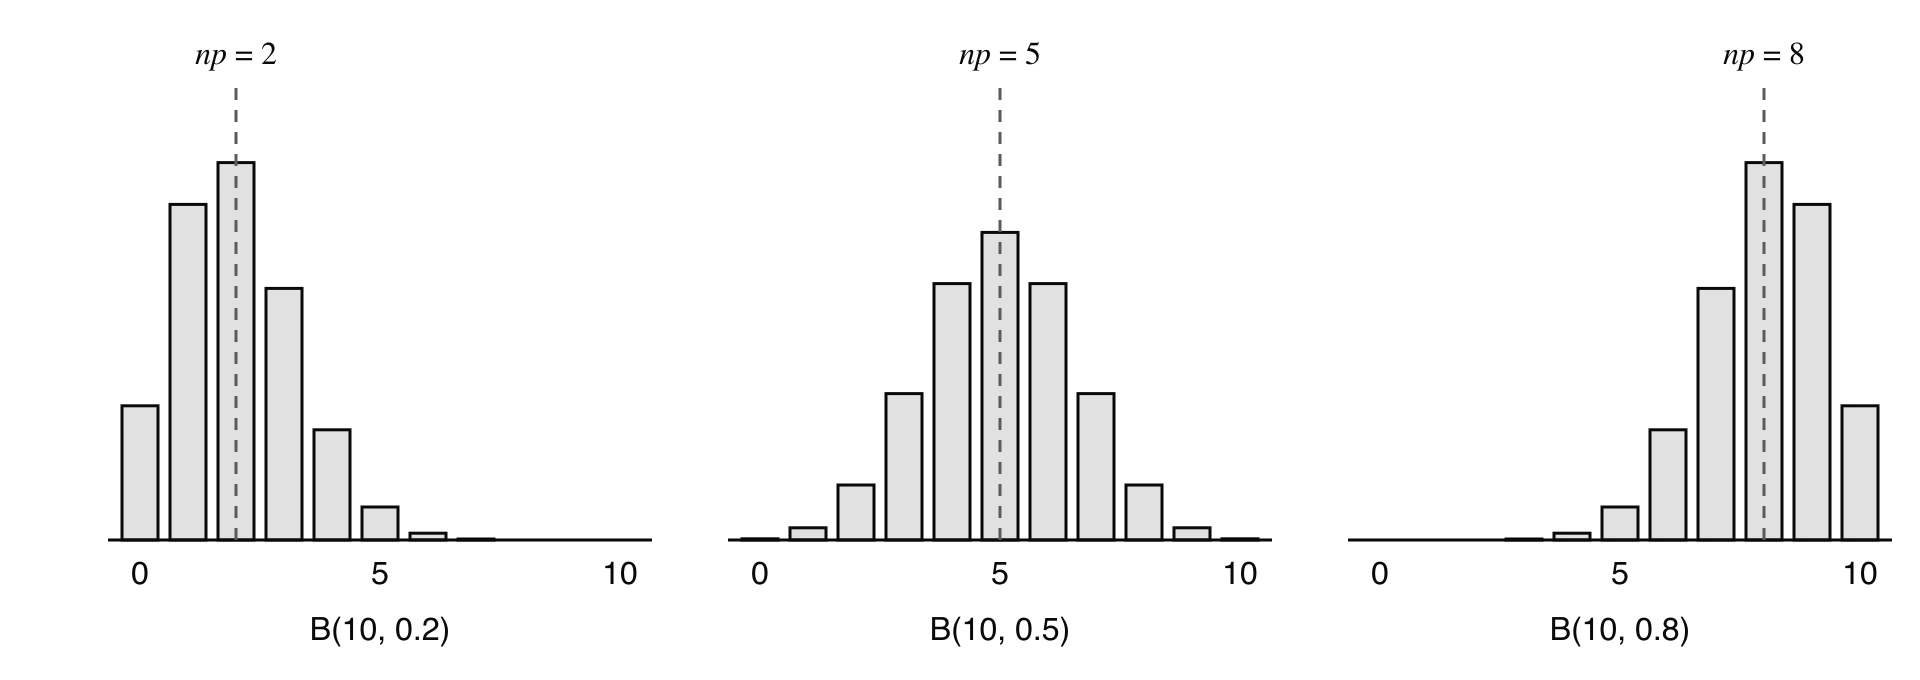
The shape of B(n,p) depends on p. When p=0.5 the distribution is symmetric about 2n, because successes and failures are equally likely. When p is small, most of the probability sits on small values and the distribution has a long tail to the right (positive skew). When p is large, the picture is reflected and the tail is to the left.
With n = 10, the peak sits at or next to the mean np. B(10, 0.2) and B(10, 0.8) are mirror images, because successes in one are failures in the other.
The reflection in the figure is a general fact. If X∼B(n,p) counts successes, then n−X counts failures, and n−X∼B(n,1−p). For example, the probability of exactly 2 successes in B(10,0.2) equals the probability of exactly 8 successes in B(10,0.8).
Cumulative probabilities and the GDC
The binomial pdf and cdf functions
Questions often ask for the probability of a range of values, such as "at most 3" or "at least 5". Adding many terms of the formula by hand is slow, so a GDC is normally used. It has two binomial functions:
the binomial pdf gives a single probability, P(X=r);
the binomial cdf gives a cumulative probability, P(X≤r), the sum P(X=0)+P(X=1)+⋯+P(X=r).
Some calculators ask for a lower and an upper bound in the cdf, and then give P(a≤X≤b) directly. Others give only P(X≤r), and every other range must be rewritten in that form, using the complement and the fact that X takes only whole-number values.
Translating words into inequalities
Because X takes only the values 0,1,2,…,n, the inequality X>3 means the same as X≥4, and X<3 means X≤2. Each phrase in a question becomes an inequality, then a calculation with the cdf.
Words
Inequality
Using P(X≤r) only
at most 3
X≤3
P(X≤3)
fewer than 3, less than 3
X≤2
P(X≤2)
at least 3, no fewer than 3
X≥3
1−P(X≤2)
more than 3, greater than 3
X≥4
1−P(X≤3)
between 3 and 6 inclusive
3≤X≤6
P(X≤6)−P(X≤2)
more than 3 but fewer than 7
4≤X≤6
P(X≤6)−P(X≤3)
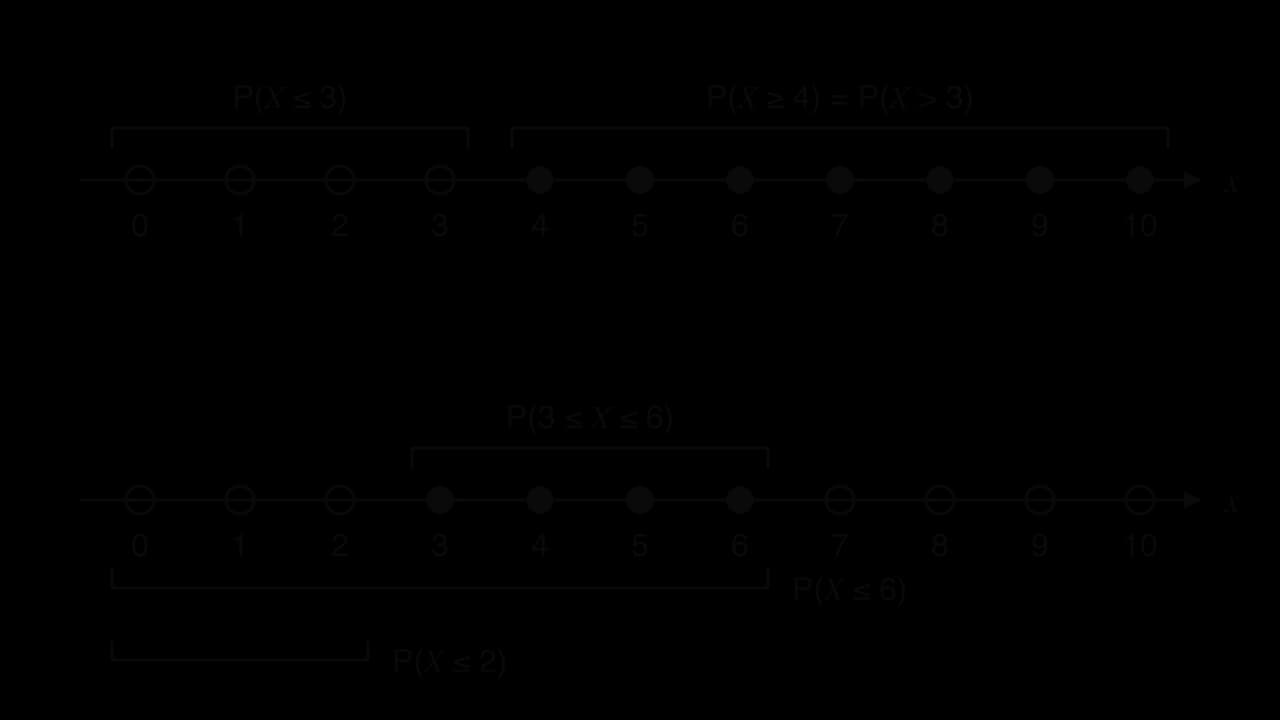
A number line of the whole numbers 0,1,2,… makes the end points clear. Mark the values that are included, then see which cumulative probability covers them.
Top: the values 4 and above are everything except 0 to 3, so P(X ≥ 4) = 1 − P(X ≤ 3). Bottom: removing 0 to 2 from 0 to 6 leaves 3 to 6.
The guessing student in a 10-question multiple-choice test gives a second example with the cdf. The probability of passing with 5 or more correct answers by guessing alone is
P(X≥5)=1−P(X≤4)=1−0.92187…=0.0781 (3 s.f.)
for X∼B(10,0.25), so fewer than 1 in 12 students who guess everything would pass.
Mean and variance of the binomial distribution
The mean np
If a player scores 80% of her free throws, then in 40 attempts she is expected to score about 40×0.8=32. In general, each of the n trials succeeds with probability p, so the long-run mean number of successes is np. This is the expected number of occurrences from 4.5, and it is the expected value E(X) of the binomial random variable.
For a small case, the result can be checked with E(X)=∑xP(X=x) from 4.7. For X∼B(3,0.8),
The variance of a random variable measures how spread out its values are about the mean, in the same way that the variance of a data set does (4.3). For the binomial distribution it has a simple formula, and the standard deviation is its square root.
The variance np(1−p) is largest when p=0.5 and becomes small when p is close to 0 or 1. This matches intuition: if success is almost certain, the number of successes is almost certain too, and there is little spread. A larger number of trials gives a larger variance, but the proportion of successes, nX, becomes less spread out as n grows, which is the informal law of large numbers from 4.5.
Since np and np(1−p) are two equations in n and p, a given mean and variance determine the distribution. Dividing the variance by the mean removes n and leaves 1−p.
Finding n or p
Finding the number of trials n
A common practical question asks how many trials are needed to make an event likely enough: how many components to test, how many people to survey, how many attempts to make. When the event is "at least one success", the complement P(X=0)=(1−p)n turns the problem into an exponential inequality, which logarithms solve.
For events such as "at least two successes", there is no simple algebraic route. A GDC table of values solves the problem: enter the probability as a function of n, for example 1−P(X≤1) with the binomial cdf, and scroll through values of n until the probability first passes the target.
Finding the probability of success p
When p is unknown, a given probability gives an equation in p. If the event is X=0 or X=n, the equation is a single power and can be solved exactly. If it is a single value of r such as P(X=1)=P(X=2), the common factors cancel and the equation simplifies.
For a cumulative probability, the equation in p is a polynomial that generally cannot be solved by hand, so a GDC is used: either graph y=P(X≤r) as a function of p and find its intersection with the target value, or use the equation solver.
Combining the binomial distribution with other probability
Binomial distributions in two stages
The probability of success in one binomial model is sometimes itself a binomial probability. For example, a "good day" might be defined by the number of successes during the day, and then the number of good days in a week is a second binomial count. Work out the first probability fully, keep it unrounded, and use it as p in the second distribution.
Conditional probability with a binomial variable
Conditional probabilities use the formula P(A∣B)=P(B)P(A∩B) from 4.6, with the events written as inequalities in X. Find the intersection of the two inequalities first.
Exam-style questions on the binomial distribution
Binomial questions appear on both calculator and non-calculator papers. With a GDC, the work is mostly in identifying the distribution and translating the words into inequalities; without one, the formula and complements must be used by hand.
Self-check
To do:
I can state the four conditions for a binomial model and decide whether a situation meets them.
To do:
I can explain why P(X=r)=(rn)pr(1−p)n−r, using a tree diagram.
To do:
I can calculate binomial probabilities by hand, including with complements such as 1−(1−p)n.
To do:
I can translate "at most", "at least", "more than", "fewer than" and "between" into inequalities and use the binomial cdf.
To do:
I can find and interpret the mean np, the variance np(1−p) and the standard deviation.
To do:
I can find n and p from a given mean and variance.
To do:
I can find the least n for a probability to exceed a target, using logarithms or a GDC table.
To do:
I can find an unknown p from a given probability, by algebra or with a GDC.
To do:
I can solve two-stage and conditional problems involving a binomial distribution.
(M1)
=1228.8, so approximately 1230 households A1
Note: Accept 1229 or 1228.8.
(b)(i)
The daily electricity use, E kWh, of each household in the sample is recorded. The results are shown in the following table.
Daily use, E kWh
Number of households
0≤E<5
18
5≤E<10
52
10≤E<15
85
15≤E<20
61
20≤E<25
26
25≤E<30
8
Write down the modal class.
[1]1 mark
Markscheme (b)(i)
10≤E<15A1
(b)(ii)
Find an estimate of the mean and an estimate of the standard deviation of the daily electricity use.
[3]3 marks
Markscheme (b)(ii)
attempt to use mid-interval values 2.5,7.5,12.5,…(M1)
mean =13.5 (kWh) (13.48)A1
standard deviation =5.93 (kWh) (5.92786…)A1
(c)
Estimate the number of households in the town that use at least 20 kWh per day.
[2]2 marks
Markscheme (c)
25026+8×6400(M1)
=870 (households) (870.4)A1
(d)
The company contacts 12 households in the town, chosen at random. Assume that the proportion of all households in the town with solar panels is the same as the proportion in the sample. Find the probability that at least 3 of the 12 households have solar panels.
[3]3 marks
Markscheme (d)
recognition of binomial distribution with n=12 and p=25048=0.192(M1)
P(X≥3)=1−P(X≤2)(M1)
=0.413(0.413185…)A1
(e)
State one assumption required for the model used in part (d).
[1]1 mark
Markscheme (e)
whether a household has solar panels is independent of the other households (OR the probability is the same, 0.192, for each household contacted) R1
(f)
An employee suggests that it would have been quicker to survey the 250 households that live closest to the company's office. Give two reasons why this would be likely to give less reliable estimates than the random sample.
[2]2 marks
Markscheme (f)
it is a convenience sample, so not every household has an equal chance of being chosen R1
households in one area are likely to be similar to each other (e.g. similar house types or incomes), so the sample may not represent the whole town R1
Note: Accept other valid reasons referring to the context.
Question 2 · AA-004157 marks
Each time Kemal takes a free throw in basketball, the probability that he scores is 0.72, independently of all other free throws.
In a training session, Kemal takes 12 free throws. Let X be the number of free throws he scores.
(a)
Find P(X≥8).
[2]2 marks
(b)
Given that Kemal scores at least 8 free throws, find the probability that he scores exactly 10.
[3]3 marks
(c)
Kemal scores with each of his first two free throws. Find the probability that he scores at least 8 of the 12 free throws.
The lifetimes, T hours, of a brand of rechargeable battery are normally distributed with mean 40 hours and standard deviation σ hours. It is known that 10% of these batteries have a lifetime of less than 37 hours.
(a)
Show that σ=2.341, correct to four significant figures.
[3]3 marks
(b)
Find the probability that a randomly selected battery has a lifetime of more than 44 hours.
[2]2 marks
(c)
A battery has already lasted 42 hours. Find the probability that its lifetime is more than 45 hours.
[3]3 marks
(d)
Find the probability that at least 7 of the batteries in a randomly selected pack have a lifetime of at least 37 hours.
[3]3 marks
(e)
Given that at least one battery in a pack has a lifetime of less than 37 hours, find the probability that exactly two batteries in the pack have a lifetime of less than 37 hours.
(b) No. The number of trials is not fixed in advance: X counts trials, not successes.
(c) No. Without replacement, the probability of a heart changes from card to card (it is 5213 for the first card, but 5112 for the second if the first was a heart), so the trials are not independent and p is not constant.
(d) Yes, assuming the guesses are independent and each is correct with probability 41: X∼B(20,0.25).
(e) No. Each roll has six outcomes and X is a total of scores, not a count of successes.
(b) Use the complement of "no successes":
P(X≥1)=1−P(X=0)=1−(32)4=1−8116=8165
.
0.859
0.882
0.901
0.917
Since 0<p<1, both p and (1−p)3 are non-zero, so you can divide by 5p(1−p)3: