5.1 Limits and the derivative · IB Maths AA | Augment Education
5.1 Limits and the derivative
Estimate limits from tables and graphs, find the gradient of a curve as the limit of chord gradients, and interpret the derivative as a gradient function and a rate of change with units.
IB Mathematics: Analysis and Approaches
Part of 5 Calculus
SL and HL
Key terms introduced here
Each is in the Maths AA glossary, with every other term in the subject.
The change in a function divided by the change in its input over an interval, b−af(b)−f(a): the gradient of the chord joining the two points on the graph.
The rate of change of a function at a single value of its input: the limit of the average rate of change over smaller and smaller intervals, equal to the derivative and to the gradient of the tangent.
The value L that f(x) gets as close as you like to as x gets closer and closer to a (without being equal to a), written limx→af(x)=L. The value of f(a) itself does not affect the limit.
How fast one quantity changes compared with another, measured in units of the first quantity per unit of the second (for example metres per second). On a graph it is a gradient.
The straight line that touches a curve at a point and has the same gradient as the curve there. It is the limit of chords through that point as the second point moves towards it.
,
dxdy
and others such as
drdV
correctly.
Estimate the gradient of a curve at a point numerically, from a graph and with a GDC.
Interpret a derivative in context, including its sign and its units.
Calculus is the mathematics of change. Many quantities change at a rate that is itself changing: a falling stone speeds up, the level of carbon dioxide in the atmosphere rises faster each decade, and the number of people using a new app grows quickly and then levels off. A straight line has one gradient everywhere, but a curve is steeper in some places than in others. Differential calculus answers the question "how steep is the curve at this exact point?", or, in a context, "how fast is this quantity changing at this exact moment?"
The answer rests on the idea of a limit: the value that a quantity approaches as something else gets closer and closer to a fixed value. Using limits, the gradient of a curve at a point is defined as the value that the gradients of nearby chords approach. The result is the derivative, the central object of the rest of Topic 5.
Rates of change
Measuring how fast a quantity changes
A rate of change compares how much one quantity changes with how much another quantity changes at the same time. Speed is the most familiar example: a car that travels 150 km in 2 hours has an average speed of 75 km per hour. Many other rates appear in science, economics and daily life, such as litres per minute for water flowing into a tank, dollars per item for the cost of producing goods, and degrees Celsius per hour for a cooling drink.
When y is plotted against x, a rate of change is a gradient. For a straight line the rate is constant, because the gradient is the same everywhere. For a curve the rate changes from point to point, which is why a new tool is needed.
The average rate of change
Over an interval from x=a to x=b, the change in the function is f(b)−f(a) and the change in the input is b−a. Dividing one by the other gives the average rate of change over the interval.
A chord of a curve is a straight line segment joining two points on it. The average rate of change describes the overall change between the two points, but it hides what happens in between: a car with an average speed of 75 km per hour may have stopped at traffic lights and then driven at 100 km per hour.
Year
1960
1970
1980
1990
2000
2010
2020
CO₂ concentration (ppm)
316.91
325.68
338.76
354.45
369.71
390.10
414.21
The table gives the annual mean concentration of carbon dioxide in the atmosphere, measured at the Mauna Loa Observatory in Hawaii, in parts per million (ppm). (Data: NOAA Global Monitoring Laboratory, Mauna Loa annual mean CO₂, 2025 release.)
The idea of a limit
Approaching a value
Consider the function
f(x)=x−2x2−4
Substituting x=2 gives 00, which has no value, so f(2) is not defined. The function is defined for every other value of x, however, and the values of f(x) for x close to 2 follow a clear pattern.
x
1.9
1.99
1.999
2
2.001
2.01
2.1
f(x)
3.9
3.99
3.999
undefined
4.001
4.01
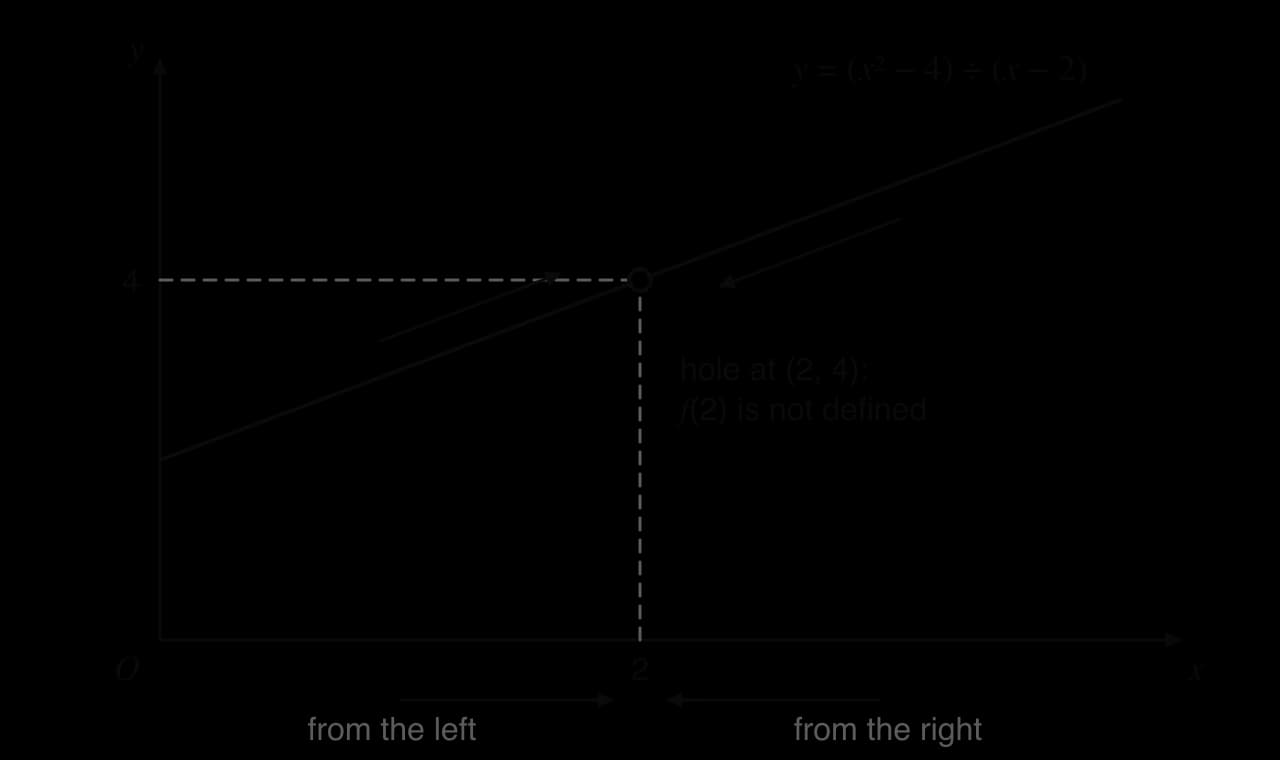
As x gets closer to 2, from either side, f(x) gets closer to 4. The value 4 is the limit of f(x) as x tends to 2. The reason is visible after factorising: for x=2,
f(x)=x−2(x−2)(x+2)=x+2
so the graph is the straight line y=x+2 with a single point missing at (2,4).
The limit as x tends to 2 is 4: points on the graph close to x = 2, on both sides, have y-values close to 4, even though there is no point at x = 2 itself.
Two features of the definition matter. First, x approaches a but never equals it, so the value of f(a), or whether f(a) exists at all, makes no difference to the limit. Second, x can approach a from values less than a (from the left) and from values greater than a (from the right). For the limit to exist, both approaches must lead to the same value.
For most familiar functions, such as polynomials, the limit as x→a is simply f(a), because the graph has no breaks or holes. For example, limx→3(x2+1)=10. Limits become interesting, and necessary, exactly when direct substitution fails, which is what happens when the gradient of a curve is found.
Estimating a limit from a table
When a limit cannot be found by simplifying, a table of values gives a good estimate. Choose values of x that get steadily closer to a from both sides, such as a±0.1, a±0.01 and a±0.001, and look for the value that f(x) settles on.
A table gives strong evidence for a limit, but it is not a proof: it only shows a few values. The algebraic methods of later subtopics confirm limits exactly. In practice a table is a reliable way to estimate a limit, especially with a GDC.
Limits that do not exist
Not every function has a limit at every point. If the values of f(x) grow without bound, or approach different values from the two sides, there is no limit.
Limits also describe what happens as x grows without bound, written x→∞. For example, x1→0 as x→∞, which is the horizontal asymptote y=0 of the reciprocal function (2.8). The sum to infinity of a geometric series in 1.8 is a limit of the same kind: S∞ is the value that Sn approaches as n→∞.
From chords to tangents
The gradient of a curve at a point
A curve has no single gradient, but at each point it has a direction. The straight line that just touches the curve at a point, going in the same direction as the curve there, is the tangent at that point. The gradient of the curve at the point is defined to be the gradient of this tangent.
A tangent can cross the curve somewhere else, and at some points it even crosses the curve at P itself, so "touches the curve at one point only" is not a correct description. What matters is that, very close to P, the curve and the tangent are almost indistinguishable. Zooming in on a smooth curve at any point makes it look more and more like a straight line, and that line is the tangent.
Chord gradients tending to the tangent gradient
The gradient of a tangent cannot be calculated directly from the gradient formula, because only one point on it, P, is known. The way round this is to take a second point Q on the curve, find the gradient of the chord PQ, and then move Q closer and closer to P. As Q approaches P, the chord turns towards the tangent, and its gradient approaches the gradient of the tangent.
y = x²
chord PQ₁, gradient 3
chord PQ₂, gradient 2.5
tangent at P, gradient 2
As Q moves along the curve towards P, the chord PQ becomes less steep and gets closer to the tangent at P. The chord gradients 3 and 2.5 are approaching the tangent gradient 2.
For the curve y=x2 and the point P(1,1), take Q(x,x2). The gradient of the chord PQ is
x−1x2−1
which cannot be evaluated at x=1, because it gives 00. This is exactly a limit problem: the gradient of the tangent is
x→1limx−1x2−1
The general chord
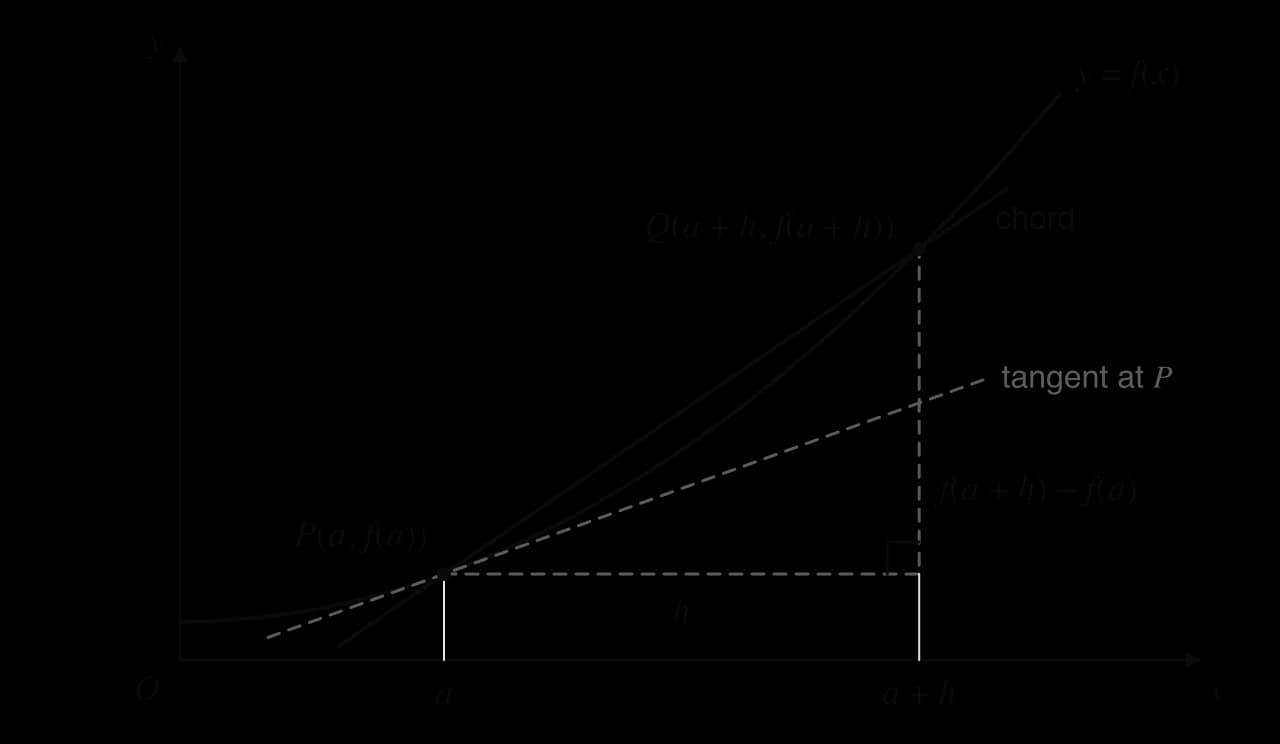
The same method works at any point on any smooth curve. Let P be the point (a,f(a)), and let Q be a second point a small horizontal distance h away, at (a+h,f(a+h)). The run from P to Q is h, and the rise is f(a+h)−f(a).
The chord gradient is the rise f(a + h) − f(a) divided by the run h. As h shrinks to 0, Q slides down the curve to P and the chord turns into the tangent at P.
The gradient of the chord is
hf(a+h)−f(a)
and the gradient of the curve at P is the limit of this as h→0. Here h may be positive (Q to the right of P) or negative (Q to the left). Using this limit algebraically, called differentiation from first principles, is part of 5.12 (HL); at this stage the limit is estimated numerically, and from 5.3 onwards it is found with rules.
YouTube
Watch how the derivative is built from a tiny change in the input and the resulting change in the output, and why the limit is needed to make "the rate of change at an instant" precise.
The derivative
The gradient function
Repeating the chord method at other points on y=x2 gives the gradient of the curve at each of them.
x
−2
−1
0
1
2
3
Gradient of y=x2
−4
−2
0
2
The gradient at each point is twice the x-coordinate. The gradient of y=x2 is therefore given by a new function, 2x. This function is called the gradient function, or the derivative, of x2.
y = x²
gradient function y = 2x
Where y = x² slopes downwards (x < 0) the gradient function is negative; at the bottom of the curve it is 0; where the curve slopes upwards it is positive and grows as the curve steepens.
The two graphs are different representations of the same information. At x=−2 the parabola is falling steeply and the gradient function has the value −4; at x=0 the parabola is momentarily flat and the gradient function is 0; at x=1.5 the parabola is rising and the gradient function is 3. How the shape of a graph is related to the sign of its derivative is developed in 5.2.
Notation for the derivative
There are two main notations, and both are used throughout the course.
Notation
Read as
Meaning
f′(x)
"f dash of x" or "f prime of x"
The derivative of the function f
dxdy
"d y by d x"
The derivative of y
f′(3)
"f dash of 3"
The gradient of y=f(x)
dxdyx=3
drdV, dtds
The notation dxdy, due to Leibniz, recalls how the derivative is made: dy suggests a very small change in y and dx a very small change in x. It is a single symbol, not a fraction, so the ds cannot be cancelled. Its advantage is that it names both variables, which matters when the variables are not x and y: for the volume V of a sphere of radius r, the rate of change of volume with respect to radius is drdV.
Instantaneous rate of change
The gradient of a chord is an average rate of change, and the gradient of the tangent is its limit. In a context, the derivative is therefore the instantaneous rate of change: the rate at a single moment, or at a single value of the input. A car's speedometer shows instantaneous speed, the derivative of distance with respect to time, while dividing the length of a journey by its time gives only the average speed.
Estimating gradients numerically
From a formula: chords on one side or both sides
The chord method gives estimates of a gradient that improve as h gets smaller. A chord from a to a+h lies to one side of the point. A better estimate, for the same value of h, uses a chord with one end on each side of the point, from a−h to a+h:
f′(a)≈2hf(a+h)−f(a−h)
On a curve that bends, the one-sided chord is too steep on one side and not steep enough on the other, and the central chord balances the two errors.
From real data
When a quantity is known only from data, a gradient can still be estimated with a chord between neighbouring data points, preferably one on each side of the point of interest. The annual mean carbon dioxide concentration at Mauna Loa was 411.65 ppm in 2019 and 416.41 ppm in 2021 (NOAA). The central chord estimate for the rate of increase in 2020 is
2021−2019416.41−411.65=2.38 ppm per year
compared with an average rate of 0.877 ppm per year over 1960–1970. The estimate is only as good as the data: a measurement error of a few hundredths of a ppm would barely change it, but data recorded every ten years would give a much rougher value.
From a graph
To estimate the gradient of a curve at a point from its graph, draw the tangent at the point by eye with a ruler, then pick two points on the tangent that are far apart and easy to read. The gradient of the tangent, rise divided by run, estimates the gradient of the curve.
y = 8/x
tangent at P
The tangent at P crosses the axes at (0, 8) and (4, 0), two points that are easy to read.
A tangent drawn by eye is only approximate, so an estimate from a graph is usually good to one or two significant figures. Choosing points on the tangent that are far apart reduces the effect of reading errors.
With a GDC
A graphic display calculator (GDC) estimates the gradient of a curve at a point numerically, using a very small central chord. On a graph screen, a "derivative at a point" (often written dxdy) option traces the curve and shows the gradient; in calculations, a numerical derivative function takes the function, the variable and the value of x. The answer is a decimal approximation, normally accurate to many significant figures.
Rates of change in context
Units of a derivative
In a context, dxdy is measured in units of y per unit of x, just like an average rate of change. Reading the units from the variables is the first step in interpreting any derivative.
Derivative
Variables
Units
Meaning
dtds
s in metres, t in seconds
m s⁻¹
Velocity (5.9)
dtdV
V in litres, t in minutes
litres per minute
Rate of flow into or out of a container
dxdC
C in dollars, x items
dollars per item
Approximate cost of producing one more item (marginal cost)
dtdP
P people, t in years
people per year
Population growth rate
drdV
V in cm³, r in cm
cm³ per cm
How fast volume grows as the radius increases
For a sphere, V=34πr3. A central chord at r=3 cm with h=0.001 gives drdV≈113.1 cm³ per cm, which is 36π, the surface area of the sphere. Increasing the radius by a small amount adds a thin shell to the sphere whose volume is about the surface area times the thickness, which is why the two match.
Interpreting the sign and the size
The sign of a derivative shows the direction of change and its size shows how fast the change happens.
dxdy>0: y is increasing as x increases.
dxdy<0: y is decreasing as x increases.
dxdy=0: y is momentarily not changing.
A larger value of dxdy
Exam-style questions on limits and the derivative
The second question is set in a context and uses a GDC.
Self-check
To do:
I can estimate limx→af(x) from a table of values on both sides of a and from a graph.
To do:
I can explain why a function can have a limit at a point where it is not defined, and recognise limits that do not exist.
To do:
I can find the average rate of change of a function over an interval as the gradient of a chord, with units.
To do:
I can explain how chord gradients tend to the gradient of the tangent, and use a table of chord gradients to estimate a gradient.
To do:
I can describe the derivative as the gradient function and as an instantaneous rate of change.
To do:
I can use and read the notations f′(x), f′(a), dxdy
To do:
I can estimate the gradient of a curve at a point from a graph, from a central chord and with a GDC.
To do:
I can interpret the sign, size and units of a derivative in context.
lies on the curve.
The point Q(1+h,21+h), where h>0, also lies on the curve. The gradient of the chord [PQ] is m.
The following table shows some values of h and the corresponding values of m, correct to five significant figures.
h
1
0.1
0.01
0.001
m
2.0000
1.4355
p
q
(a)
Use your GDC to find p and q.
[2]2 marks
Markscheme (a)
attempt to substitute h=0.01 or h=0.001 into m=h21+h−2(M1)
p=1.3911, q=1.3868A1
Note: Accept p=1.39 and q=1.39, or more accurate values (1.39111…, 1.38677…).
(b)
Hence write down an estimate for the gradient of the tangent to the curve at P.
[1]1 mark
Markscheme (b)
1.39 (accept 1.386 or 1.387) A1
Note: Award A1 for any value between 1.386 and 1.390 inclusive that follows the trend in the table.
(c)
Use your answer to part (b) to find the equation of the tangent to the curve at P. Give your answer in the form y=ax+b.
[2]2 marks
Markscheme (c)
attempt to substitute (1,2) and their gradient into the equation of a straight line (M1)
y−2=1.39(x−1)
Question 2 · AA-006385 marks
Let f(x)=xsin3x, for −π≤x≤π, x=0, where x is in radians.
The following diagram shows the graph of f.
(a)
Use the graph to write down an estimate of x→0limf(x).
. The values grow without bound, so the limit does not exist. The graph has a
vertical asymptote
at
x=0
, with both branches going up. This is sometimes written
x21→∞
, but
∞
is not a number, so there is no limit.
(b) From the right, x1 grows without bound (10,100,1000,…); from the left, it decreases without bound (−10,−100,−1000,…). There is no limit.
(c) For x>1, ∣x−1∣=x−1, so the expression equals 1. For x<1, ∣x−1∣=−(x−1), so the expression equals −1. The values approach 1 from the right and −1 from the left. They do not approach a single value, so the limit does not exist.
.
x at Q
2
1.5
1.1
1.01
1.001
Q
(2,4)
(1.5,2.25)
(1.1,1.21)
(1.01,1.0201)
Chord gradient
13=3
0.51.25=2.5
(b) With Q to the left of P:
x at Q
0.9
0.99
0.999
Chord gradient
0.9−10.81−1=1.9
0.99−10.9801−1=1.99
0.999−10.998001−1=1.999
(c) From the right the chord gradients decrease towards 2, and from the left they increase towards 2. The gradient of the curve at P is 2.
The tables also show a pattern: when Q has x=1+h, the chord gradient is 2+h. As h→0, this tends to 2.
4
6
with respect to
x
at
x=3
, a number
"d y by d x at x=3"
The same number in the second notation
,
dxdC
"d V by d r", and so on
The rate of change of V with respect to r, of s with respect to t, and so on
and
0.001
.
m.
average speed=3−244.1−19.6=24.5 m s−1
(b) Average speed =h4.9(2+h)2−19.6.
h
0.5
0.1
0.01
0.001
Average speed (m s⁻¹)
22.05
20.09
19.649
19.6049
For example, with h=0.1: s(2.1)=4.9×4.41=21.609, so the average speed is 0.121.609−19.6=20.09 m s⁻¹.
(c) The average speeds approach 19.6, so the speed at t=2 is 19.6 m s⁻¹. In derivative notation,
dtdst=2=19.6 m s−1
The average speed over the first full second after t=2, 24.5 m s⁻¹, is larger because the stone keeps speeding up.
−0.1
h2h−1
0.717735
0.695555
0.693387
0.692907
0.690750
0.669670
The gradient of the curve at P is −2. It is negative because the curve is going down from left to right at P: as x increases past 2, y decreases, at first by about 2 units for each unit of x.
Check with a central chord: 0.028/2.01−8/1.99=0.023.980099−4.020101=−2.00005, which agrees.
. The GDC gives
dxdyx=4=0.8
A check with a central chord: 0.0024.0012+9−3.9992+9=0.8000…. (The exact value, 54, can be found with the chain rule in 5.6.)
means a faster change.
12
litres per minute.
is
3.003001
. Find the value of
p
. [2]
as given (M1 for the gradient formula with these values). Every step towards the given answer must be shown.
(b) 1.013=1.030301, so
p=0.011.030301−1=0.010.030301=3.0301
(c) The chord gradients approach 3, so f′(1)=3.
(d) A half-turn about the origin maps P(1,1) to (−1,−1) and maps the tangent at P to the tangent at (−1,−1). A half-turn maps a line to a parallel line, so the two tangents have the same gradient: f′(−1)=3.
(keep the full value on the GDC).
10−0N(10)−N(0)=1014536.71…−1000=1353.67…≈1350 downloads per day
(c) Using the numerical derivative on the GDC, N′(10)=3093.11…≈3090. Ten days after the launch, the total number of downloads is increasing at a rate of about 3090 downloads per day.
(d) N′(20)=1448.61…≈1450 downloads per day. By day 20 about 44600 of the 50000 downloads predicted by the model have happened, so there are fewer new users left to download the app and the rate of downloading has slowed down.
and
drdV
.
y=1.39x+0.61 (accept y=1.386x+0.614) A1FT
Note: Follow through from their answer to part (b).
y = f(x)
Find the value of f(0.01).
[1]1 mark
(c)
Hence, by choosing a suitable value of x, find an estimate for sin0.06.
 YouTube