Notes on 6.2 Environmental risks
Learning objectives
Define transboundary pollution and explain how pollutants move from a source to receptors in other countries by air, water, ocean currents and food chains.
Explain why transboundary pollution is difficult to manage, and evaluate agreements, national laws, litigation, technology and monitoring as responses.
Describe the localised environmental impacts of global flows along shipping lanes, in ports and around airports.
Analyse the carbon footprints of global flows of food, goods and people, distinguishing food miles from life-cycle assessment.
Examine the pollution haven hypothesis and the evidence for and against it, using polluting manufacturing industries and shipbreaking.
Explain the environmental impacts of food production systems for global agribusiness, including monoculture and deforestation for palm oil and soy.
Evaluate responses to the environmental risks of agribusiness, including certification, moratoria and import regulation.
Examine the causes, consequences and responses of the Southeast Asian haze as a transboundary pollution case study.
Discuss how global interactions affect the physical environment to different degrees at different scales.
Introduction
Global interactions move goods, food, people and money between places, and they also move pollution and environmental damage. Smoke from fires lit to clear land in Indonesia closes schools in Malaysia, oil from a ship on its way to Brazil coats the reefs of Mauritius, and the demand of shoppers in Europe and China for cheap leather or palm oil shapes rivers and forests thousands of kilometres away. These environmental risks fall on particular places and people, often far from the consumers and companies whose decisions created them.
The topic is mainly about place and process. Process explains how a pollutant travels: on prevailing winds, down a river, through the food chain or in the hold of a ship. Place explains why the same flow causes severe harm in one location and little in another, because of local physical conditions, the strength of regulation and the vulnerability of the people exposed. Power matters too: the places that suffer most from a flow are rarely the ones that control it.
How global interactions create environmental risk
Globalisation has lengthened the distance between where things are produced and where they are consumed. A pair of leather shoes may combine hides tanned in Bangladesh, rubber from Thailand and glue made in China, assembled in Vietnam and sold in Germany. Each link in this supply chain uses energy and materials and produces waste, and each takes place under a different government with different environmental rules.
Environmental risk in this context is the likelihood that a global flow will damage the physical environment and the people who depend on it. The risk depends on three things: the size of the hazard (how much pollution or land clearance the flow causes), the exposure of places and ecosystems to it, and the vulnerability of the people affected. A fishing community on a reef coast with no other income is far more vulnerable to an oil spill than a city with a diversified economy, even if both are equally exposed.
Global interactions create environmental risk in three broad ways:
Pollution that crosses borders. A pollutant released in one country travels to others through the air, rivers or the ocean, so the people harmed have no control over the source.
Pollution along the flows themselves. Ships, aircraft and trucks pollute the routes and ports they use and emit greenhouse gases, so the movement of goods, food and people has its own environmental cost.
Pollution where production has moved. The global shift of manufacturing and the growth of export farming have relocated polluting industries and land clearance to places with lower costs and, often, weaker enforcement.
These risks operate at every scale. Effluent from one tannery harms one stretch of river; smoke from millions of hectares of burning peat harms six countries; carbon dioxide from shipping and aviation adds to global climate change. The scale of an impact shapes who can respond to it: a local problem can be fixed by a local authority, but a global one needs action by many states at once.
Transboundary pollution
What makes pollution transboundary
Most pollution stays close to its source, but some pollutants are carried long distances before they settle. When they cross an international border, the country that receives them has to deal with damage it did not cause and cannot regulate. This is transboundary pollution (TBP).
Geographers analyse TBP with the source–pathway–receptor model. The source is where the pollutant is released, such as a smelter chimney, a burning peatland or a leaking ship. The pathway is the route by which it travels: prevailing winds, a river flowing across a border, an ocean current or a food chain. The receptor is what is harmed: people’s lungs, a lake, a fishery, a crop or a whole economy. Breaking any link in the chain reduces the harm, which is why the model is also used to plan responses.
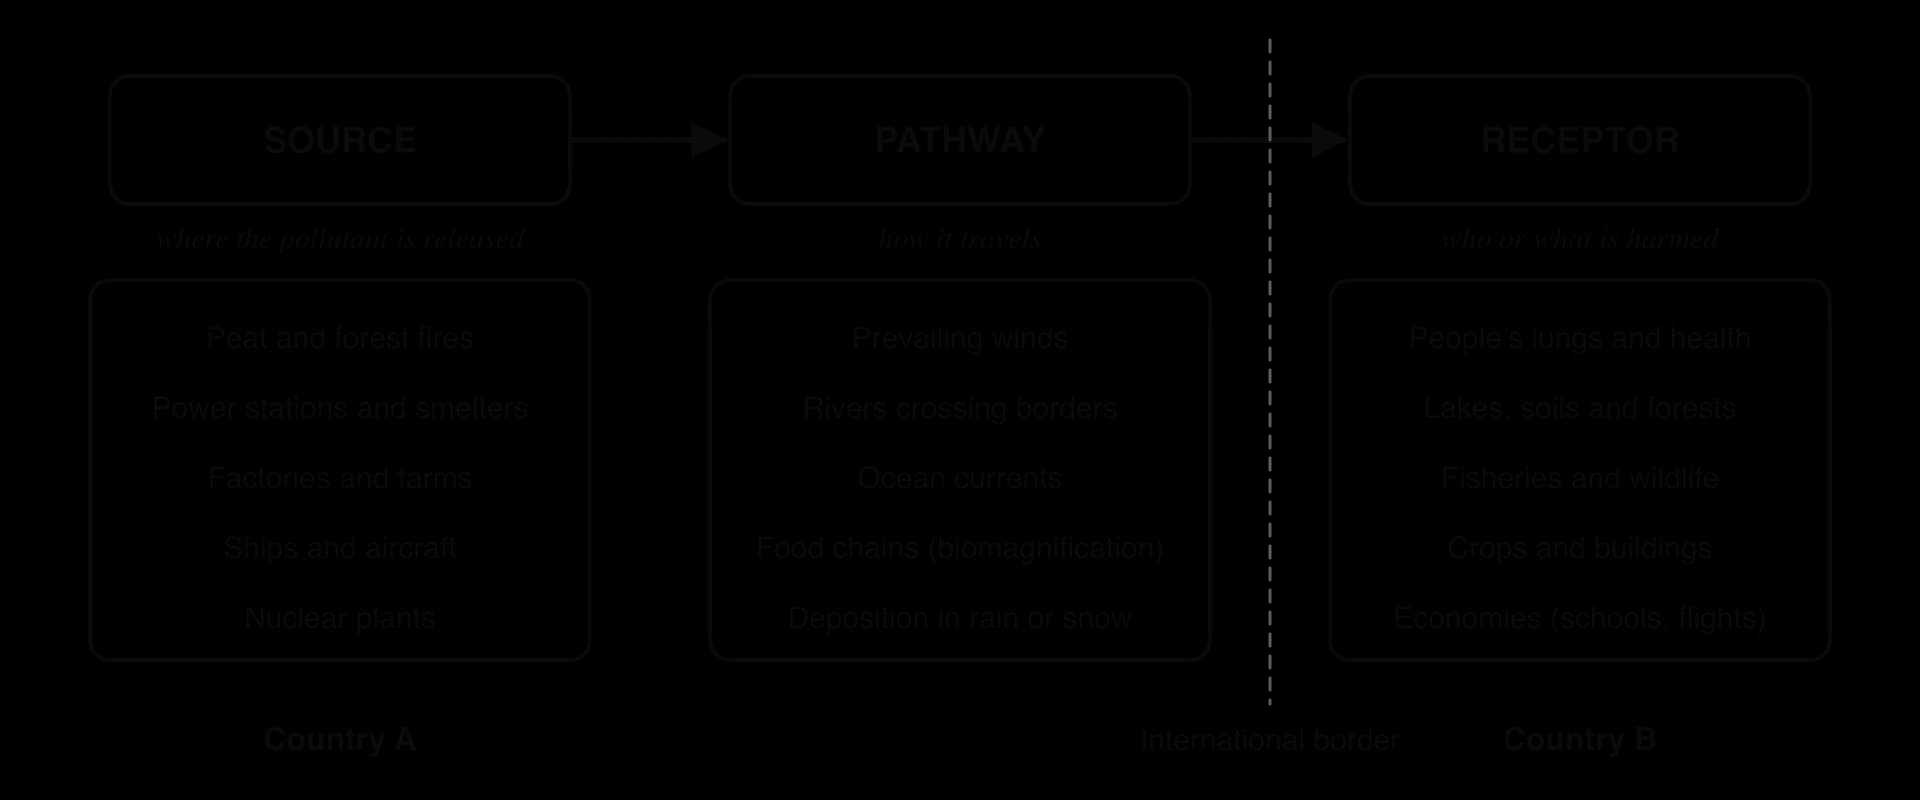
The model shows why TBP is a political as well as an environmental problem. The source lies under the authority of one government, while the receptors lie under another. The receiving country can protect its own people at the receptor end, for example by issuing health warnings, but it cannot shut down the source without the cooperation of the country where it lies.
Air pathways
Air is the fastest and most widespread pathway. Pollutants released high into the atmosphere can be carried hundreds or thousands of kilometres in a few days by the prevailing winds, and they are deposited wherever the air sinks or rain washes them out.
Acid rain
Acid rain forms when sulphur dioxide (SO₂) and nitrogen oxides (NOₓ), released mainly by burning coal and oil in power stations, smelters, vehicles and ships, react with water vapour in the atmosphere to form sulphuric and nitric acids. These fall to the ground in rain, snow and fog (wet deposition) or as dry particles and gases (dry deposition), often far downwind of the source.
Acid rain became the classic example of TBP in Europe in the 1960s and 1970s, when Scandinavian scientists linked the acidification of lakes and the loss of fish in Norway and Sweden to emissions from power stations in the United Kingdom and central Europe, carried north-east on the prevailing south-westerly winds.
The response was the first international agreement on air pollution, the Convention on Long-Range Transboundary Air Pollution, opened for signature in 1979. It now has 51 parties and eight protocols, including the 1985 Helsinki Protocol on sulphur emissions and the 1999 Gothenburg Protocol on acidification and ground-level ozone. Sulphur emissions in Europe have since fallen sharply as coal use has declined and power stations have fitted scrubbers.
Smoke, haze and particulates
Fires produce smoke made of fine particles, carbon monoxide and other gases. Particulate matter smaller than 2.5 micrometres across (PM2.5) is the most harmful component, because it penetrates deep into the lungs and enters the bloodstream. When smoke spreads over a wide area and mixes with other pollutants, it forms haze, a layer of polluted air that reduces visibility and harms health for weeks.
Smoke can cross borders even between high-income countries. During the 2023 wildfire season in Canada, smoke from fires in Quebec was carried south into the north-eastern United States, and on 7 June 2023 the air quality index in New York City rose above 400, in the “hazardous” range. The episode showed that wealth does not prevent exposure to TBP, although it gives people more ways to protect themselves, such as air filters and indoor workplaces.
Radioactive fallout
Radioactive particles released by a nuclear accident can also travel across borders. The Chernobyl disaster in Ukraine in 1986 spread fallout across much of Europe, and the 2011 Fukushima Daiichi accident in Japan released radioactive material into the air and sea. Because radioactive pollution is invisible and long-lasting, it causes fear and political tension out of proportion to the measured doses in many receiving countries.
Water and ocean pathways
Rivers carry pollution downstream across borders. In January 2000, a dam holding cyanide-contaminated waste failed at a gold mine at Baia Mare in Romania, and the cyanide flowed into the Tisza River and then the Danube, killing fish in Hungary and Serbia hundreds of kilometres downstream. Upstream countries have power over downstream ones because they control what enters the river (the management of shared rivers and water quality is part of the study of freshwater).
Ocean currents carry floating pollution, such as plastic debris and oil, between coasts. Treated water released into the sea from the damaged Fukushima Daiichi plant since August 2023 has become a contested case. Japan and the International Atomic Energy Agency state that the diluted water meets international safety standards, while China suspended all imports of Japanese seafood from 24 August 2023, and fishing communities in Japan and South Korea feared damage to their markets. The dispute shows that the perceived risk of TBP can have economic effects even when scientists judge the physical risk to be low.
Long-range pollutants and the Arctic
Some chemicals are so stable that they travel around the world. Persistent organic pollutants (POPs) include pesticides such as DDT, industrial chemicals such as polychlorinated biphenyls (PCBs) and newer substances such as PFOS, used in non-stick and water-repellent products. They resist breakdown, dissolve in fat rather than water, and are toxic in small amounts.
POPs reach the Arctic by a process sometimes called the “grasshopper effect” (global distillation). In warm regions they evaporate, travel on the wind, condense and fall in cooler places, and then evaporate again, moving towards the poles in a series of hops. In the cold Arctic they stop evaporating and stay. There they accumulate in fat and become more concentrated at each step up the food chain, from plankton to fish to seals, whales and polar bears. Inuit and other Arctic peoples whose traditional diet includes marine mammals therefore carry some of the highest body burdens of chemicals that were never produced or used in their homeland.
The Stockholm Convention on Persistent Organic Pollutants (signed in 2001, in force since 2004, with 186 parties in 2022) bans or restricts the listed chemicals. It allows DDT only for controlling the mosquitoes that spread malaria, and it has added newer chemicals such as PFOS (2009) and PFOA (2019). The United States is not a party.
Pathway | Pollutant | Example | Main receptors |
|---|---|---|---|
Air (regional) | Sulphur dioxide and nitrogen oxides as acid rain | UK and central European emissions falling on Scandinavia, 1960s–1980s | Lakes, fish, soils, forests |
Air (regional) | Smoke and PM2.5 as haze | Indonesian peat fires, 2015 and 2019; Canadian wildfire smoke over New York, 2023 | Human health, schools, aviation, tourism |
Air (continental) | Radioactive fallout | Chernobyl, 1986; Fukushima Daiichi, 2011 | Farmland, food, public health |
River | Cyanide and heavy metals | Baia Mare spill into the Tisza and Danube, 2000 | Fish, drinking water, downstream states |
Ocean | Treated radioactive water; plastics; oil | Fukushima treated-water release from 2023 | Fisheries, seafood trade |
Air, water and food chains (global) | Persistent organic pollutants | PCBs and pesticides accumulating in the Arctic | Marine mammals, Inuit and other Arctic peoples |
Why transboundary pollution is hard to manage
TBP is harder to manage than pollution within one country for five linked reasons.
Sovereignty. Each state has authority over its own territory and decisions, its sovereignty. A receiving country cannot inspect, fine or close a polluting source in another state without that state’s consent, and the source country may see outside pressure as interference in its internal affairs.
Proof of source. It is often difficult to prove where a pollutant came from and who is responsible. Smoke from thousands of fires mixes in the air, and companies blame smallholders, who blame companies.
Costs and benefits fall in different places. The source country gains the benefits of the polluting activity (jobs, exports, cheap land clearing) while the receiving country bears many of the costs, so the source country has weak incentives to act.
Unequal power. A large source country may have more economic or political power than a small receiving country, or the reverse; either way, the stronger party can resist demands.
Time lags and uncertainty. Some pollutants, such as POPs and acid deposition, cause damage slowly, so the link between cause and effect may only become clear decades later, after the harm is done.
Responses to transboundary pollution
Responses can act at the source, along the pathway or at the receptor, and they range from international treaties to individual choices.
International and regional agreements. States agree to cut emissions or cooperate on monitoring. Besides the Convention on Long-Range Transboundary Air Pollution (1979) and the Stockholm Convention (2001), the ASEAN Agreement on Transboundary Haze Pollution was signed by the members of the Association of Southeast Asian Nations in 2002. Indonesia, the main source country, was the last to ratify it, in September 2014.
National laws with reach beyond borders. Singapore’s Transboundary Haze Pollution Act 2014 makes it an offence for any company, local or foreign, to cause or contribute to haze in Singapore, with fines of up to S$100,000 a day, capped at S$2 million.
Litigation. Governments, citizens and NGOs take polluters to court, at home or abroad, to win compensation and change behaviour.
Technology. Scrubbers that remove SO₂ from power-station chimneys, cleaner fuels and fire-fighting equipment reduce emissions at the source.
Monitoring by satellite. Satellites detect fire hotspots, smoke plumes, oil slicks and ship tracks, which helps to identify sources and provides evidence for enforcement and diplomacy.
Protection at the receptor. Health warnings, masks, air purifiers and school closures reduce exposure without touching the source.
Response | Strengths | Limitations |
|---|---|---|
International agreement (CLRTAP, ASEAN haze agreement) | Builds shared rules, data and trust; can cover a whole region | Often non-binding or without penalties; depends on the willingness of source states; slow to negotiate |
National law with reach beyond borders (Singapore 2014) | Gives the receiving country a legal tool; names and shames companies | Hard to gather evidence or enforce abroad; source states may see it as a challenge to sovereignty |
Litigation | Can win compensation and set precedents | Expensive and slow; harder across borders; weaker communities may lack lawyers |
Technology (scrubbers, cleaner fuels) | Directly cuts emissions; proven for acid rain | Costly; may move pollution elsewhere (for example into wastewater) |
Satellite monitoring | Cheap per area covered; independent evidence | Shows where, not who; clouds and smoke can hide sources |
Protection at the receptor (warnings, masks) | Fast and under the receiving state’s control | Treats symptoms only; unequal access for poorer people |
Experience suggests that responses work best when the source country gains from acting as well as the receiving country. European acid rain fell because cutting sulphur also suited the source countries as they moved away from coal, not only because of the 1979 convention. Where the polluting activity brings large profits to powerful groups in the source country, as with land clearing in Indonesia, agreements and foreign laws achieve much less unless they are matched by enforcement at the source.
Sources: UNECE, Convention on Long-Range Transboundary Air Pollution; Stockholm Convention secretariat; ASEAN; Singapore Transboundary Haze Pollution Act 2014 (all via Wikipedia, accessed 2026); Wikipedia, “2023 Canadian wildfires” (accessed 2026), for the New York air quality index.
Localised pollution along global flows
About four-fifths of world trade by volume travels by sea, and the growth of containerisation (moving goods in standard steel boxes that transfer directly between ships, trains and trucks) has made shipping cheap enough to move almost anything across the world. Ships follow a network of busy routes between the world’s major ports, and the pollution they cause is concentrated along these shipping lanes and in the ports where they load and unload.
The busiest lanes pass through narrow straits and canals, such as the Strait of Malacca between Malaysia and Sumatra, the English Channel and the Suez Canal. In these places a few hundred kilometres of water carry tens of thousands of ships a year, so the coasts beside them are highly exposed to accidents. The environmental impacts of ships are of several kinds, above and below the waterline.
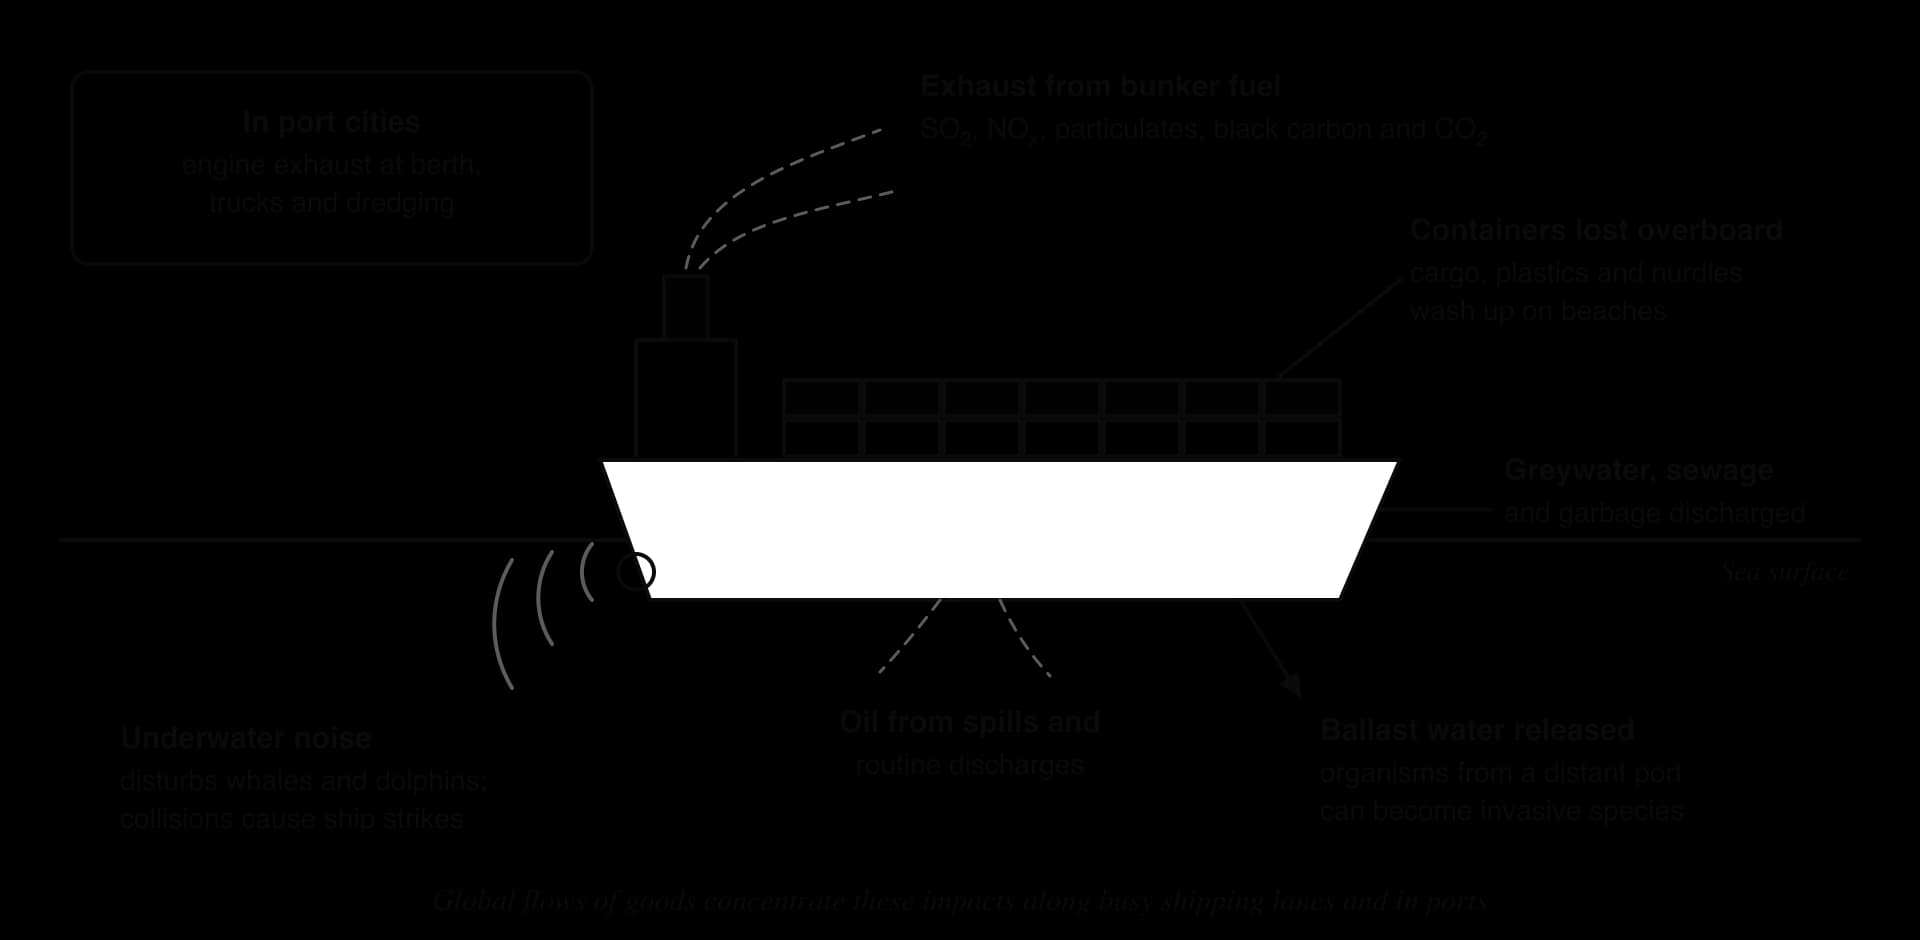
Oil spills
An oil spill is the release of oil into the sea from a ship, pipeline or offshore platform; ocean management and the largest spills from drilling are part of the study of oceans. Along shipping lanes most oil pollution comes not from famous disasters but from routine operational discharges, such as washing out tanks or releasing oily bilge water, which add up to a much larger total than accidents.
Accidents still cause severe local damage, especially near sensitive coasts. On 25 July 2020 the bulk carrier MV Wakashio, registered in Panama, owned by an affiliate of Nagashiki Shipping and operated by the Japanese company Mitsui O.S.K. Lines, ran aground on a coral reef off Pointe d’Esny in south-east Mauritius. It was sailing without cargo, but about 1,000 tonnes of its fuel oil leaked from 6 August, spreading over about 27 km² of lagoon close to the Blue Bay Marine Park and a wetland of international importance (a Ramsar site).
Mangroves, seagrass and corals were damaged, the government declared an environmental emergency, and large protests took place in Port Louis over the slow response.
The Wakashio spill illustrates the geography of shipping risk. The ship was owned in Japan, registered in Panama and crewed by sailors from other countries, but the damage fell on a small island state whose economy depends on tourism and fishing. Mitsui O.S.K. Lines pledged about ¥1 billion (about US$9.4 million) to environmental projects, while Mauritius sought further compensation, a sum small compared with the losses to fishing and tourism.
Lost cargo and plastic pellets
Containers fall overboard in storms, and fires on ships can release their whole cargo. A growing concern is the loss of nurdles, the small plastic pellets that are the raw material for almost all plastic products and are shipped in huge quantities from petrochemical plants to factories.
The largest recorded plastic spill came from the container ship X-Press Pearl, registered in Singapore. A container of nitric acid on board had been leaking since it was loaded in Jebel Ali (United Arab Emirates), and ports in Qatar and India refused to offload it. The ship caught fire on 20 May 2021 about 9.5 nautical miles north-west of Colombo, Sri Lanka, and sank on 2 June. A UN assessment estimated that 70–75 billion nurdles were released. They covered beaches along the west coast, fishing was banned between Kalutara and Negombo, affecting about 5,600 boats, and dead turtles and dolphins washed ashore.
Responsibility for the X-Press Pearl remains contested. In July 2025 Sri Lanka’s Supreme Court ordered the operator, X-Press Feeders, to pay US$1 billion in compensation; the company refused, arguing that international limits on shipowners’ liability capped its responsibility at about US$25 million, and in January 2026 the court ended the proceedings while the parties sought a settlement. The case shows how the international rules that make shipping cheap can also limit what a coastal state recovers when a ship damages its environment.
Ballast water and invasive species
A ship that has unloaded its cargo rides high in the water and becomes unstable, so it pumps sea water into tanks to keep it balanced. This ballast water is taken on in one port and released in another, often on a different continent, together with the plankton, larvae, bacteria and small animals it contains.
Most organisms die on the voyage, but a few survive and establish themselves in their new home, where they have no natural predators. They become invasive species when they spread and harm native ecosystems or human activities.
Zebra mussels, small freshwater molluscs from the Black Sea and Caspian region, reached Lake St Clair in North America in 1988 in the ballast water of a transatlantic freighter. They spread through all five Great Lakes, clogging the intake pipes of power stations and water treatment plants and altering the lakes’ food webs.
The US Fish and Wildlife Service estimated the cost of the introduction at about US$5 billion. Ballast water can also carry disease: the bacterium that causes cholera is thought to have reached Peru in ballast water in 1991, at the start of an epidemic that killed more than 10,000 people in Latin America over the following three years.
The International Maritime Organization (IMO) adopted the Ballast Water Management Convention in 2004, and it came into force on 8 September 2017. Ships must now exchange their ballast water far out at sea (at least 200 nautical miles from shore, in water at least 200 m deep), where coastal species cannot survive, or treat it on board to kill organisms before discharge.
Bunker fuel and air pollution
Large ships burn bunker fuel, a heavy, cheap residue left after lighter fuels have been refined from crude oil. It contains much more sulphur than road fuel, so ship exhaust adds sulphur dioxide, nitrogen oxides, soot (black carbon) and fine particles to the air along shipping lanes and in port cities. Shipping produces about 18–30% of global nitrogen oxide emissions.
From 1 January 2020 the IMO cut the maximum sulphur content of marine fuel from 3.5% to 0.5% outside special Emission Control Areas, where the limit is 0.1%. The change, known as IMO 2020, is estimated to prevent over 100,000 early deaths a year in coastal and port areas. Some shipowners chose to keep burning high-sulphur fuel and fit exhaust “scrubbers” that wash the sulphur out with sea water, which moves part of the pollution from the air into the sea.
Cleaner ship exhaust also has a side effect on climate: sulphate particles had been brightening clouds over the oceans and reflecting sunlight, so removing them slightly reduces this cooling effect (a process studied in the causes of climate change).
Port cities bear much of this pollution. Ships keep their engines running at berth to power their systems, and ports attract heavy truck traffic. Some ports now provide shore power, so that ships can plug into the electricity grid instead of burning fuel while they are docked.
Noise, collisions and aviation’s local impacts
Sound travels far underwater, and the noise of propellers and engines has raised background noise in the oceans. Whales and dolphins use sound to find their way, find food and communicate, so noise can disturb their behaviour, and ships moving fast along busy lanes collide with whales; ship strikes are a major threat to the endangered North Atlantic right whale off the east coast of North America.
Aviation has local impacts around airports as well as global ones. Aircraft noise disrupts sleep, can affect children’s performance at school and may raise the risk of heart disease among people living under flight paths. Airports add nitrogen oxides and particles to the local air, and de-icing fluids and fuel spills can pollute nearby streams. Because land near airports is often cheaper, the people most exposed are frequently lower-income households.
Carbon footprints of global flows
Every global flow uses energy, and most of that energy still comes from fossil fuels. A carbon footprint measures the greenhouse gases emitted by a product, activity, person or organisation, in tonnes of CO₂-equivalent (t CO₂e). The footprint of a flow of food, goods or people depends on the distance, the mode of transport, the load carried and the emissions at every other stage of production.
Shipping and aviation at the global scale
Shipping produces about 3% of global greenhouse gas emissions. Commercial aviation produced about 2.4% of global CO₂ emissions in 2018, but its total effect on warming is larger, about 3.5% of the human influence on the climate (effective radiative forcing), because aircraft also produce contrails and nitrogen oxides at high altitude. Both sectors are growing, and both are hard to decarbonise because ships and aircraft need dense, portable fuels.
Emissions from international shipping and aviation are not counted in any country’s national emissions total, because it is unclear which country should be responsible for a ship registered in Panama, owned in Greece, carrying Chinese goods to Germany. This gap in accounting leaves the two sectors to be regulated by their own international bodies, the IMO and the International Civil Aviation Organization (ICAO), whose members include both exporting and importing countries with very different interests.
Food: food miles and life-cycle assessment
Food miles are the distance food travels from where it is grown to where it is eaten, a measure popularised in the United Kingdom in the 1990s. The idea suggests that local food is better for the climate than imported food. However, distance is only one part of a food’s footprint, and often a small one.
A life-cycle assessment (LCA) measures the environmental impact of a product over its whole life: land use change, farming, animal feed, processing, transport, packaging, retail and waste. For most foods, LCAs show that transport is a small share of the total, so the environmental risk of global food flows depends less on the distance travelled than on the mode of transport.
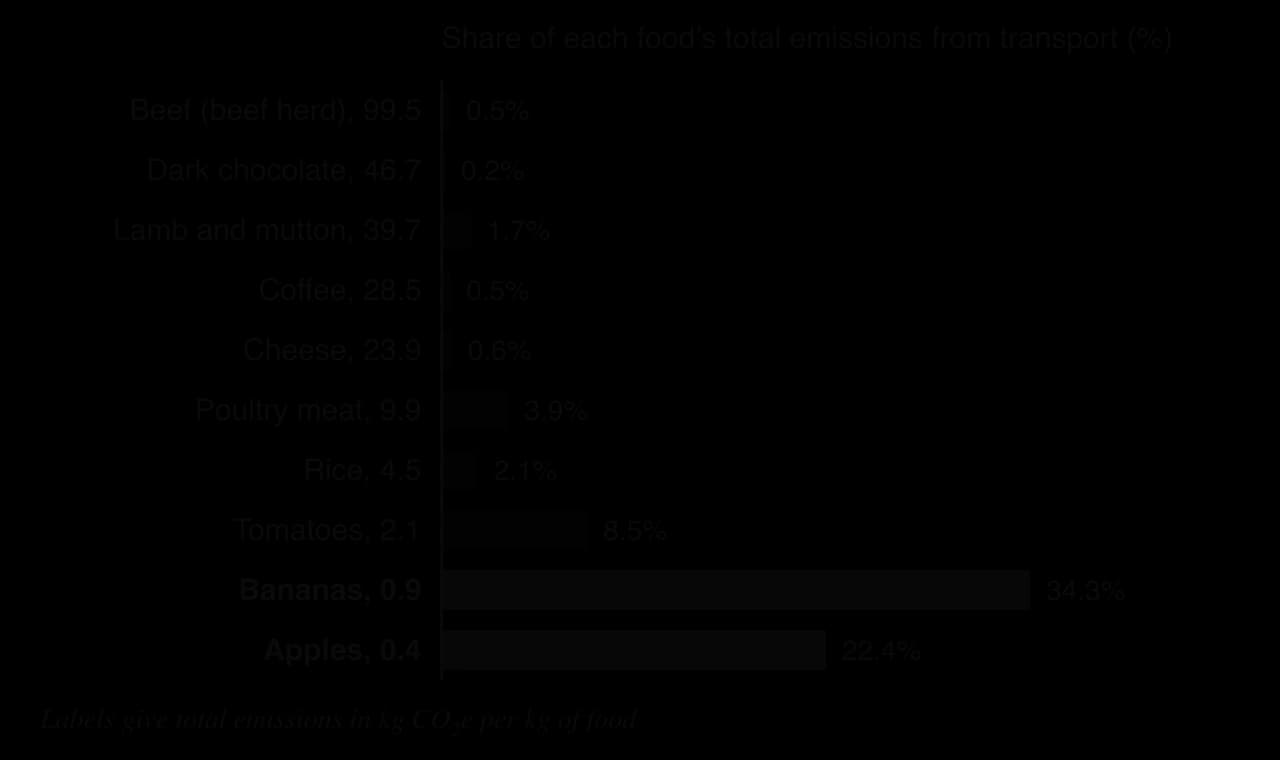
The chart shows that a kilogram of beef from a beef herd emits about 99.5 kg CO₂e, of which only 0.5% comes from transport; most comes from land clearance, methane from cattle and feed. A kilogram of bananas emits less than 1 kg CO₂e, so even though transport is a third of its footprint, the absolute amount is small. Globally, transport makes up about 6% of food’s greenhouse gas emissions in this dataset.
The mode of transport is the exception. Temperature-controlled sea freight emits about 23 g CO₂e per tonne-kilometre, while air freight emits about 1,130 g, roughly 50 times as much. Only about 0.16% of food tonne-kilometres travel by air, but they are concentrated in fresh, perishable produce such as asparagus, green beans and berries. Air-freighted food is therefore the one case where food miles matter greatly.
A life-cycle assessment can also show a flown product with a lower footprint than one grown nearby. A 2007 study compared 12,000 cut roses grown in Kenya and flown to the United Kingdom with the same number grown in heated and lit greenhouses in the Netherlands. The Kenyan roses emitted about 6,000 kg CO₂ including the flight, against about 35,000 kg for the Dutch roses, because Kenya’s sunshine and warm highland climate replace the gas and electricity used to heat and light Dutch greenhouses, and yields per hectare are higher.
The Kenyan figure includes an allowance for the extra warming effect of emissions released at altitude, and the study was commissioned by a flower importer. Critics also point to the water used by flower farms around Lake Naivasha. LCAs therefore rest on choices about what to include, which is why two honest studies of the same product can reach different results.
Goods: emissions embedded in trade
Manufactured goods carry embedded emissions: the greenhouse gases released in making them, wherever that happened. When a smartphone assembled in China is bought in the United States, the emissions from its factory are counted in China’s national total, not in the American consumer’s. Consumption-based accounting reassigns these emissions to the country where the goods are used. For the transport of goods, the main point is that the shipping leg is usually small compared with production, unless goods travel by air, as many electronics, flowers and fashion items do.
People: tourism, migration and commuting
Flows of people have footprints too. International tourism depends on aviation, so the carbon footprint of a holiday is dominated by the flights. Labour migrants and their families make return journeys, and global business relies on frequent flying, often by a small share of travellers who fly many times a year. Within cities, commuting by private car is the largest flow.
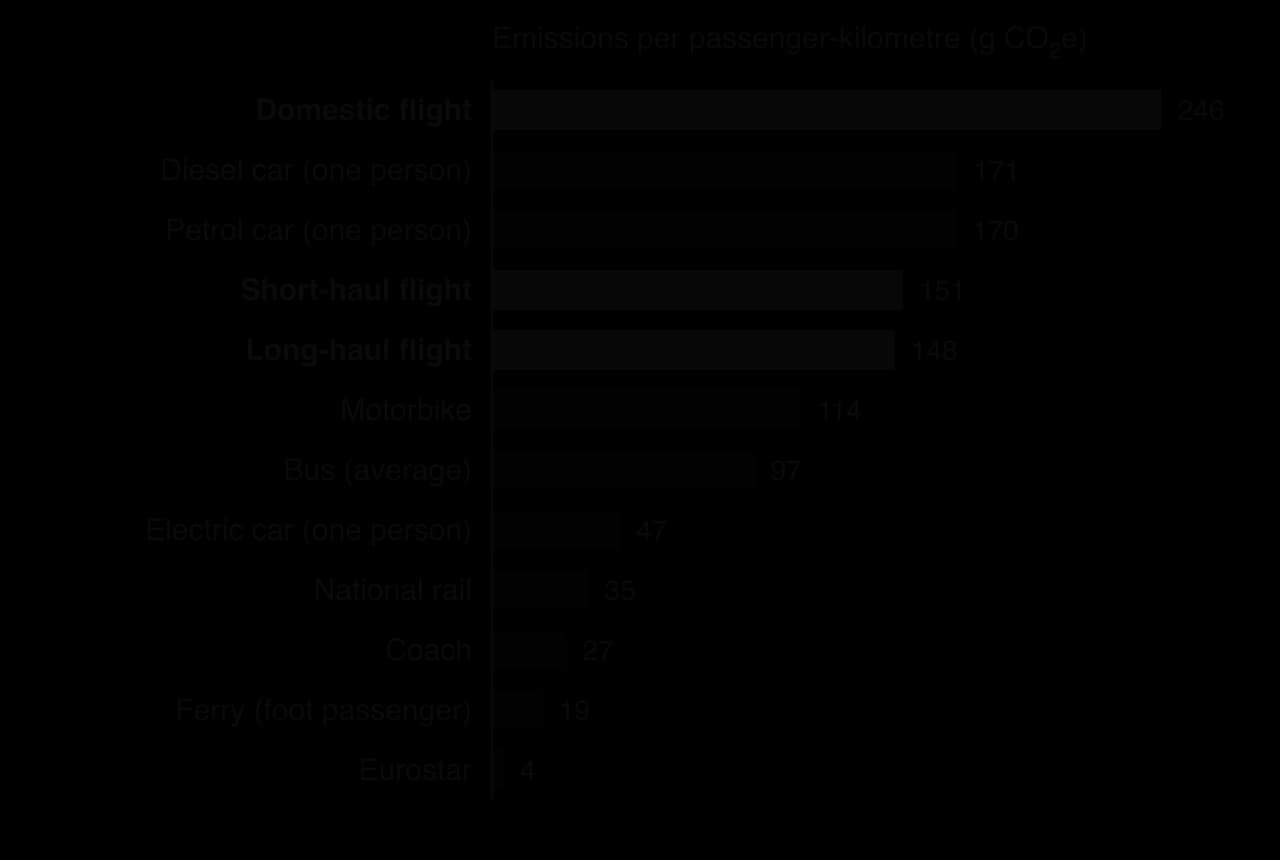
The chart shows that the choice of mode changes the footprint of the same journey many times over. Long-haul flights emit slightly less per kilometre than short-haul ones, because take-off uses a large share of the fuel, but they cover far greater distances, so one return flight between Europe and East Asia can emit more than a year of car commuting.
Responses to the footprint of global flows
The IMO’s revised greenhouse gas strategy, adopted in 2023, aims for net-zero emissions from international shipping by or around 2050, with indicative checkpoints of at least a 20% cut by 2030 and at least 70% by 2040 compared with 2008.
A proposed global carbon price for shipping, the IMO Net-Zero Framework, faced opposition from some governments, including the United States, and in October 2025 member states voted to postpone its adoption by a year.
For aviation, ICAO agreed in 2022 to support a net-zero target for 2050, and its Carbon Offsetting and Reduction Scheme for International Aviation (CORSIA) requires airlines to offset growth in emissions on international routes, voluntarily until 2026 and compulsorily from 2027. Sustainable aviation fuel, made from waste oils, crops or captured carbon, made up only about 0.2% of jet fuel used in 2023 and costs two to four times as much as fossil kerosene.
Response | Sector | Strengths | Limitations |
|---|---|---|---|
IMO 2023 strategy (net zero by about 2050) | Shipping | Global, covers all ships whatever their flag | Targets are indicative; the carbon price was postponed in 2025 |
IMO 2020 sulphur cap | Shipping (air quality) | Clear, enforced, large health benefits | Scrubbers move pollution into the sea; slight loss of cooling from aerosols |
CORSIA offsetting | Aviation | First global scheme for a whole sector | Offsets growth only; the quality of carbon offsetting credits is disputed |
Sustainable aviation fuel | Aviation | Works in existing aircraft | About 0.2% of fuel in 2023; expensive; crop-based fuels compete with food |
Eating less beef; avoiding air-freighted food | Food | Large cuts at low cost to the consumer | Depends on millions of individual choices; affects farmers’ incomes |
Rail instead of short flights | People | Large cuts per journey | Only possible where fast rail exists; little help for intercontinental travel |
The global responses share one weakness: they are negotiated by bodies in which every state has a voice, and the states whose economies depend on cheap transport, fossil fuels or tourism can slow them down. Measures that also bring local benefits, such as cleaner air in port cities, have advanced faster than those whose benefits are only global and long-term.
Sources: IMO and ICAO via Wikipedia, “Environmental impact of shipping”, “Environmental impact of aviation”, “IMO 2020”, “Ballast water discharge and the environment”, “MV Wakashio oil spill” and “X-Press Pearl” (accessed 2026); Our World in Data, article on food choice and local food (Poore and Nemecek, 2018); A. Williams, Comparative Study of Cut Roses for the British Market Produced in Kenya and the Netherlands, Cranfield University, 2007.
The global shift of industry and its environmental costs
Since the 1970s, much manufacturing has moved from high-income countries (HICs) in Europe, North America and Japan to middle-income countries (MICs) and low-income countries (LICs) in Asia and Latin America. This global shift happened mainly because labour and land were cheaper, but transnational corporations (TNCs) and their suppliers also found that environmental rules were weaker or less strictly enforced in many of the new locations. Polluting stages of production, such as dyeing, tanning, smelting and dismantling, moved with the rest.
The pollution haven hypothesis
The pollution haven hypothesis proposes that polluting industries relocate to places with weaker environmental regulation, so that trade and investment shift pollution from rich countries to poorer ones. If it holds, environmental standards become a factor of location in the same way as wages.
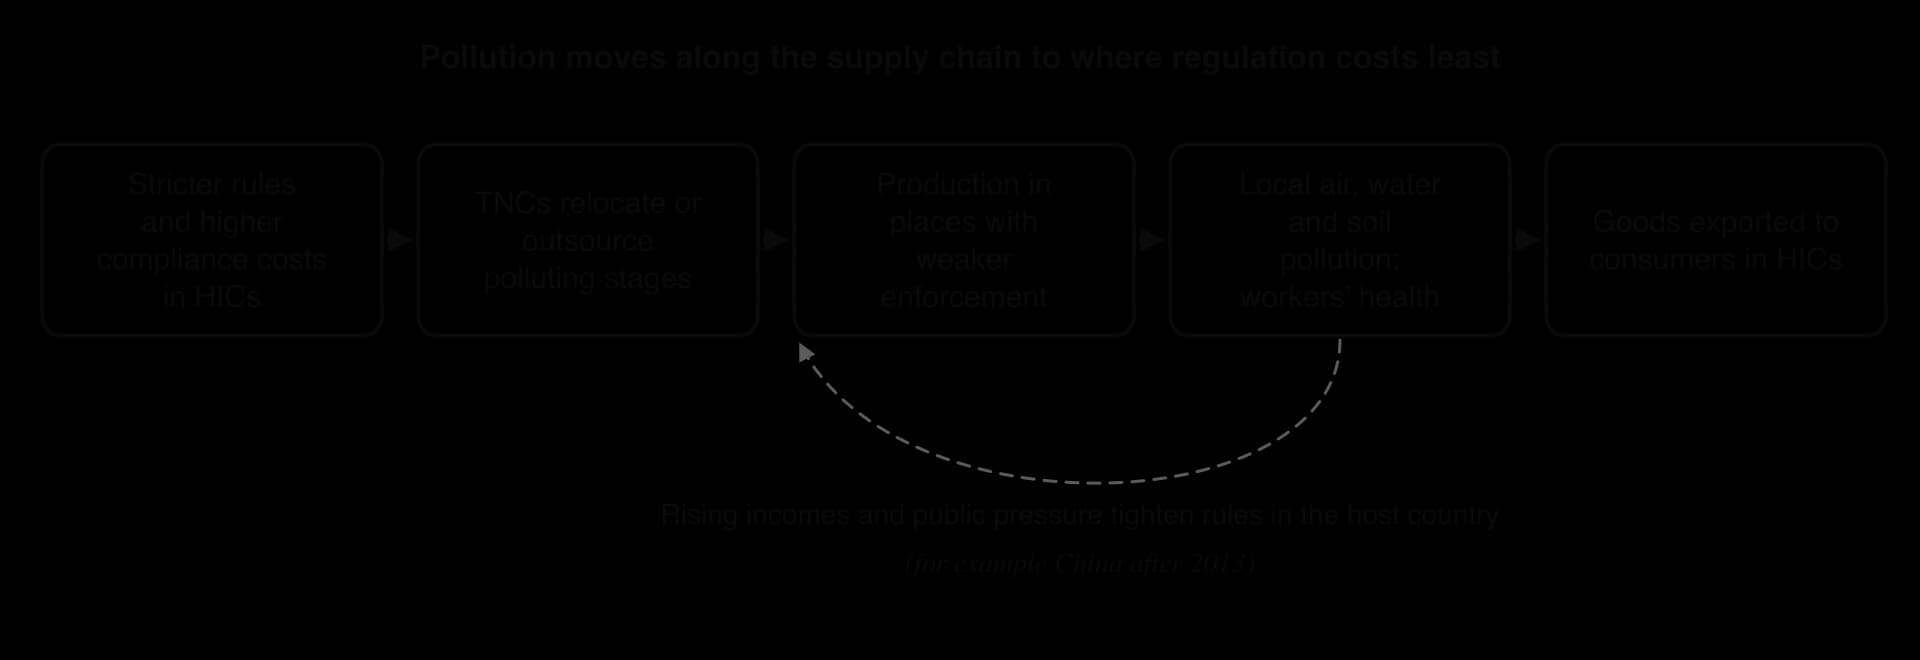
The chain in the diagram is logical, but the evidence is mixed. Economists distinguish three versions of the hypothesis, from weak to strong:
Weak: the cost of controlling pollution affects decisions about trade and investment at the margin. There is broad evidence for this.
Moderate: the cost is large enough to change trade and investment flows measurably. Some studies support this for the most polluting industries.
Strong: governments deliberately keep standards low to attract investment, causing a “race to the bottom”. There is little general evidence for this.
Evidence for the hypothesis includes particular cases. After the United States tightened its standard for airborne lead in 2009, exports of used lead-acid car batteries to Mexico for recycling rose about fourfold, and a study found more babies born with low birth weight near Mexican recycling plants. Informal e-waste processing in places such as Guiyu in southern China contaminated water with lead (the export of e-waste is part of the study of waste flows).
Evidence against it is also strong. For most industries, pollution control is a small share of total costs compared with wages, market access, infrastructure and the skills of the workforce. Large TNCs often use the same technology everywhere, because it is cheaper to run one standard and because their brands are exposed to criticism; some studies find that the worst polluters in lower-income countries are small local firms rather than foreign ones. Factor endowments matter too: heavy, polluting industries such as steel and chemicals are attracted to places with cheap energy and raw materials, whatever the rules.
Strengths of the hypothesis | Limitations of the hypothesis |
|---|---|
Explains clear cases such as lead-battery recycling in Mexico, e-waste processing and shipbreaking on South Asian beaches | Environmental compliance is a small share of costs for most industries, so wages and markets dominate location decisions |
Highlights equity: poorer communities can bear the pollution created by richer consumers | Large TNCs often apply similar standards everywhere; small local firms may pollute more |
Helps explain why consumption-based emissions of HICs are higher than their territorial emissions | Regulation is hard to measure, so studies disagree about how strong the effect is |
Links to the environmental Kuznets curve: pollution rises with early industrialisation, then falls as incomes and demand for clean air grow | Host countries can and do tighten rules (China since 2013), so havens are often temporary |
A balanced judgment is that pollution havens exist for particular industries and stages of production, especially labour-intensive, highly polluting and lightly regulated activities such as tanning, dyeing, battery recycling and shipbreaking, but that environmental rules are rarely the main reason a whole industry moves. The hypothesis is most useful as a way of asking who bears the environmental cost of a supply chain.
Polluting manufacturing: leather tanning in Hazaribagh
Leather tanning turns animal hides into leather using large amounts of water and chemicals, including chromium salts, sodium sulphide and acids. Hazaribagh, a district of Dhaka in Bangladesh beside the Buriganga River, held about 90–95% of the country’s tanneries, about 150 by Human Rights Watch’s 2012 estimate. None had an effluent treatment plant, and the government estimated that they released about 21,600 m³ (21.6 million litres) of untreated effluent into the river system every day. One effluent sample contained 3,324 mg of chromium per litre against a Bangladeshi standard of 2 mg per litre.
Between 8,000 and 15,000 people worked in the tanneries, some of them children, often without protective equipment, and workers reported skin diseases, respiratory illness and injuries. About 80% of the leather was exported, mainly to China, South Korea, Japan, Italy, Germany, Spain and the United States, bringing about US$663 million in 2011–12.
The case shows the pollution haven chain clearly: consumers in HICs buy cheap leather goods, while the river, soils and workers of Dhaka absorb the environmental cost. After years of missed deadlines, most tanneries were moved in 2017 to a new industrial estate at Savar, about 20 km from Hazaribagh, but environmental groups report that the estate’s central treatment plant has not treated all its effluent, so part of the problem moved with the industry.
Shipbreaking
When a ship reaches the end of its working life, usually after 25–30 years, it is sold for scrap. Shipbreaking is now concentrated on a few beaches in South Asia: Alang in Gujarat (India), Chittagong (Bangladesh) and Gadani (Pakistan).
The beaching method is cheap: ships are run aground at high tide and cut up by hand on the sand between the tides. Oil, asbestos, polychlorinated biphenyls (PCBs) and heavy metals leak onto the beach and into the sea, and accidents are frequent; a Bangladeshi watchdog group estimates that one worker dies every week and one is injured every day. The industry is also valuable to the host countries: recycled steel supplies about 20% of Bangladesh’s steel needs and almost 10% of India’s, and the yards of India, Bangladesh, China and Pakistan employ about 225,000 people.
Shipbreaking shows how global rules can follow global flows. European owners control about 40% of the world fleet, but only about 7% of ships flagged in the European Union are dismantled within it, because owners can sell a ship to a cash buyer who reflags it before its last voyage. The EU’s Ship Recycling Regulation has applied since 2018 to EU-flagged ships, and the IMO’s Hong Kong Convention, adopted in 2009, finally entered into force in June 2025. Critics argue that the convention still allows beaching, while shipowners and South Asian governments argue that upgraded yards, such as many at Alang, now meet acceptable standards.
China’s “war on pollution”
China became the “workshop of the world” in the 2000s, and its cities suffered some of the worst air pollution on Earth. In 2013 the government issued an air pollution action plan, and in March 2014 Premier Li Keqiang declared a “war on pollution”. Coal-fired boilers were closed or converted to gas, the most polluting factories were shut or moved away from cities, emission standards were tightened and monitoring was published in real time. The population-weighted mean PM2.5 exposure in China fell from 51.75 µg m⁻³ in 2013 to 31.99 µg m⁻³ in 2023, still well above the World Health Organization’s guideline of 5 µg m⁻³.
The Chinese case complicates the pollution haven hypothesis. Rising incomes and public anger at smog led a host country to tighten its rules, which is the feedback shown in the diagram. Some polluting, low-value production has since moved on to other countries, such as Vietnam and Bangladesh, which suggests that havens move as countries develop rather than disappearing.
Food production systems for global agribusiness
The second part of the global shift concerns food. Much of the world’s food now comes from agribusiness: large-scale, capital-intensive commercial farming and food processing, integrated along the supply chain and often controlled or financed by TNCs (food systems and their stakeholders are studied in detail in the food and health option). Agribusiness produces cheap food, animal feed, vegetable oils and biofuels for global markets, but it concentrates its environmental impacts on the regions where the crops are grown.
Agribusiness relies on monoculture, the growing of a single crop over a large area, because it allows machinery, inputs and harvesting to be standardised and costs to be cut.
Monocultures have several environmental costs. They replace diverse ecosystems with a single species, so wildlife loses habitat and food. They exhaust particular soil nutrients, so farmers apply more fertiliser, and they are vulnerable to pests and diseases that spread easily through identical plants, so farmers spray more pesticides. Run-off of fertiliser causes eutrophication of rivers and coastal waters, and irrigation for export crops can draw down rivers and aquifers. The largest impact is often the land clearance that comes first: deforestation, the permanent removal of forest for other land uses, which is the main source of the land-use emissions in the food chart.
Palm oil in Indonesia and Malaysia
Palm oil is the world’s most-produced vegetable oil. It is used in a wide range of packaged foods and household products, from margarine and biscuits to shampoo and lipstick, and as a biofuel. It is also a very efficient crop, producing more oil per hectare than any alternative, which is one reason demand has grown so fast.
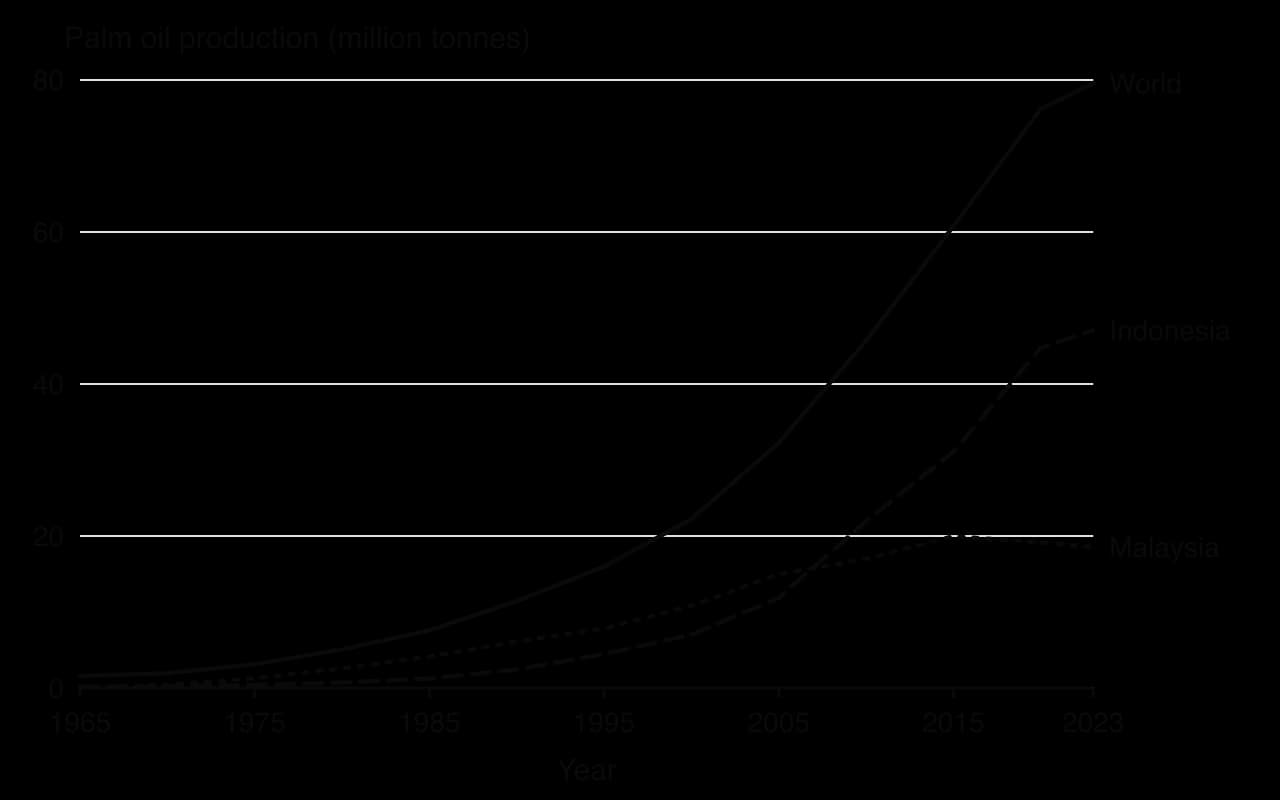
The chart shows that Indonesia’s production grew about 19.5 times between 1990 and 2023, from 2.4 to 47.1 million tonnes, while Malaysia’s levelled off after about 2015 as land suitable for new plantations ran short. Plantations in Indonesia cover at least 12 million hectares, and 96% of production comes from Sumatra and Borneo. Smallholders own about two-fifths of the planted area, and the sector supports about 16 million jobs. Much of the oil is exported, with China and India together buying more than a third of global imports.
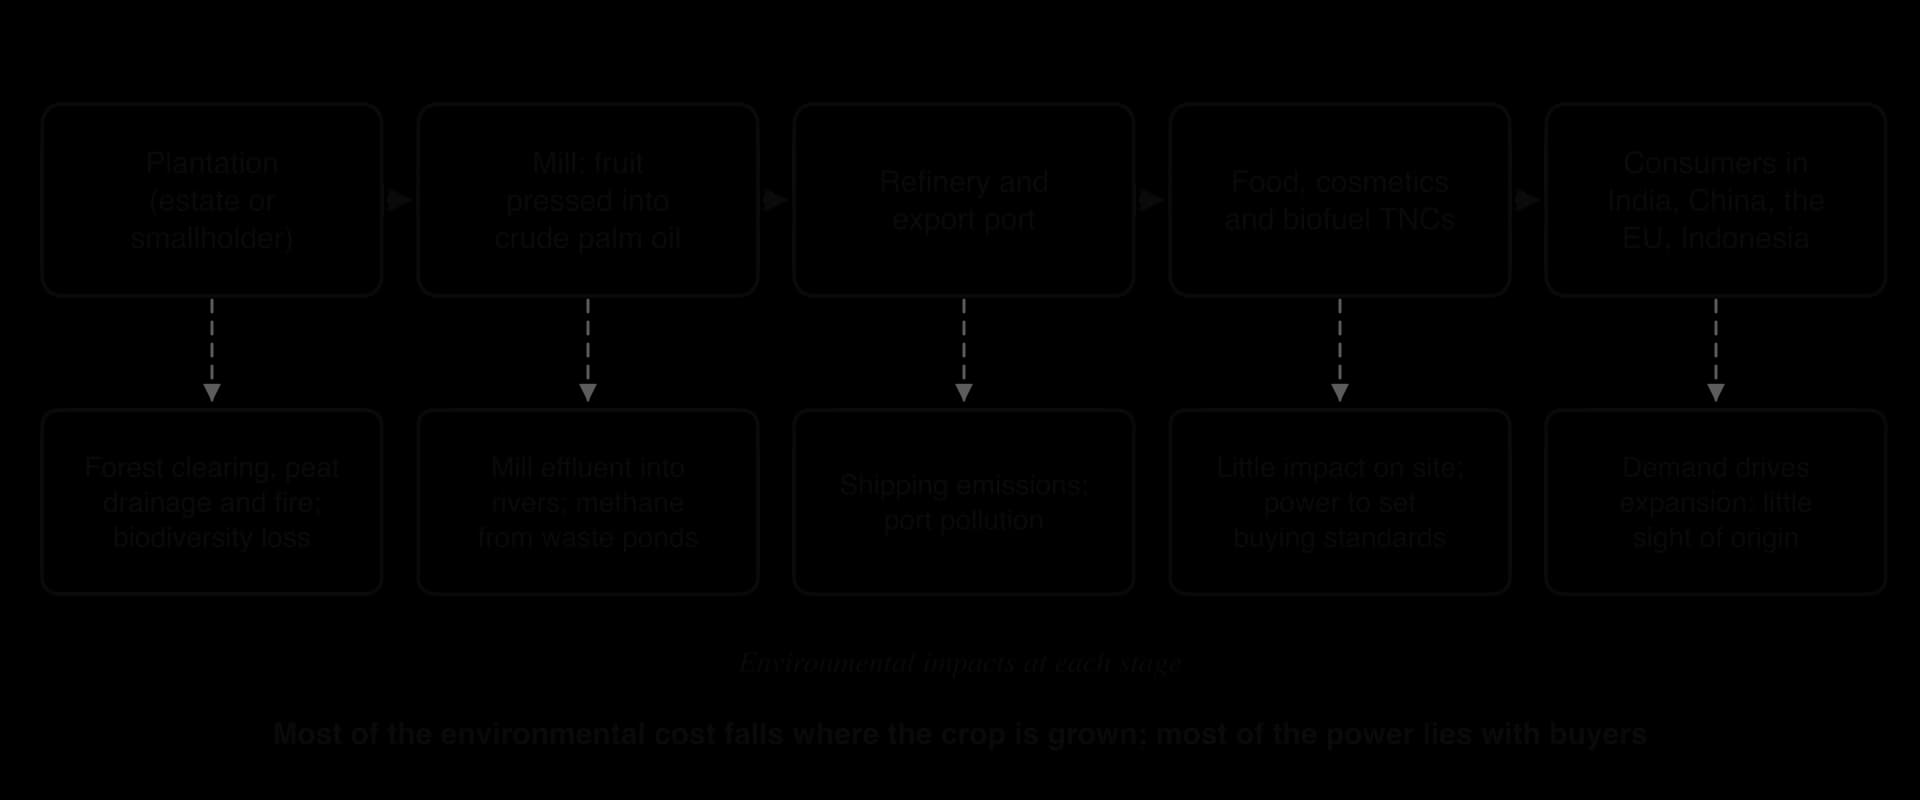
The environmental costs are severe where plantations replace tropical forest or drained peatland. Clearing removes the habitat of species found only in Sumatra and Borneo, such as orangutans and Sumatran tigers. Draining peat swamps to plant oil palms dries out soils that have stored carbon for thousands of years, and the dry peat oxidises and burns easily. Fire is the cheapest way to clear land, costing about US$5 per hectare against up to US$200 per hectare for machinery and chemicals. Mills discharge effluent into rivers, and the waste ponds release methane. The fires on drained peat are the source of the transboundary haze in the case study.
Soy and cattle in the Amazon and Cerrado
In South America the main agribusiness frontier is soy, grown largely for animal feed in China and Europe, together with cattle ranching for beef exports. Most Amazon forest is cleared first for cattle pasture; soy then expands onto land that is already cleared, pushing ranchers further into the forest. The Cerrado, the savanna south of the Amazon, has less legal protection, so much of the expansion of soy has moved there.
The Amazon Soy Moratorium, agreed by soy traders in 2006 after a campaign by Greenpeace, committed them not to buy soy grown on land in the Brazilian Amazon cleared after a cut-off date (later set at 2008). Between 2006 and 2023, 97.6% of Amazon deforestation was not linked to soy, even though the area of soy in the biome grew about fourfold, and research attributes about 3.2 million hectares of avoided clearance between 2008 and 2025 to the agreement.
However, it covered only the Amazon, so clearance shifted to the Cerrado. It has also faced political challenges: in 2024 the state of Mato Grosso passed a law removing tax benefits from companies that refuse to buy soy from legally cleared land (Brazil’s Supreme Federal Court suspended it in December 2024 while the case is heard), and in September 2025 Brazil’s competition authority, CADE, ordered the moratorium suspended from 1 January 2026, ruling that the traders’ joint agreement restricted competition.
Responses to the environmental risks of agribusiness
Responses come from businesses, civil society and governments in both producing and consuming countries.
Certification. The Roundtable on Sustainable Palm Oil (RSPO), founded in 2004, certifies plantations that meet standards on clearance, peat and labour; members can use its trademark. It now includes a “no peat” rule.
Voluntary moratoria by traders. The Amazon Soy Moratorium (2006) is the best-known example.
Government moratoria in producing countries. Indonesia imposed a moratorium on new forest clearing permits from 2011, created a Peatland Restoration Agency in 2015–16 and stopped granting new licences for palm oil plantations in 2018 for three years.
Import regulation in consuming countries. The EU Deforestation Regulation (Regulation (EU) 2023/1115, adopted in 2023) will require companies selling cattle, cocoa, coffee, palm oil, rubber, soy and wood in the EU to prove, with the geolocation of the farm, that they were not produced on land deforested after 31 December 2020. Its application has been delayed twice, most recently to 30 December 2026 for large and medium firms and 30 June 2027 for small ones.
Response | Who acts | Strengths | Limitations |
|---|---|---|---|
RSPO certification | Companies, NGOs (market-based) | Uses buyers’ power; measurable standards; trademark for consumers | Critics, including Greenpeace and the Rainforest Action Network, say rules are weakly enforced; low demand and high costs for smallholders |
Amazon Soy Moratorium | Traders, under NGO pressure | Linked to a sharp fall in soy-driven clearance in the Amazon | Leakage to the Cerrado and to cattle; ordered suspended by Brazil’s competition authority from 2026 |
Indonesian moratoria and peat restoration | Producing-country government | Acts at the source; re-wetting peat reduces fire risk | Weak enforcement and corruption; fires returned in 2019 |
EU Deforestation Regulation | Consuming-country government | Uses access to a large market; covers seven commodities | Delayed twice; producer countries (Indonesia, Malaysia, Brazil) object that it is unfair to smallholders; does not cover sales to China or India |
No single response is sufficient, because each acts on only one part of the supply chain or one region. Market-based schemes depend on buyers who care about the origin of their products, while much palm oil and soy is sold to markets where buyers have shown less interest in certification.
Responses in producing countries act at the source, but they depend on governments that also want export revenue and rural jobs. The approaches that have reduced clearance most, such as Brazil’s enforcement and the moratorium between 2004 and 2012, combined government enforcement with pressure from buyers and civil society. This is a question of power: the consuming countries and TNCs that set the rules for global markets have more influence over distant forests than the farmers who live beside them.
Sources: Human Rights Watch, “Toxic Tanneries” (2012); Wikipedia, “Ship breaking”, “Pollution haven hypothesis”, “Palm oil production in Indonesia”, “Roundtable on Sustainable Palm Oil”, “Amazon Soy Moratorium” (accessed 2026); World Bank WDI, EN.ATM.PM25.MC.M3 (GBD 2023), 2026; Council of the EU and law-firm summaries of Regulation (EU) 2025/2650, December 2025.
Case study: the Southeast Asian haze, 2015 and after
Place and context
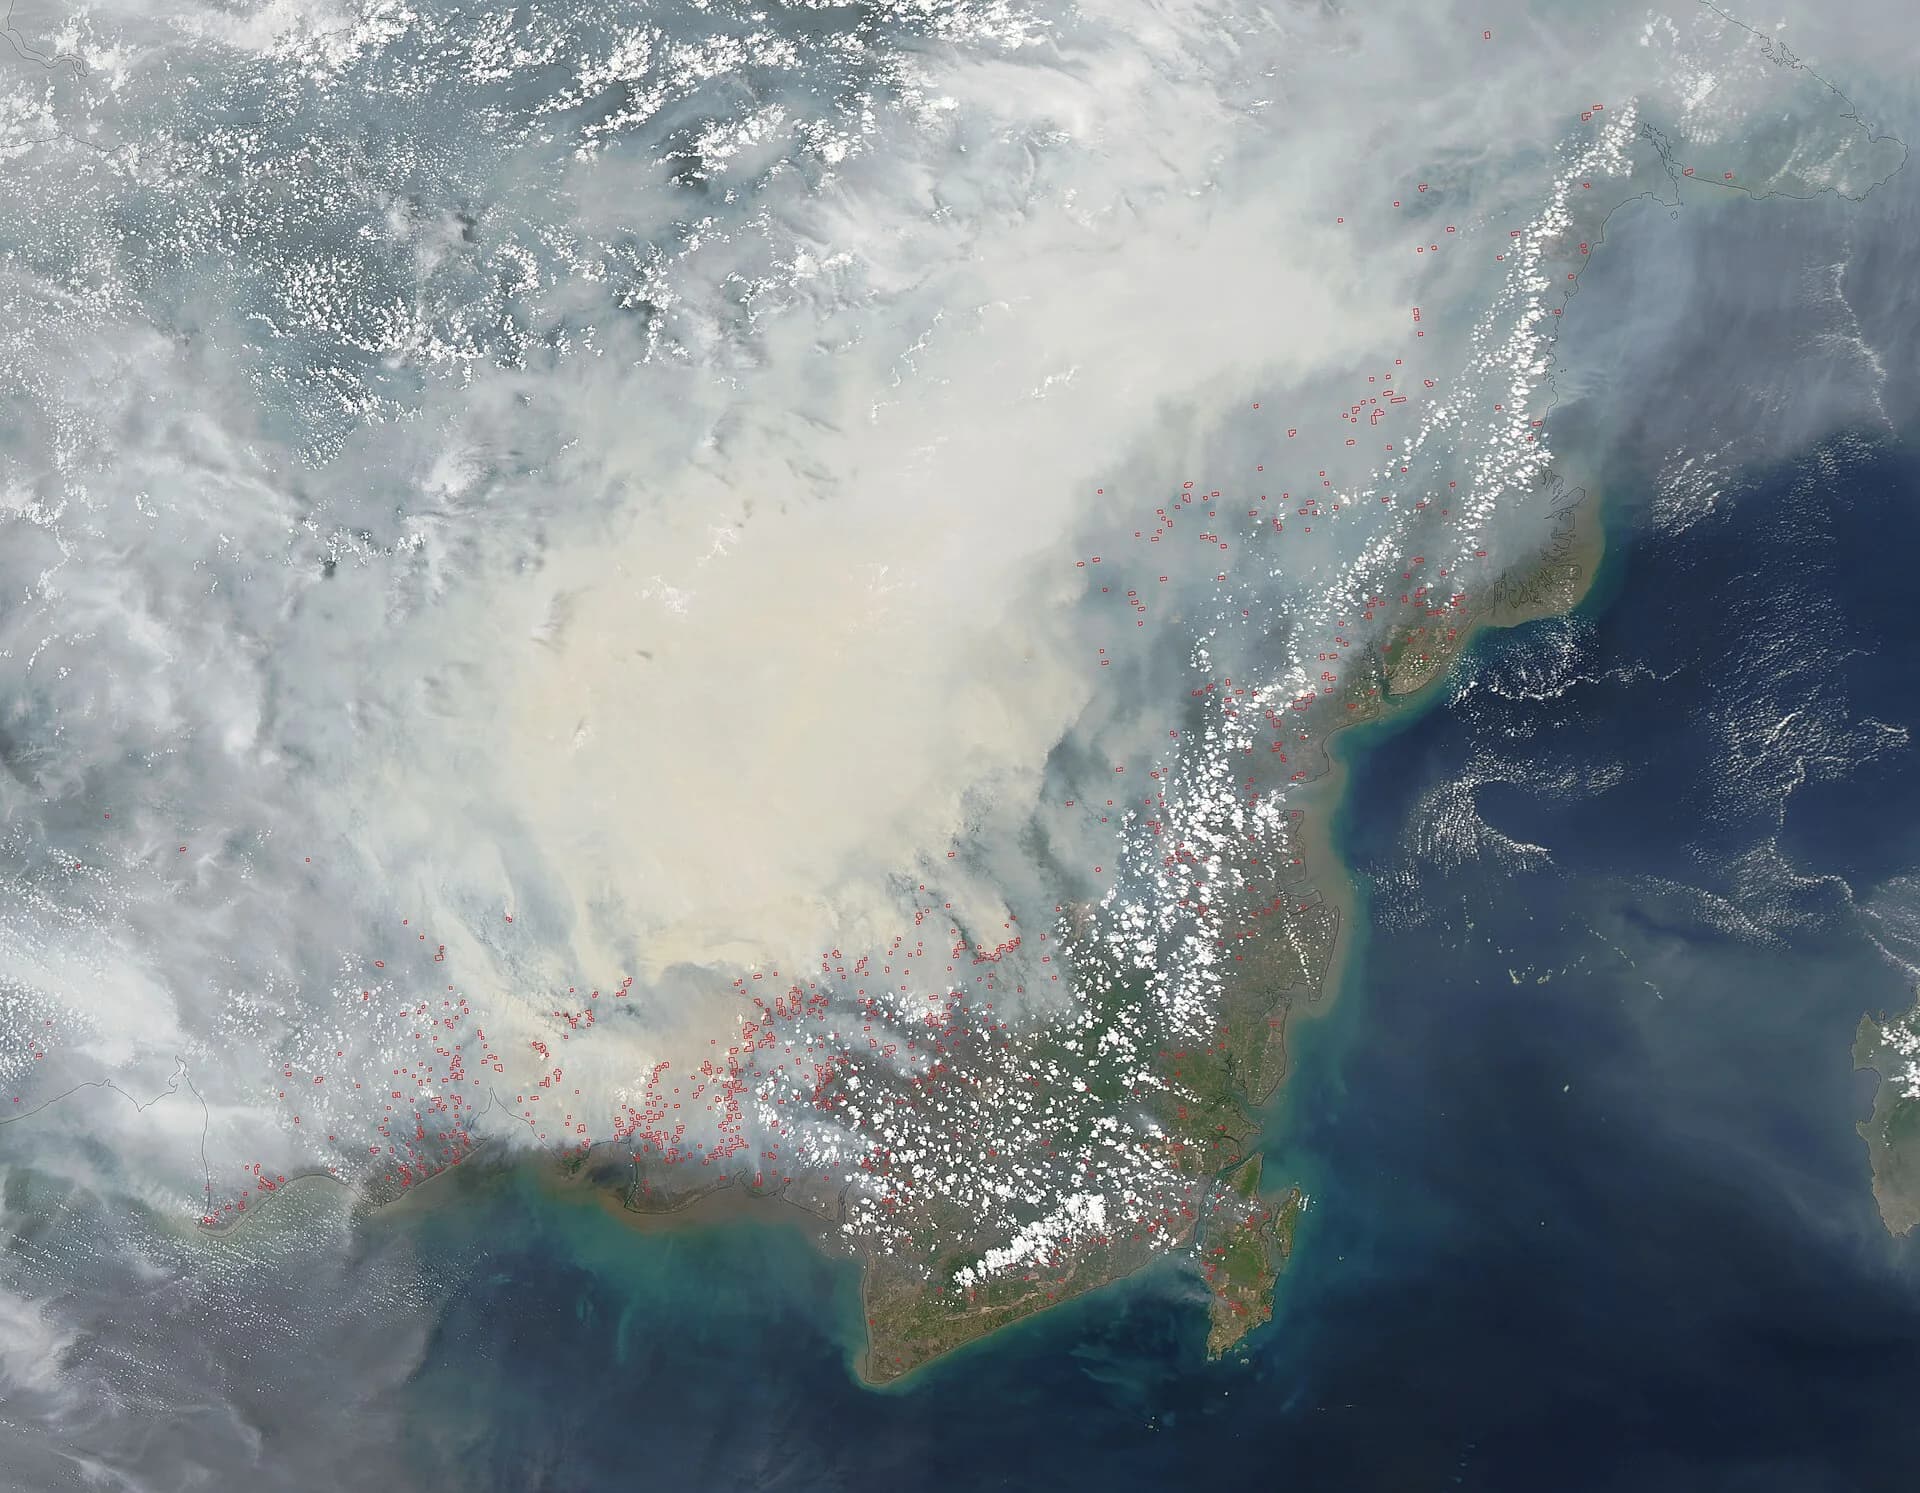
The Southeast Asian haze is a recurring episode of transboundary air pollution caused by land and peat fires, mainly in the Indonesian provinces of Riau, Jambi and South Sumatra on Sumatra and West and Central Kalimantan on Borneo. Indonesia has about 265,500 km² of peatland, 13.9% of its land area, much of it in these provinces. Haze has been recorded since 1972, and the 1997 episode, the most severe on record, cost about US$9 billion across the region. The 2015 episode was the worst since then.
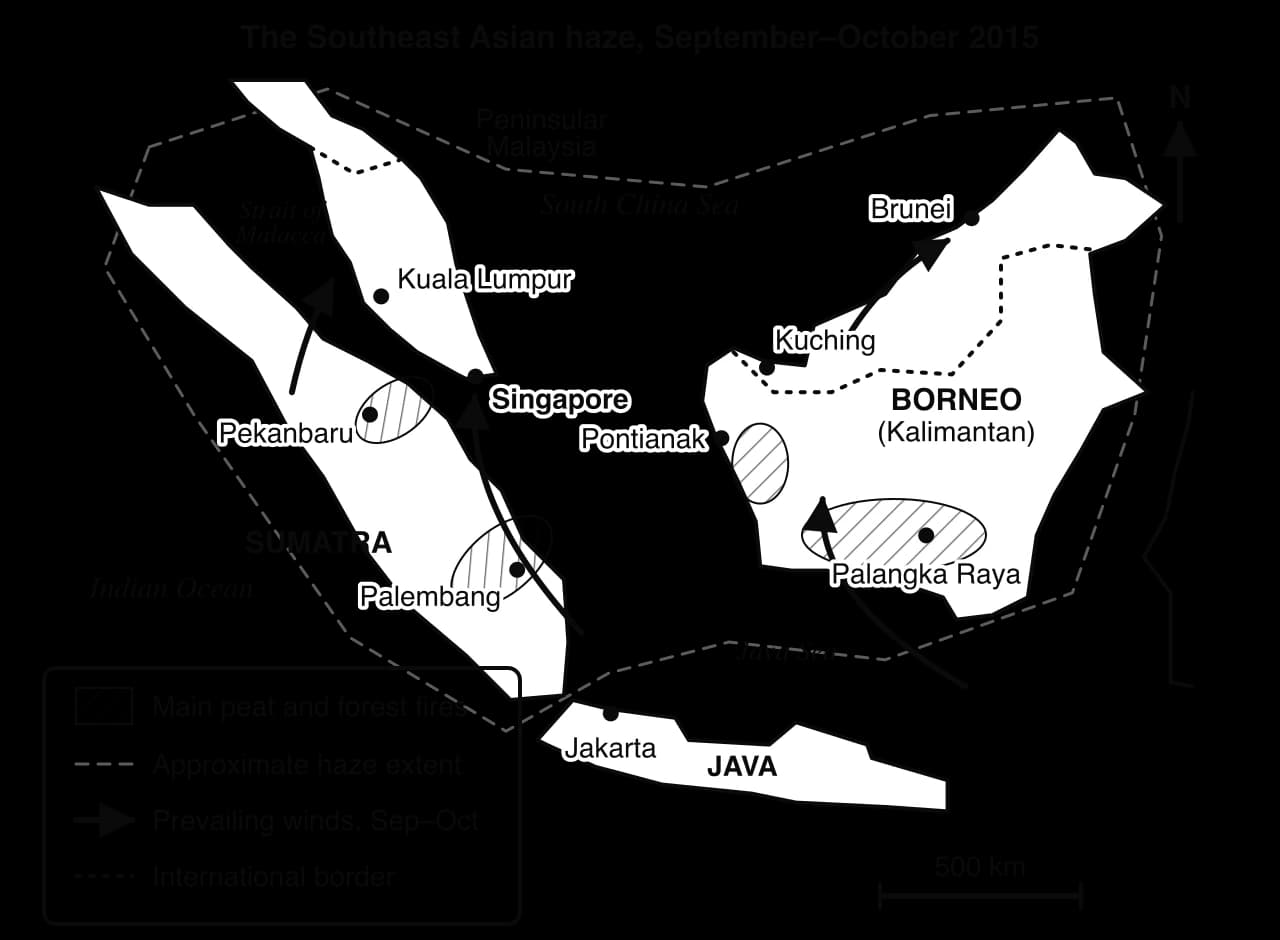
The map shows the source–pathway–receptor chain at the regional scale. The sources lie in Indonesia, the pathway is the low-level wind blowing north and north-east across the Strait of Malacca and the South China Sea between June and October, and the receptors include the cities of Singapore and Peninsular Malaysia, several hundred kilometres away in other states.
Causes: global demand, local fire and a physical trigger
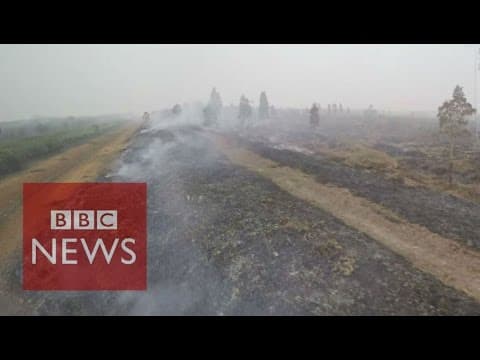
The fires were lit, mostly deliberately, to clear land for oil palm and pulpwood plantations, by companies, by contractors working for them and by smallholders. Draining peat swamps for planting lowers the water table, so the upper peat dries out and burns easily; once alight, peat can smoulder underground for weeks and is very hard to put out. Fire is the cheapest way to clear land and to remove old palms before replanting.
Responsibility is contested. A study in Environmental Research Letters found that 59% of fire emissions in Sumatra and 73% in Kalimantan in 2015 came from outside the boundaries of timber and palm oil concessions, which companies cite as evidence that smallholders and others were to blame. Activists reply that companies still benefit, because land cleared by fire is later sold or planted with oil palm, and because company drainage dries out neighbouring land. The physical trigger was a strong El Niño, which brought an unusually long dry season to Indonesia in 2015 and let fires spread much further than in a normal year.
 YouTube
Consequences for different places and people
Haze affected Indonesia from late June 2015 until heavy rain arrived at the end of October, and reached neighbouring countries in September. The table summarises the effects in the main places affected.
Place | Peak pollution reading | Effects on people |
|---|---|---|
Central Kalimantan, Indonesia | Record PSI of about 2,300 (late September); Palangka Raya 1,986 on Indonesia’s index (22 September) | Over 500,000 people with respiratory illness in Indonesia by 23 October; deaths from respiratory infections; flights cancelled; thousands left Pekanbaru |
Singapore | Record PSI of 341 (25 September, 5 a.m.) | All primary and secondary schools closed on 25 September; masks distributed, including to 29,000 elderly residents; sporting events cancelled |
Malaysia | API of 308 in Shah Alam (hazardous) | 2,696,110 students in 4,778 schools affected by closures (22 October); Kuala Lumpur Marathon cancelled |
The world | About 600 million tonnes of greenhouse gases from the fires (GFED) | Roughly Germany’s annual emissions; Indonesia’s daily emissions briefly exceeded those of the USA |
The economic cost was very large. A World Bank analysis estimated the losses to Indonesia alone at US$16.1 billion, about 1.9% of GDP, more than the value of its palm oil production in 2014; about 2.6 million hectares burned. Agriculture, forestry, tourism, transport and trade all lost income, and the cost of health care and lost schooling fell most on poorer households who could not move away or buy air purifiers.
Estimates of the health toll vary greatly. A study by researchers at Harvard and Columbia universities, published in 2016, estimated that the haze caused more than 100,000 extra deaths, over 90,000 of them in Indonesia. The health authorities of Indonesia, Singapore and Malaysia rejected the estimate, which was based on a model of exposure rather than counted deaths. The disagreement reflects real uncertainty, but also the political sensitivity of a figure that would make the governments’ responses look inadequate.
Responses and how well they worked
Responses came at every scale.
Indonesia (the source state) declared states of emergency in six provinces in September 2015, deployed about 25,000 military personnel to fight fires, used water-bombing aircraft and cloud seeding, built basins to re-wet peat, and suspended the permits of some companies. In 2015–16 it created a Peatland Restoration Agency to re-wet drained peat, and from 2018 it stopped issuing new licences for oil palm plantations for three years. After initially insisting it could manage alone, it accepted aircraft and firefighting teams from neighbouring countries, including Singapore, in October 2015.
Singapore (a receptor state) used its Transboundary Haze Pollution Act 2014 for the first time. On 25 September 2015 it named five Indonesian companies, among them Asia Pulp and Paper (APP), and asked them to explain their actions. NTUC FairPrice, Singapore’s largest supermarket chain, withdrew APP’s paper products from its shelves.
ASEAN (the regional scale) relied on the 2002 Agreement on Transboundary Haze Pollution, which Indonesia had ratified only in September 2014. In 2019 its members agreed to work towards a haze-free ASEAN by 2020, a target that was missed.
Business and civil society. The RSPO added a “no peat” rule to its certification, and NGOs used satellite fire data to link hotspots to concessions and publicise the companies involved.
The responses reduced the scale of later episodes but did not end them. In 2019, a dry year with a strongly positive Indian Ocean Dipole, the fires returned: Indonesia detected more than 20,000 hotspots, 885,026 people had severe respiratory infections, 230 people were arrested for illegal burning, and in Malaysia 2,459 schools closed on 18 September, affecting about 1.7 million students. Singapore’s PSI peaked at 154, far below 2015 but still “unhealthy”.
Fires and haze returned in 2026. On 9 October Malaysia closed schools in Kuala Lumpur, Putrajaya, Johor, Malacca, Negeri Sembilan and Selangor, affecting about two million students, and Singapore’s 24-hour PSI reached 181, its highest reading of the season. Malaysia’s prime minister, Anwar Ibrahim, asked Indonesia’s president, Prabowo Subianto, to act and called for an urgent meeting of ASEAN environment ministers.
The weaknesses are partly about power and sovereignty. Indonesia’s vice-president, Jusuf Kalla, said in 2015 that Indonesia had no obligation to apologise to its neighbours and that they should offer help rather than criticism, and Malaysia’s prime minister, Najib Razak, acknowledged that only Indonesia could gather the evidence to convict the companies involved. Indonesia accepted Singapore’s investigations only on condition that they did not violate its sovereignty, so Singapore’s law has been hard to enforce against companies whose staff, land and records lie in Indonesia.
Malaysia shelved its own version of the law in 2020. At the same time, many of the companies are based in, or financed from, Singapore and Malaysia, and the palm oil and paper they produce are sold worldwide, so the receiving countries and global consumers are also part of the source.
What the haze shows about the key concepts
Concept | How the haze shows it |
|---|---|
Place | Drained tropical peat, a long dry season and dense cities downwind make this region unusually exposed; the same fires on mineral soils would produce far less smoke |
Process | Drainage dries peat, fire clears land, El Niño extends the dry season, and winds carry smoke across borders: a chain of human and physical processes |
Power | Plantation companies, smallholders, the Indonesian state, neighbouring governments and global buyers have unequal influence; sovereignty limits what receptor states can do |
Possibility | Peat re-wetting, enforcement, certification and import rules could break the chain at the source; climate change may make dry El Niño years more severe |
Scale | Local fires, a regional haze over six or more countries and a global contribution to greenhouse gases from the same event |
How far does the evidence that most 2015 fire emissions came from outside concessions reduce the responsibility of palm oil and pulpwood companies?
Why has Singapore’s Transboundary Haze Pollution Act been difficult to enforce, and what does this show about sovereignty?
Suggest which single response, at the source, pathway or receptor, would most reduce the risk of future haze, and justify the choice.
Sources: Wikipedia, “2015 Southeast Asian haze”, “2019 Southeast Asian haze” and “Southeast Asian haze” (accessed 2026), citing NEA Singapore, BNPB Indonesia, the Global Fire Emissions Database and Environmental Research Letters; World Bank, “The Cost of Fire” (2016); Al Jazeera English, “Malaysia shuts schools as haze from Indonesian fires chokes Southeast Asia”, 9 October 2026.
How global interactions affect the environment at different scales
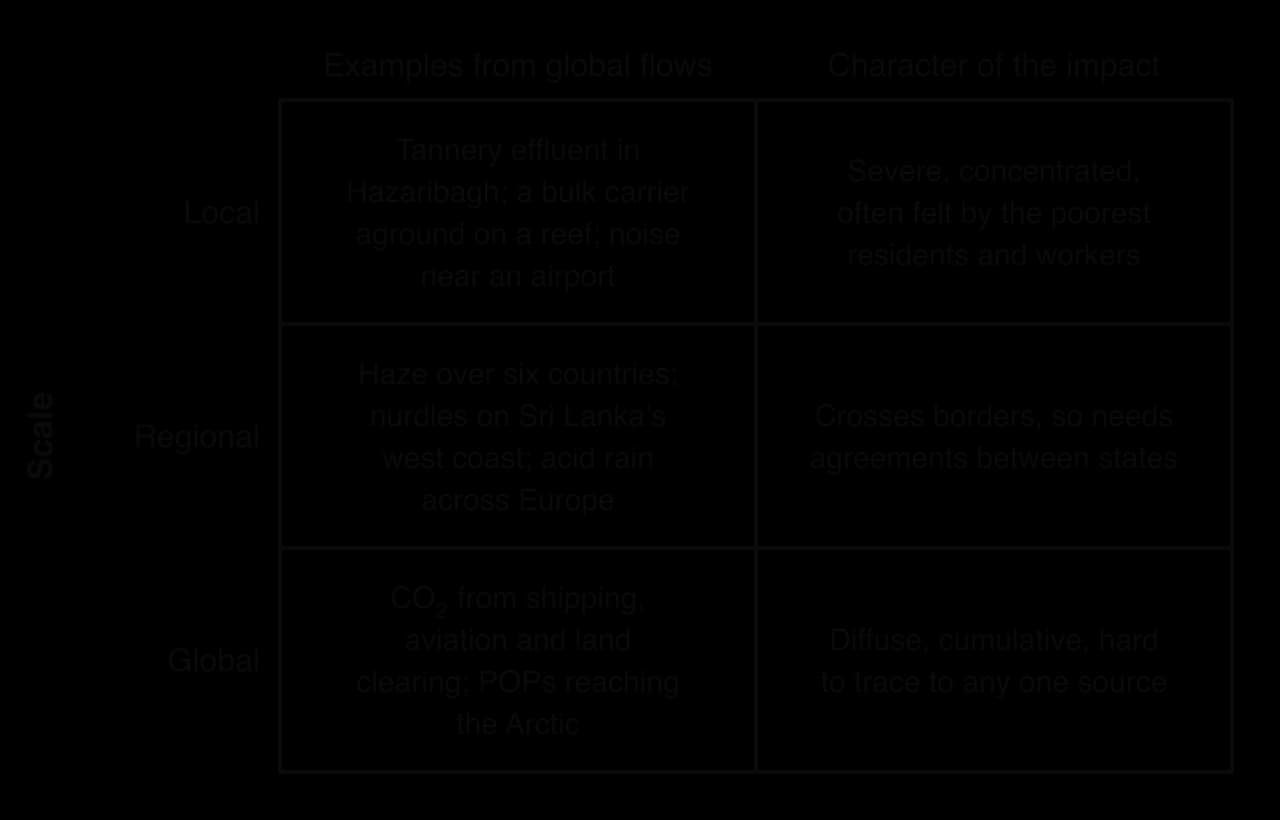
Transboundary pollution, shipping, the global shift of industry and agribusiness show that global interactions affect the physical environment to very different degrees. Some impacts are intense but local, some are regional and cross borders, and some are diffuse but global. The grid sorts the main examples by scale.
Three contrasts help to judge the degree of an impact:
Concentrated or diffuse. A tannery’s effluent or a stranded ship’s oil harms a small area severely; CO₂ from millions of flights harms no single place noticeably but adds to a global problem.
Short-lived or persistent. Haze clears after the rains, although its health effects can last; POPs and plastic pellets persist for decades, and land cleared of primary forest takes centuries to recover, if it ever does.
Reversible or irreversible. Rivers can recover once effluent stops, as many in Europe have; extinct species and burned peat that held carbon for thousands of years cannot be restored on human timescales.
The degree of an impact also depends on the place that receives it. A reef lagoon in Mauritius, a cold Arctic food chain or a drained tropical peatland is far more sensitive than an industrial port in a temperate country.
Vulnerability adds a human layer: the same pollution harms a tannery worker without protective clothing, a fisher with no other income or a child in a city without air filters much more than it harms people with savings, insurance and the option to move. The environmental risks of global interactions are therefore spread unequally between places and between people within them, which links them closely to the idea of climate justice.
Exam practice
Paper 3 offers one question on each HL unit, and each question has two parts: part (a), worth 12 marks, and part (b), worth 16 marks, to be completed in one hour. Part (a) asks for analysis or explanation; part (b) asks for a discussion of a statement, with synthesis across the course and evaluation.
Part (b) carries more marks and should get more of the hour: about 25 minutes for (a) and 35 minutes for (b) is a sensible split.
Part (b) on the same unit then widens the focus to a quoted statement that needs balance, synthesis and a judgment.
Summary
Global interactions create environmental risk through pollution that crosses borders, pollution along the flows themselves, and pollution where production has moved.
Transboundary pollution travels from a source along a pathway to receptors in other countries; acid rain, haze, radioactive fallout, river spills and persistent organic pollutants are the main types.
TBP is hard to manage because of sovereignty, uncertain proof of source, costs and benefits in different places, unequal power and time lags; agreements work best when source states also gain.
Shipping lanes and ports suffer oil spills, lost containers and nurdles, invasive species from ballast water, exhaust from bunker fuel and underwater noise.
Shipping produces about 3% of global greenhouse gas emissions and aviation about 2.4% of CO₂ (3.5% of warming); life-cycle assessment shows that the type of food and air freight matter more than distance.
The pollution haven hypothesis explains some cases, such as tanneries, battery recycling and shipbreaking, but environmental rules are rarely the main reason a whole industry moves.
Agribusiness monocultures of palm oil and soy cause deforestation, peat drainage and fire; certification, moratoria and the EU Deforestation Regulation each address only part of the chain.
The 2015 Southeast Asian haze affected at least six countries, cost Indonesia about US$16.1 billion and showed how sovereignty limits responses to TBP.
Impacts vary in degree from intense local damage to diffuse global effects, and they fall most heavily on sensitive places and vulnerable people.
Self-check
- To do:
I can define transboundary pollution and apply the source–pathway–receptor model to a named example.
- To do:
I can explain five reasons why TBP is hard to manage and evaluate at least four types of response.
- To do:
I can describe the impacts of shipping along shipping lanes, with the Wakashio, X-Press Pearl and zebra mussels as examples.
- To do:
I can determine and compare the carbon footprints of transport modes, and distinguish food miles from life-cycle assessment.
- To do:
I can examine the pollution haven hypothesis using Hazaribagh, shipbreaking and China’s war on pollution.
- To do:
I can explain the environmental impacts of palm oil and soy agribusiness and evaluate the responses to them.
- To do:
I can use the Southeast Asian haze to analyse the causes, consequences and responses of a TBP event.
- To do:
I can discuss how the degree of environmental impact varies with scale, place and vulnerability.