Notes on 3.2 Impacts of changing trends in resource consumption
Learning objectives
Describe the water–food–energy nexus as a system and explain how its links create trade-offs and synergies.
Distinguish between water security, food security and energy security, and describe how each is measured.
Explain how energy pathways, chokepoints and geopolitical issues affect a country’s energy security.
Explain how global climate change puts pressure on each part of the nexus and on the links between them.
Examine why perspectives on and priorities for resource security vary between places and between scales.
Describe trends in waste generation and outline the main methods of disposal and recycling, using the waste hierarchy.
Evaluate the international flows of plastic waste and e-waste, and the rules that govern them.
Compare the resource security of two contrasting countries, Qatar and Egypt, using real data.
Introduction
Rising populations and incomes increase the demand for water, food and energy, and the three resources depend on one another. When one runs short, the others are affected: a drought can cut hydropower and crop yields in the same year, and a rise in oil and gas prices makes fertiliser, irrigation pumping and food transport more expensive. How secure a country is depends not only on what it has but also on what it can buy, store and move safely across borders.
The topic is mainly about power and place. Power decides who controls a pipeline, a shipping lane or an export ban, and who pays when supplies are cut. Place decides the starting point: a desert peninsula, a river valley that depends on rain far upstream and a wet, mountainous country face very different resource problems. The topic also links back to the patterns of rising resource consumption and forward to resource stewardship.
What resource security means
A resource is secure when people can rely on having enough of it, of good enough quality, at a price they can afford, now and in the future. Security therefore has several parts: the physical amount available, access to it (whether people can reach it and pay for it), its quality, and its reliability over time, including in a crisis. A country can be rich in a resource and still insecure if the resource cannot reach the people who need it.
Geographers study three resource securities in particular. Water security concerns access to enough safe water; food security concerns whether people can obtain enough nutritious food; energy security concerns reliable and affordable supplies of fuel and electricity. The three are closely linked, because producing each resource uses the other two.
Security at different scales
Security looks different at each scale. At the national scale, a government asks whether the country as a whole can meet its needs, from its own production, from imports or from stores. At the household scale, the question is whether a family can turn on a tap, buy bread and pay for cooking fuel. The two can disagree: a country can import enough grain to feed everyone while poor households still cannot afford it, and a country can have enough water in total while villages far from a pipe have none.
At the global scale, security depends on trade and on the stability of the routes that carry it. A war, a blocked strait or an export ban in one region can raise prices everywhere, because water, food and energy are traded in world markets or embedded in traded goods. The idea of embedded water, the water used to produce goods that are then traded, shows how a country with very little water can still consume a lot of it by importing food.
Scale | Typical question about security | Example of a measure |
|---|---|---|
Household | Can this family get safe water, enough food and affordable energy every day? | Time taken to collect water; share of income spent on food; hours of electricity a day |
National | Can the country meet its needs from production, imports and stores, even in a crisis? | Water stress; food import dependence; net energy imports as % of energy use |
Global | Can world supply and trade routes meet total demand without price shocks? | World food prices; share of oil and gas trade passing through one strait |
The water–food–energy nexus
The word nexus means a connection or link. The water–food–energy nexus is the set of links through which the production and use of water, food and energy depend on one another, so that a change in one resource affects the others. Thinking in terms of the nexus means managing the three together, as one system, rather than in separate government departments.
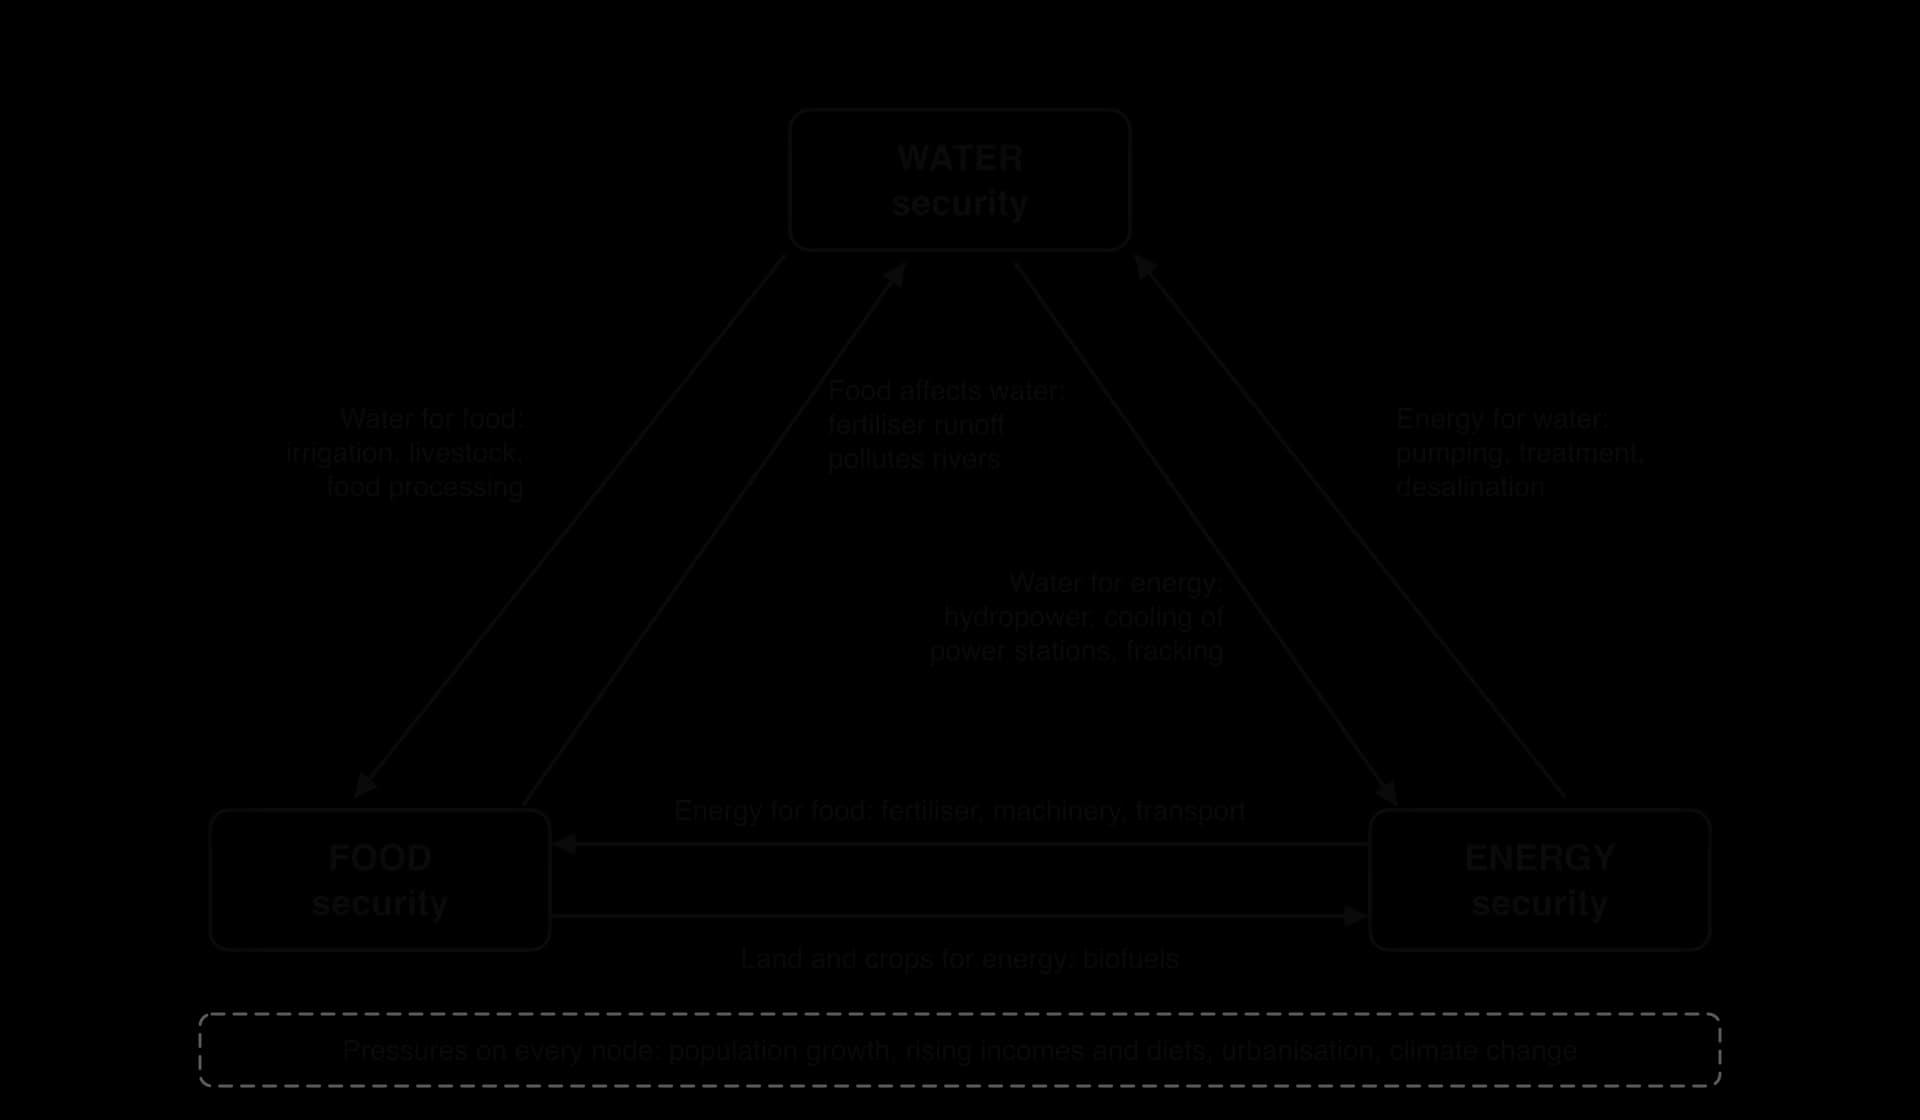
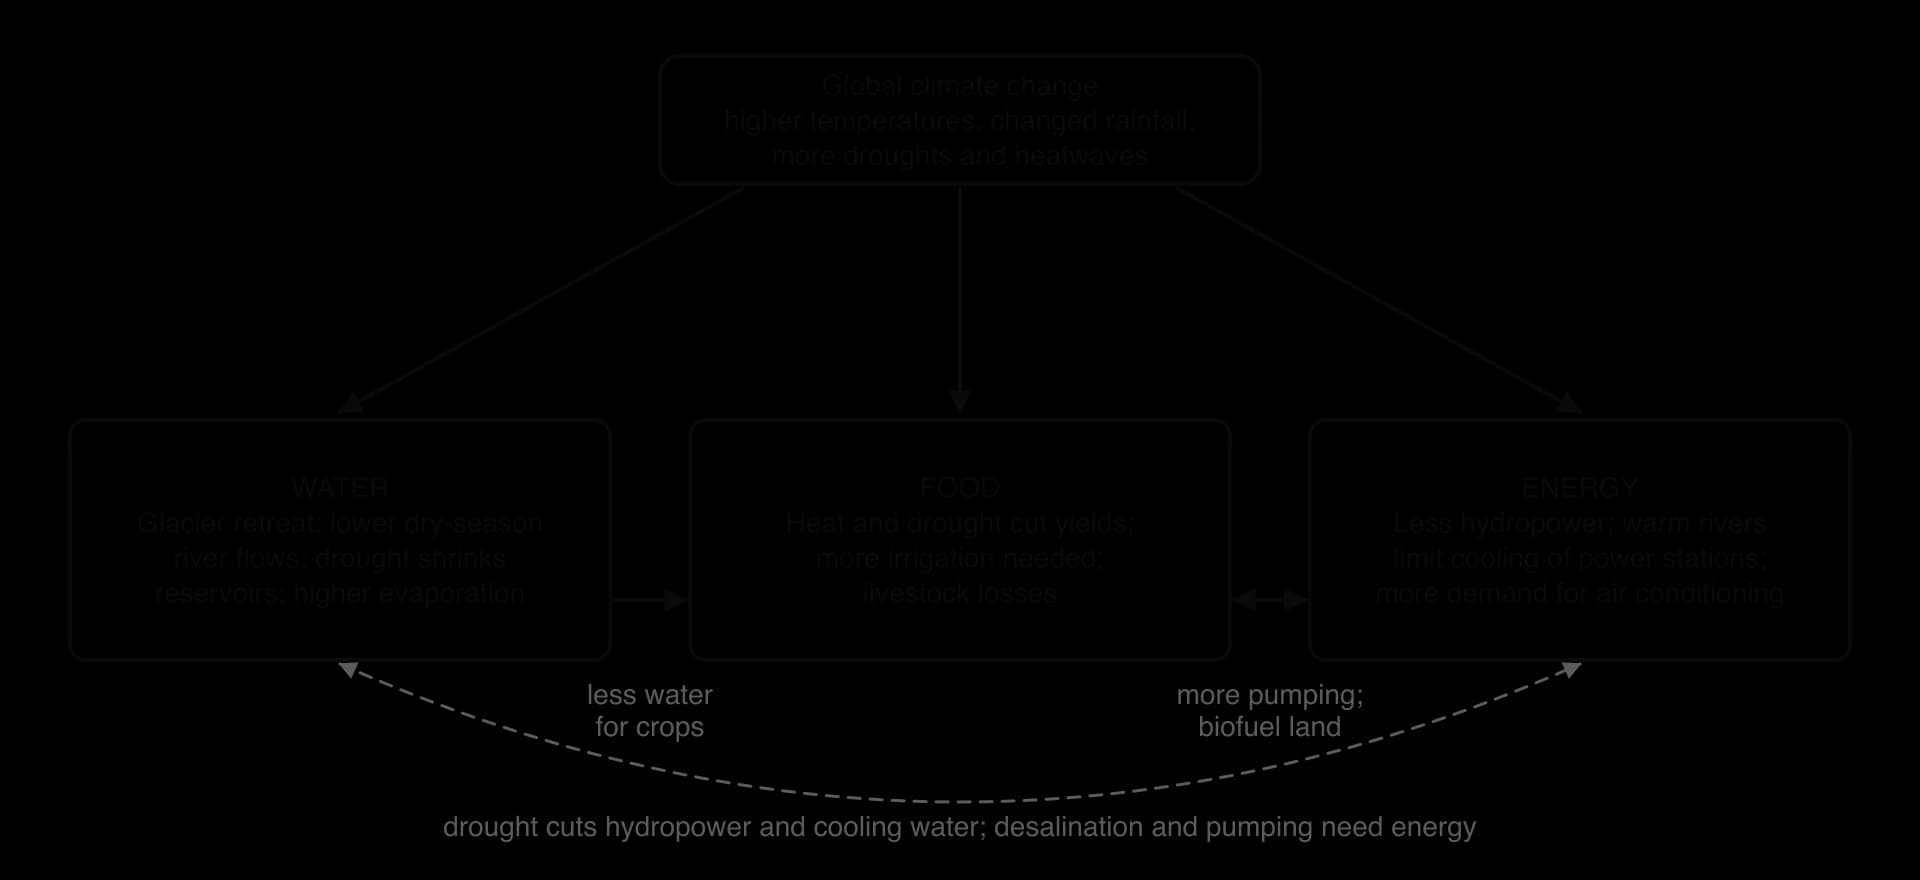
The nexus works as a system. Its stores are the water in rivers, reservoirs and aquifers, the food in fields, silos and shops, and the energy in fuel deposits, storage and the grid. Its flows are the links between them: water pumped to fields, electricity used for pumping, crops turned into fuel. Its inputs come from outside the country (rain, imports) and its outputs leave it (exports, waste, emissions). The triangle shows the six main links.
Water for food and water for energy
Water for food is the largest link. Agriculture accounts for about 70% of the world’s water withdrawals, mainly for irrigation, with more used for livestock and food processing. Irrigated land produces much more food per hectare than rain-fed land, so countries with dry climates, from Egypt to Pakistan, depend on it heavily.
Water for energy includes the water that turns the turbines of hydroelectric dams, the river or sea water used to cool thermal and nuclear power stations, and the water injected underground during fracking to release shale gas. Biofuel crops also need water to grow. When water runs short, power output can fall, as Zambia and France both found in recent droughts.
Energy for water and energy for food
Energy for water includes pumping groundwater from deep wells, moving water through long pipelines and canals, treating wastewater and, above all, turning seawater into fresh water. Energy for food includes making nitrogen fertiliser (which uses natural gas as a feedstock and as fuel), running tractors and pumps, and processing, refrigerating and transporting food. A rise in gas prices therefore raises fertiliser prices and, after a delay, food prices.
Desalination is the removal of salt from seawater or brackish water to produce fresh water, usually by reverse osmosis (forcing water through a membrane under pressure) or by distillation. Its energy use has fallen sharply, from about 20–30 kWh per cubic metre in 1970 to about 3 kWh per cubic metre in 2018, but it is still far more energy-intensive than using river or groundwater. Countries around the Persian Gulf, including Saudi Arabia, Kuwait, Oman and Qatar, obtain most of their drinking water from desalination plants, many of them powered by natural gas.
Land and food for energy: biofuels
A biofuel is a liquid or gas fuel made from recently grown plant or animal material, such as ethanol from maize or sugar cane and biodiesel from vegetable oils. Biofuels can replace some petrol and diesel and cut a country’s oil imports, but they compete with food crops for land, water and fertiliser. This is the clearest trade-off in the nexus, because land growing fuel cannot grow food.
The trade-off was seen during the 2007–2008 world food price crisis. Between 2006 and 2008, average world prices rose by 217% for rice, 136% for wheat, 125% for maize and 107% for soybeans. Many causes combined: high oil prices, poor harvests, low stocks, rising demand for meat in Asia and export bans. The diversion of maize to ethanol in the United States and of oilseeds to biodiesel in Europe was one of the most debated causes.
Trade-offs and synergies
A trade-off in the nexus is a decision that improves the security of one resource but reduces another. A synergy is a decision that improves two or three at once. Recognising both helps planners avoid solving one problem by creating another.
Decision | Benefit | Cost elsewhere in the nexus | Trade-off or synergy? |
|---|---|---|---|
Free electricity for farm pumps (Punjab, India) | Cheap irrigation; higher rice and wheat output | Groundwater falls; the state pays a large subsidy bill | Trade-off (food against water and energy) |
Biofuel mandates (USA, EU) | Less imported oil; farm income | Land and water diverted from food; higher food prices | Trade-off (energy against food) |
Gas-powered desalination (Gulf states) | Reliable drinking water in deserts | High energy use and emissions; brine discharged to the sea | Trade-off (water against energy and environment) |
Large hydroelectric dam | Low-carbon electricity; stored water for irrigation | Farmland flooded; river flow and sediment cut downstream | Both, depending on management |
Solar-powered irrigation pumps | Irrigation without diesel; lower running costs | Free daytime power can encourage over-pumping | Synergy if water use is limited |
Treating urban wastewater for irrigation | More water for farms; cleaner rivers | Energy for treatment | Mostly a synergy |
Punjab: cheap energy and falling water tables
The Indian state of Punjab, one of the country’s main producers of rice and wheat, illustrates the trade-off between food, water and energy. In February 1997 Punjab moved from charging farmers a flat rate for electricity to providing farm power free of charge. The number of tube wells in the state rose from about 192,000 in 1970–71 to about 1.38 million in 2011–12, and in 18 of its 22 districts the water table fell by more than a metre a year between 1998 and 2018.
Free power lowered the cost of growing paddy rice, which needs a great deal of water, in a state where it is not naturally suited. Studies comparing Punjab with neighbouring Haryana link the free-power policy to faster groundwater decline. The short-term gain in food output and farm income therefore came at the cost of long-term water security and a heavy burden on the state’s finances.
 YouTube
Water security: access to safe water
UN-Water defines water security as the capacity of a population to safeguard sustainable access to adequate quantities of acceptable-quality water for livelihoods, human well-being and socio-economic development, while protecting people against water-borne pollution and water-related disasters and preserving ecosystems, in a climate of peace and political stability. The definition is broad: it includes the amount of water, its quality, its reliability, and the political conditions that allow people to use it.
Water security is a different idea from water scarcity. Scarcity describes a shortage of water relative to demand, either because the water is physically absent or because people cannot afford the infrastructure to use it. Security describes whether people can rely on safe water. A country with little rain can still be water-secure if it can pay for desalination, storage and treatment; a wet country can be insecure if its water is polluted or its pipes reach only part of the population.
Measuring access: the drinking-water ladder
At the household scale, the World Health Organization and UNICEF measure access to drinking water through their Joint Monitoring Programme (JMP). It places each household on a ladder of five service levels, from drinking directly from rivers and ponds at the bottom to safely managed drinking water at the top. An improved source is one that, by its design, protects water from outside contamination: piped water, boreholes, protected wells and springs, rainwater and packaged water.
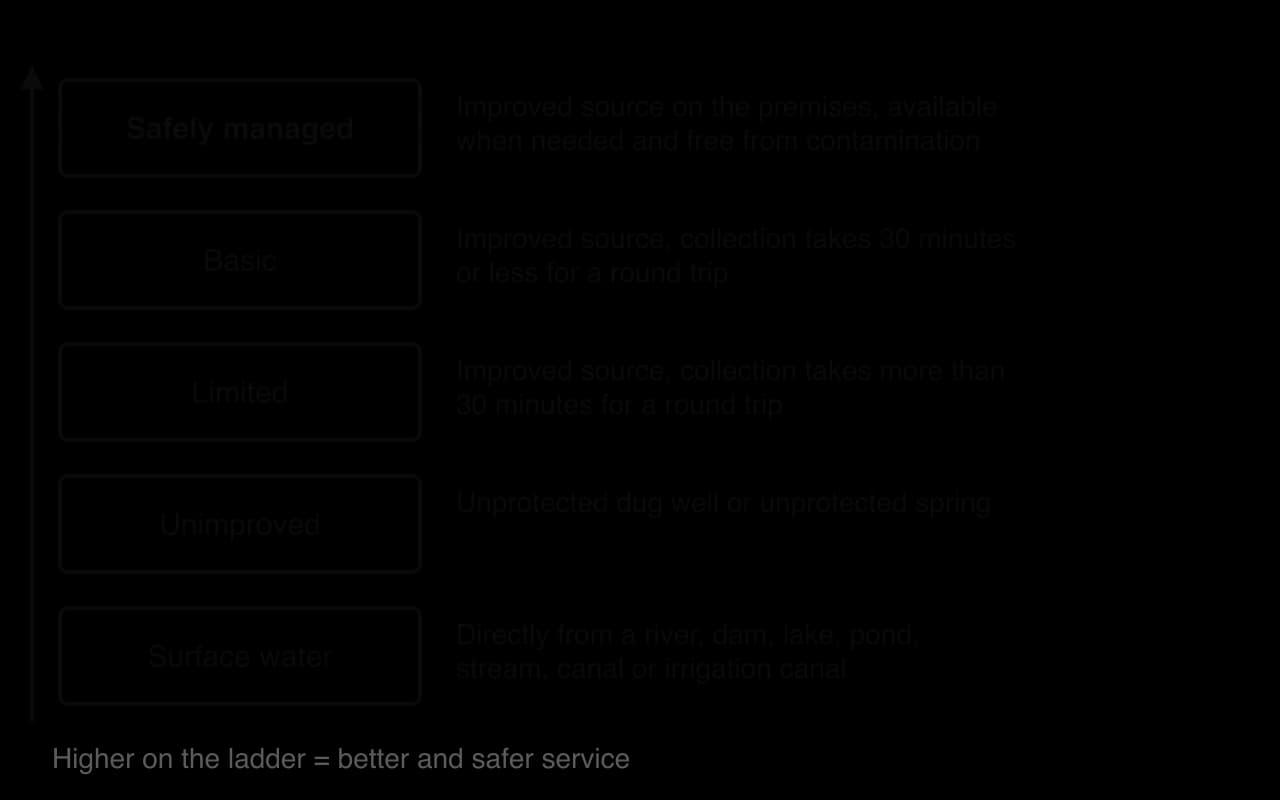
In 2024, 2.1 billion people, about one person in four, still lacked safely managed drinking water, and 106 million drank untreated surface water. Progress has been fastest in rural areas, where the share of people with safely managed drinking water rose from 50% in 2015 to 60% in 2024, while urban coverage stagnated as city populations grew faster than their water networks. People in the least developed countries were more than twice as likely as others to lack even basic drinking water.
Sources: WHO and UNICEF, Progress on Household Drinking Water and Sanitation 2000–2024, August 2025.
Measuring pressure at the national scale
At the national scale, geographers compare the water a country withdraws with the renewable freshwater available to it. Water stress is often measured as freshwater withdrawal as a percentage of the available renewable freshwater resources (SDG indicator 6.4.2). A value above 100% means a country uses more fresh water than its rivers and aquifers renew each year, by mining fossil groundwater, by desalination or by reusing wastewater.
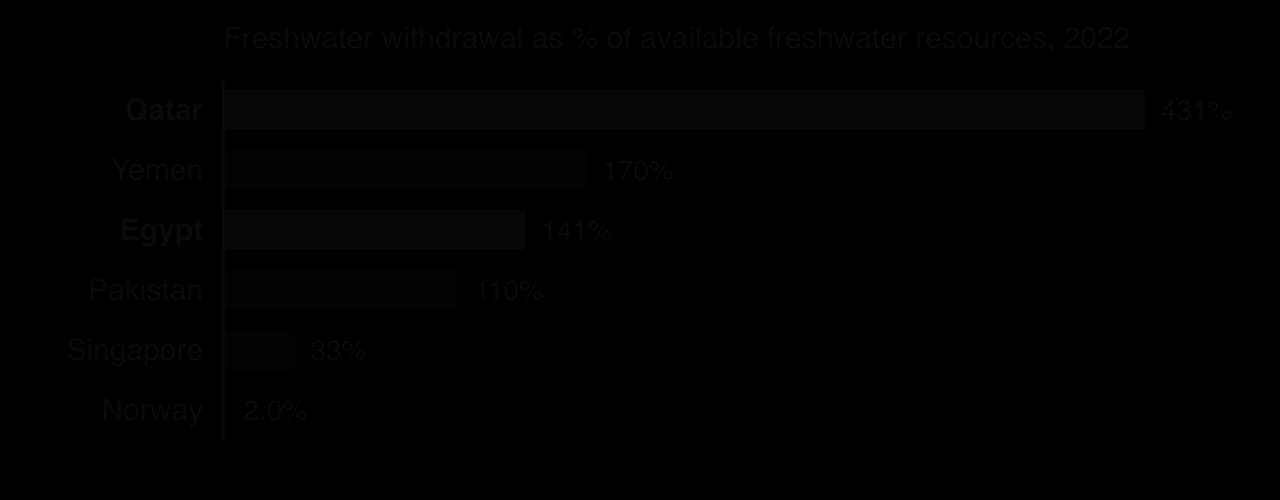
The chart shows that water stress and water security do not always match. Qatar has the highest water stress of the six countries, yet 95% of its people use safely managed drinking water, because it can afford to desalinate seawater. Egypt’s stress is lower, but only 79% of its people had safely managed water in 2024, and almost all of its water arrives by the Nile from upstream countries. Singapore has very little land for water catchment but full coverage, because it imports and recycles water and desalinates seawater.
Food security: food availability
The World Food Summit of 1996 defined food security as existing “when all people, at all times, have physical and economic access to sufficient, safe and nutritious food that meets their dietary needs and food preferences for an active and healthy life”. Food security is therefore about people’s ability to obtain food, not only about how much food a country produces.
The Food and Agriculture Organization (FAO) breaks the definition into four pillars. All four must be met at once, so a weakness in any one of them causes insecurity.
Pillar | Meaning | Example of a failure |
|---|---|---|
Availability | Enough food is present, from domestic production, imports, stocks and food aid | A drought halves the maize harvest and imports cannot fill the gap |
Access | People can obtain the food, physically and economically | Food is in the market but prices rise faster than wages |
Utilisation | Food is safe and nutritious and the body can use it (clean water, sanitation, cooking fuel) | Diarrhoea from unsafe water prevents children absorbing nutrients |
Stability | The other three are reliable over time and in crises | An export ban or a blocked shipping route suddenly cuts supply |
Food availability
Food availability is the amount of food present in a country or area, supplied by its own production, by imports, by stocks drawn down from storage and by food aid, minus exports and losses. A country with little farmland can still have high food availability if it imports a lot and holds large stocks. A country that produces a great deal can have low availability for its own people if much of the harvest is exported or used for animal feed and biofuels.
Undernourishment is the clearest measure of food insecurity at the scale of whole populations. The FAO estimates the share of people whose usual food intake does not provide the dietary energy they need for a normal, active and healthy life. About 8.1% of the world’s population was undernourished in 2024, roughly 660 million people, down slightly from 8.6% in 2021–2022 but above the 7.2% of 2017. Rates are highest in sub-Saharan Africa and in countries affected by conflict.
Sources: FAO, prevalence of undernourishment, via World Bank, World Development Indicators, 2024 data.
Self-sufficiency or import dependence?
Countries choose between two broad strategies for food availability. Food self-sufficiency means producing as much of the country’s food as possible at home, so that it does not depend on other countries. Food import dependence means relying on world markets, buying food from the cheapest suppliers and paying for it with exports of other goods. Most countries combine the two.
Self-sufficiency protects a country from trade shocks, but it can be very costly where land and water are scarce: growing wheat or dairy fodder in a desert uses irrigation water and energy that may be worth more elsewhere.
Import dependence uses the world’s most productive farmland and allows water-poor countries to import embedded water in their food, but it exposes them to price rises, export bans and blocked routes. Singapore, which imports most of its food, set a goal in March 2019 to produce 30% of its nutritional needs by 2030 (“30 by 30”), revised in November 2025 to targets for 2035 of 20% of fibre and 30% of protein, up from 8% and 26% in 2024.
Energy security: pathways and geopolitics
Energy security is the uninterrupted availability of energy at an affordable price; the International Energy Agency (IEA) describes its aim as “reliable, affordable access to all fuels and energy sources”. Short-term energy security is the ability to cope with sudden disruptions, such as a pipeline cut or a refinery fire. Long-term energy security is having enough investment and supply to meet future demand while the energy system changes.
A country’s dependence on imported energy is measured as energy import dependence: net energy imports (imports minus exports) as a percentage of the energy the country uses. A negative value means the country is a net exporter. Values above 100% are possible for trading hubs that import fuel to refine and re-export, such as Singapore (294% in 2024).
Energy pathways and chokepoints
An energy pathway is the route along which energy travels from where it is produced to where it is used: oil and gas pipelines, tanker routes, railways for coal and high-voltage electricity lines. The longer and more complex a pathway, and the more countries it crosses, the more points at which supply can be interrupted by conflict, accidents, piracy, bad weather or political decisions.
The weakest points on sea routes are chokepoints. A chokepoint is a narrow passage, such as a strait or canal, through which a large share of a trade must pass and where a blockage would be hard to avoid. Before 2026, about 20% of the world’s liquefied natural gas (LNG) trade and 25% of its seaborne oil trade passed through the Strait of Hormuz each year, much of it bound for Asia. The Strait of Malacca between Malaysia, Singapore and Indonesia is the main route for oil shipped from the Gulf to East Asia; in 2003 China’s president Hu Jintao called his country’s dependence on it the “Malacca dilemma”.
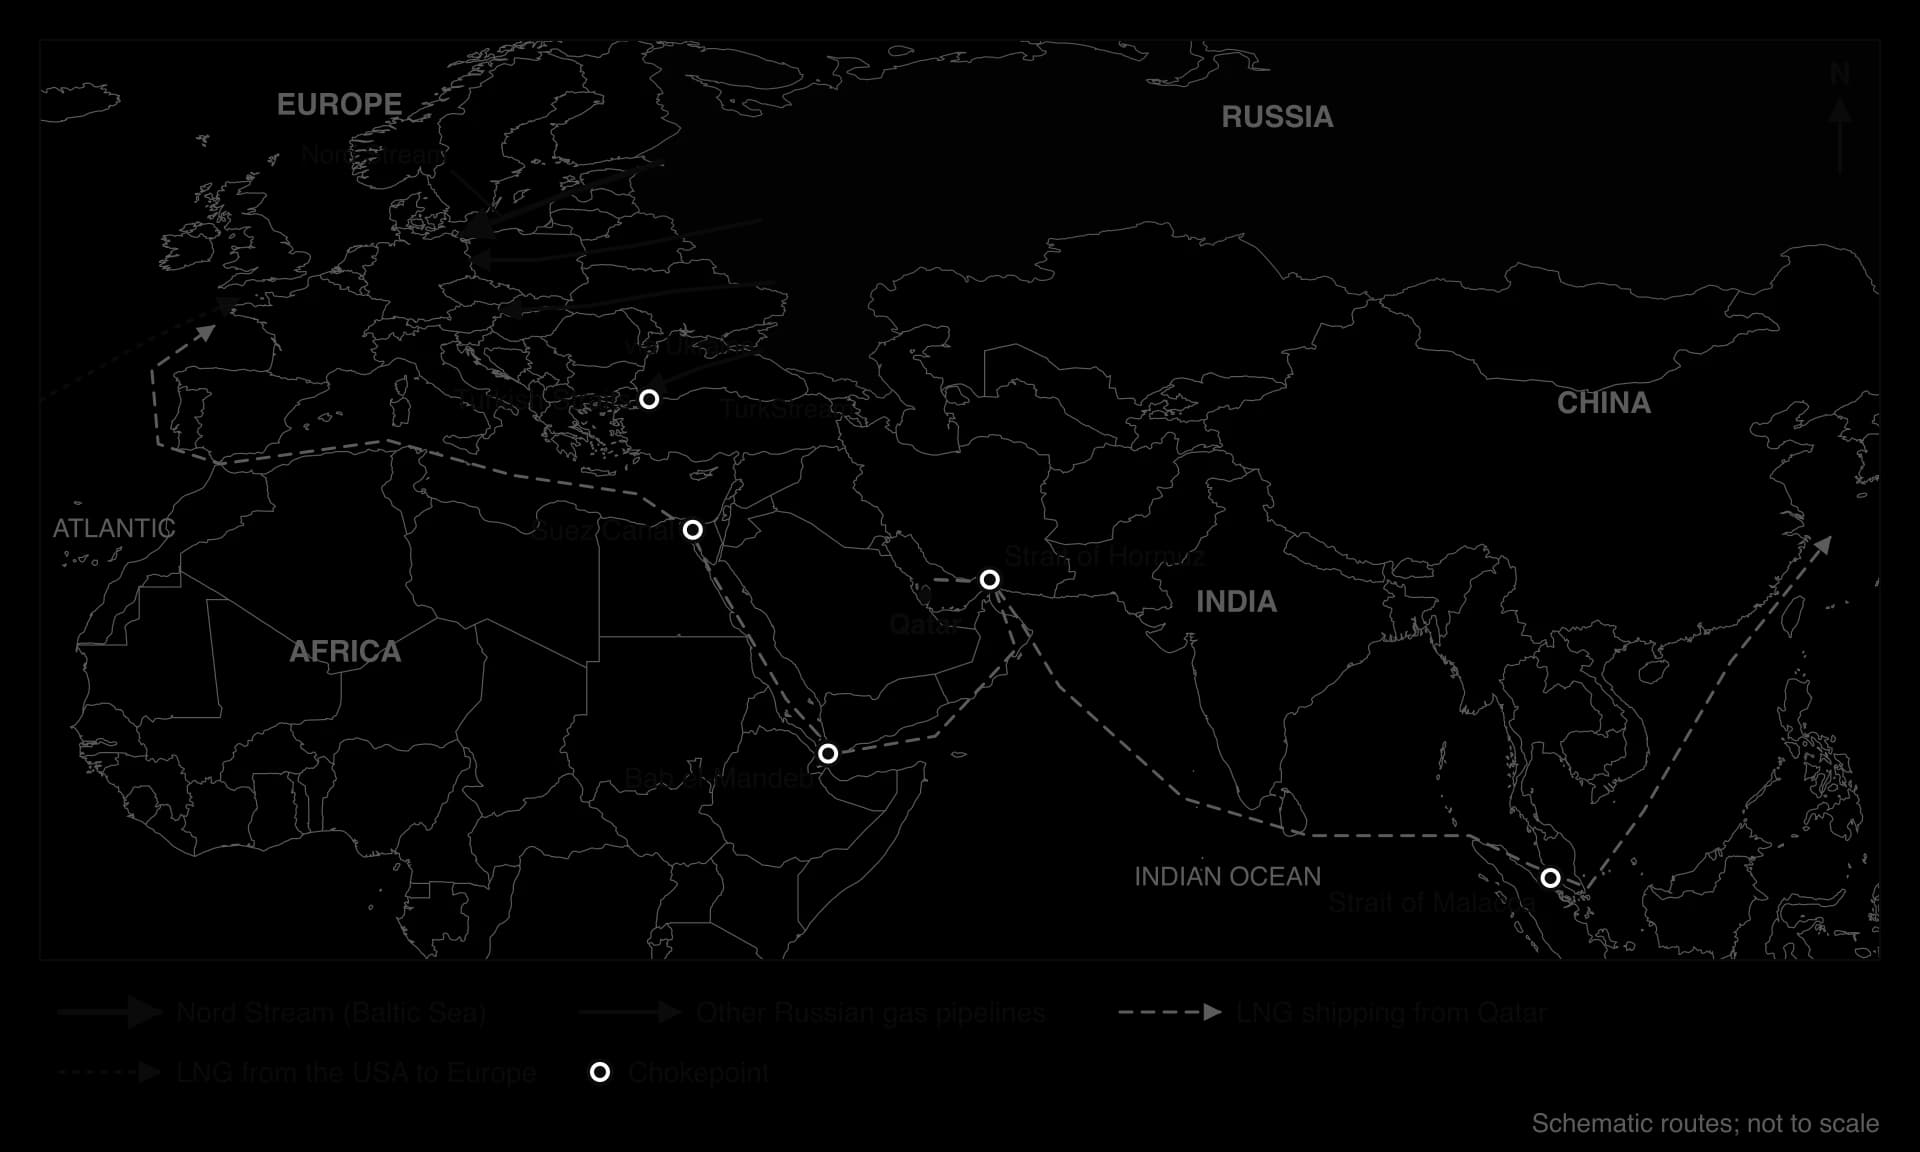
Some exporters have built pipelines that bypass chokepoints. The UAE’s Habshan–Fujairah oil pipeline, opened in 2012, carries up to about 2 million barrels a day to a terminal on the Gulf of Oman, outside Hormuz, and Saudi Arabia can pipe crude oil across the country to the Red Sea. LNG cannot be piped in this way: it must be shipped, so Qatar’s gas exports have no alternative to the strait.
Geopolitics and energy
Geopolitics is the study of how geography, including location, territory and natural resources, influences relations of power between states. Energy is central to geopolitics because supplies are concentrated in a few places, pathways cross borders and seas, and exporters and importers can each put pressure on the other. Producer groups such as the Organization of the Petroleum Exporting Countries (OPEC) also influence prices by agreeing how much oil to produce.
Russian gas and Europe since 2021
In 2021 the European Union imported 155 billion cubic metres of gas from Russia, about 45% of its gas imports, through pipelines including Nord Stream under the Baltic Sea, routes across Belarus and Ukraine, and TurkStream under the Black Sea. After Russia’s invasion of Ukraine in February 2022, Russia cut supplies to several EU countries, starting with Poland and Bulgaria in April 2022 when they refused to pay in roubles, and reduced Nord Stream 1 to 40% of its capacity in June. On 26 September 2022, underwater explosions damaged three of the four Nord Stream pipes, and Russia delivered only about 60 billion cubic metres to the EU that year.
Europe replaced most of this gas with LNG from the USA, Qatar and other suppliers, more gas from Norway (including the Baltic Pipe to Poland from September 2022), lower demand and full storage. Transit of Russian gas through Ukraine ended on 1 January 2025 when the contract between Gazprom and Ukraine’s Naftogaz expired, and the EU has agreed to phase out Russian LNG imports by the start of 2027 and pipeline imports by late 2027. Hungary, which still imports Russian gas by pipeline, has opposed EU restrictions on it.
The episode shows energy security as a question of power between places. Russia used gas supplies as a means of pressure; the EU used its purchasing power to reshape its suppliers; and Ukraine used its control of a transit route. The shift to LNG has risks of its own. Between January and April 2026, a period that included the first two months of the Hormuz disruption, the EU imported a record volume of Russian LNG from the Yamal project in the Arctic, about 98% of the project’s exports, which shows how hard full independence from Russian energy is.
Strategies for energy security
Strategy | How it improves security | Limitations |
|---|---|---|
Diversify suppliers and routes | No single supplier or chokepoint can cut supply; new LNG terminals allow imports from many countries | LNG is more expensive than pipeline gas; new terminals take years to build |
Strategic stocks and storage | IEA members hold oil stocks equal to at least 90 days of net imports to cover short disruptions | Covers weeks or months, not years; storage is costly |
Develop domestic resources (gas fields, shale, coal) | Reduces imports and earns revenue | Fields decline; fossil fuels raise emissions; new projects can be delayed |
Renewables and nuclear power | Wind, solar and hydro use domestic flows of energy that cannot be blockaded; no fuel to import | Variable output needs storage and grids; hydro depends on rainfall; minerals for batteries are traded too |
Reduce demand (efficiency, insulation) | The cheapest and most secure energy is energy not used | Slow; depends on investment by households and firms |
No single strategy is enough. Diversification and stocks deal with short-term shocks; domestic renewables and lower demand deal with long-term security and also cut emissions, which links energy security to mitigation of climate change. Renewables do not remove every risk, however, because hydropower depends on rainfall and solar panels and batteries depend on minerals mined and processed in a few countries.
Climate change and the nexus
Global climate change adds pressure to every part of the nexus at once. Higher temperatures raise evaporation and the water needs of crops, people and livestock; changing rainfall makes river flows less reliable; and more frequent drought and heatwave events strike water, food and energy systems in the same season. Because the three are linked, a climate shock to one resource spreads to the others.
Water: less reliable supply
Many of the world’s great rivers, including the Indus, Ganges and Yangtze in Asia and rivers fed from the Andes, depend on snow and glacier melt in the dry season. Glacier retreat first increases summer flows as more ice melts, then reduces them as the glaciers shrink, threatening the water supply of irrigated farming and cities downstream. Higher temperatures also raise evaporation from reservoirs and soils, so that the same rainfall leaves less water in rivers.
Energy: hydropower and cooling water
Hydropower depends directly on rainfall. Zambia generates more than 80% of its electricity from hydropower, much of it at the Kariba Dam on the Zambezi, which it shares with Zimbabwe. During the El Niño-linked drought of 2023–24, the worst in decades, Lake Kariba rose by less than 30 cm in the rainy season, when it normally rises about 6 m, and Zambia’s power company cut supplies to households and businesses for most of each day. Electric irrigation pumps, water-treatment works and mines all depend on the same grid, so the energy shock also affected food and water supplies.
Thermal and nuclear power stations need large volumes of cool water. Most of France’s nuclear power stations draw their cooling water from rivers, and the government limits the temperature of the water they return to protect river ecosystems. In the hot, dry summer of 2022, low and warm rivers forced several plants to cut output. Combined with repairs for corrosion at other reactors, this brought French nuclear generation to its lowest level since 1993, at a time when Europe was already short of gas.
Food: yields, irrigation and energy demand
Heat stress during flowering and drought during the growing season reduce yields of wheat, maize and rice, and higher temperatures increase the water that crops lose through evapotranspiration. Farmers respond by irrigating more, which raises the demand for water and for the energy to pump it. Climate shocks in major exporting regions also raise world food prices: the 2022 heatwave in India cut its wheat harvest, and India banned wheat exports on 13 May 2022, in the same year that the war in Ukraine disrupted Black Sea grain exports.
Mitigation choices that affect the nexus
Policies to cut greenhouse gas emissions can strengthen or weaken the nexus, so climate mitigation and resource security have to be planned together.
Mitigation choice | Effect on the nexus | Judgment |
|---|---|---|
Biofuels to replace petrol and diesel | Compete with food for land, water and fertiliser; can raise food prices | A trade-off unless made from wastes or grown on land unsuitable for food |
Large hydropower dams | Low-carbon power and water storage, but flood farmland, displace people and change flows downstream; output falls in drought | Useful but vulnerable to climate change itself |
Solar and wind power | Use almost no water once built; solar can power irrigation and desalination | Mostly a synergy, but solar pumps need limits on groundwater use |
Carbon capture and storage | Needs extra energy and water to run | Adds to demand on both |
Adapting through integrated planning
Adaptation to climate change works best when water, food and energy planners act together. Examples include planning reservoirs for both irrigation and hydropower, with rules on how much water to release in dry years; spreading electricity sources so that one drought cannot cut most of the supply; using treated wastewater for irrigation; and choosing crops that need less water. Integrated planning is difficult in practice, because each resource is usually managed by a different ministry, company or country, with different priorities.
Why priorities for resource security differ
Different places and stakeholders rank the three securities differently, according to what they lack, what they can afford and who holds power over supplies. A government’s priority is usually to avoid national shortages and price shocks; a household’s priority is daily access at a price it can pay; an exporter’s priority is the security of its markets and routes rather than of its own supply.
Place or stakeholder | Main insecurity | Typical priority and response |
|---|---|---|
Singapore (import-dependent city-state) | Almost no farmland, little catchment land, no fossil fuels | Diversify suppliers; store and recycle water; raise local food output (“30 by 30”) |
Qatar (hydrocarbon exporter in a desert) | Water and food; one sea exit for its exports | Buy security with gas revenue: desalination, storage, domestic dairy |
Egypt (populous, river-dependent MIC) | Water from upstream, wheat imports, declining gas | Keep bread affordable; secure gas imports; protect Nile flows |
Norway (resource-rich HIC) | Very little: 70,000 m³ of renewable freshwater per person and large energy exports | Long-term sustainability; managing export revenue |
Zambia (hydro-dependent LMIC) | Electricity in drought years | Diversify power sources; protect maize harvests |
A household in an informal settlement | Daily water and cooking fuel | Cost and distance of water; price of fuel and bread |
Priorities also change with the scale at which security is judged. A national government may count a new gas export terminal as a gain in energy security because it earns foreign currency, while nearby households still cook with wood because they cannot afford gas. A city may secure its own water by piping it from a rural basin, reducing water security for farmers there. Security for one group can therefore mean insecurity for another, which raises questions of equity.
Egypt: low and falling resource security
Egypt is a lower-middle-income country of 116.5 million people (2024) with a GDP per capita of US$3,338. Almost all of its fresh water comes from the Nile, which rises in upstream countries; its internal renewable freshwater is only about 9 m³ per person a year, and its water stress was 141% in 2022.
Agriculture uses most of the water, but only about 3% of Egypt’s land is arable, so the country imports large amounts of wheat and maize, mainly from Russia and Ukraine, to make the subsidised bread that most families rely on. Moderate or severe food insecurity affected 29.9% of the population in 2024, and undernourishment rose from 6.5% in 2019 to 8.4%.
Egypt’s energy security has swung sharply. The Zohr gas field, discovered by Eni in 2015 about 190 km north of Port Said, began production in December 2017, and by 2019 Egypt was again a small net exporter of energy. Output from Zohr then declined while demand for electricity grew; gas generated 84% of Egypt’s electricity in 2023. By 2024 net imports met 26.4% of energy use.
In 2023 and 2024 shortages of gas and of foreign currency led to scheduled power cuts of two hours or more a day, and the government reduced gas supplies to fertiliser factories, a direct link from energy insecurity to food production. Cuts were suspended from 21 July 2024 after imported LNG cargoes arrived, and in February 2025 Egypt agreed a US$3 billion deal with Shell and TotalEnergies for 60 LNG cargoes.
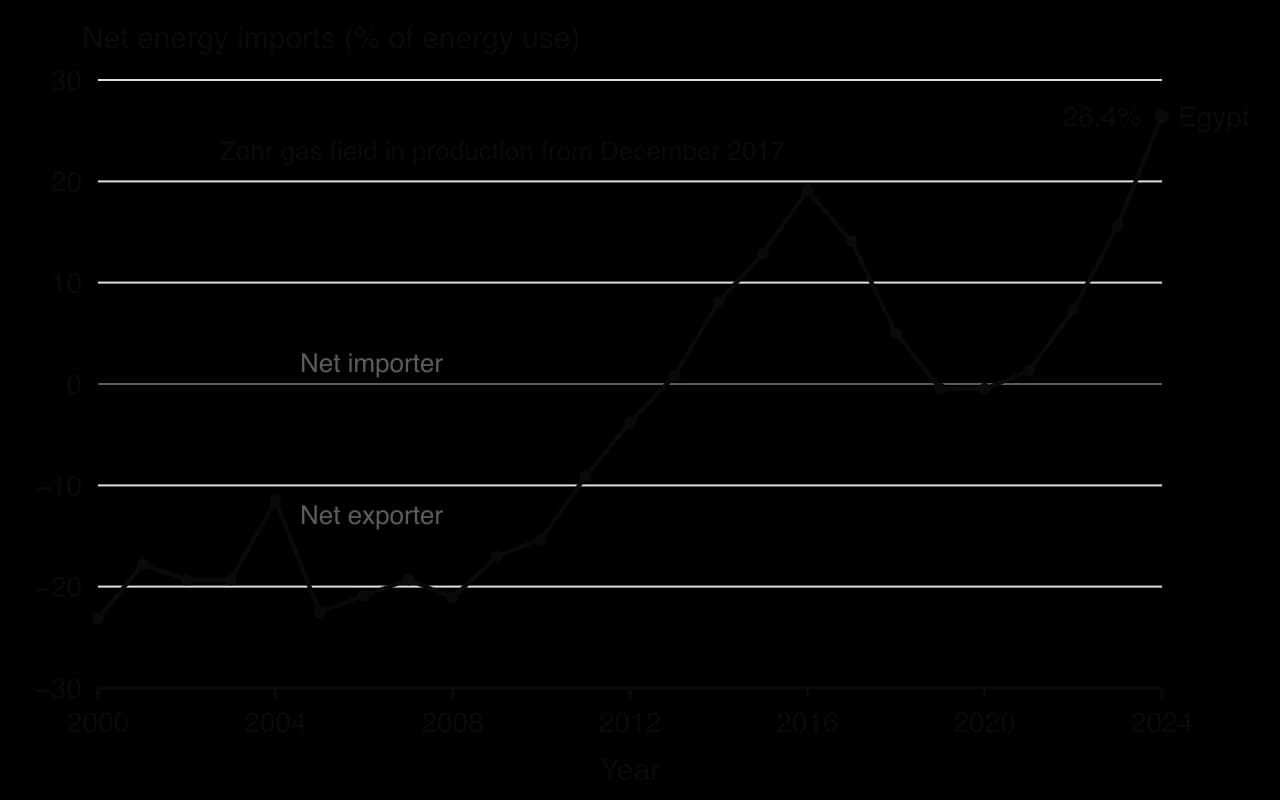
Egypt shows how the three securities reinforce one another in a negative direction. Dependence on upstream water and on imported grain means that a rise in world wheat prices, a fall in the value of the Egyptian pound or a gas shortage hits the same households at once. The Grand Ethiopian Renaissance Dam upstream adds uncertainty about future Nile flows. Egypt’s responses (gas imports from Israel and Cyprus, LNG purchases, new solar and wind farms, and a nuclear plant at El Dabaa under construction with Russia) diversify supply but increase its dependence on foreign partners and finance.
Sources: World Bank, World Development Indicators (FAO AQUASTAT, IEA, FAO), 2026; Bloomberg and Reuters reports on load shedding, July 2024.
Disposal and recycling of consumer items
Rising consumption produces rising amounts of waste. Municipal solid waste (MSW) is the everyday rubbish collected from households, shops, offices and public places: food and garden waste, paper and card, plastics, glass, metals, textiles and old appliances. Waste per person rises with income, because richer people buy more packaged goods, electronics and clothing and replace them sooner.
Estimates of the total differ. The UN Environment Programme’s Global Waste Management Outlook 2024 estimated 2.3 billion tonnes of MSW in 2023, rising to 3.8 billion tonnes by 2050 without action. The World Bank’s What a Waste estimates put generation at 2.56 billion tonnes in 2022 and about 3.86 billion tonnes in 2050 under business as usual. Collection is far from complete: only 31% of waste was collected in sub-Saharan Africa and 67% in South Asia, where most of the rest is dumped or burned in the open.
Methods of disposal
Method | What happens | Advantages | Disadvantages |
|---|---|---|---|
Open dumping and burning | Waste is left or burned on uncontrolled land | No cost to the authority | Toxic smoke, disease, blocked drains and flooding, plastic pollution of rivers and seas |
Sanitary landfill | Waste is buried in lined cells, compacted and covered daily | Cheap where land is available; controlled | Uses land; methane emissions unless captured; leachate can pollute groundwater |
Incineration (energy from waste) | Waste is burned at high temperature; heat makes electricity | Cuts volume by 80–95%; produces energy | Expensive; emits CO₂ and needs strict filters; ash must be landfilled |
Recycling and composting | Materials are reprocessed into new products; organic waste becomes compost | Saves raw materials and energy; creates jobs | Needs separation and markets; some materials degrade; contamination |
Reuse and repair | Products are used again, repaired or refurbished | Saves the most energy and materials | Needs repairable design, spare parts and skills |
A landfill is the most common destination for collected waste in many countries. Modern sanitary landfills reduce pollution, but they still release methane, a strong greenhouse gas, as food and paper decay without oxygen, and they need new land as they fill.
Recycling keeps materials in use instead of burying them. It works best for materials that can be separated cleanly and that keep their quality when reprocessed, such as aluminium, steel, glass and paper; many plastics can be recycled only a few times, or not at all when they are mixed or dirty.
The waste hierarchy
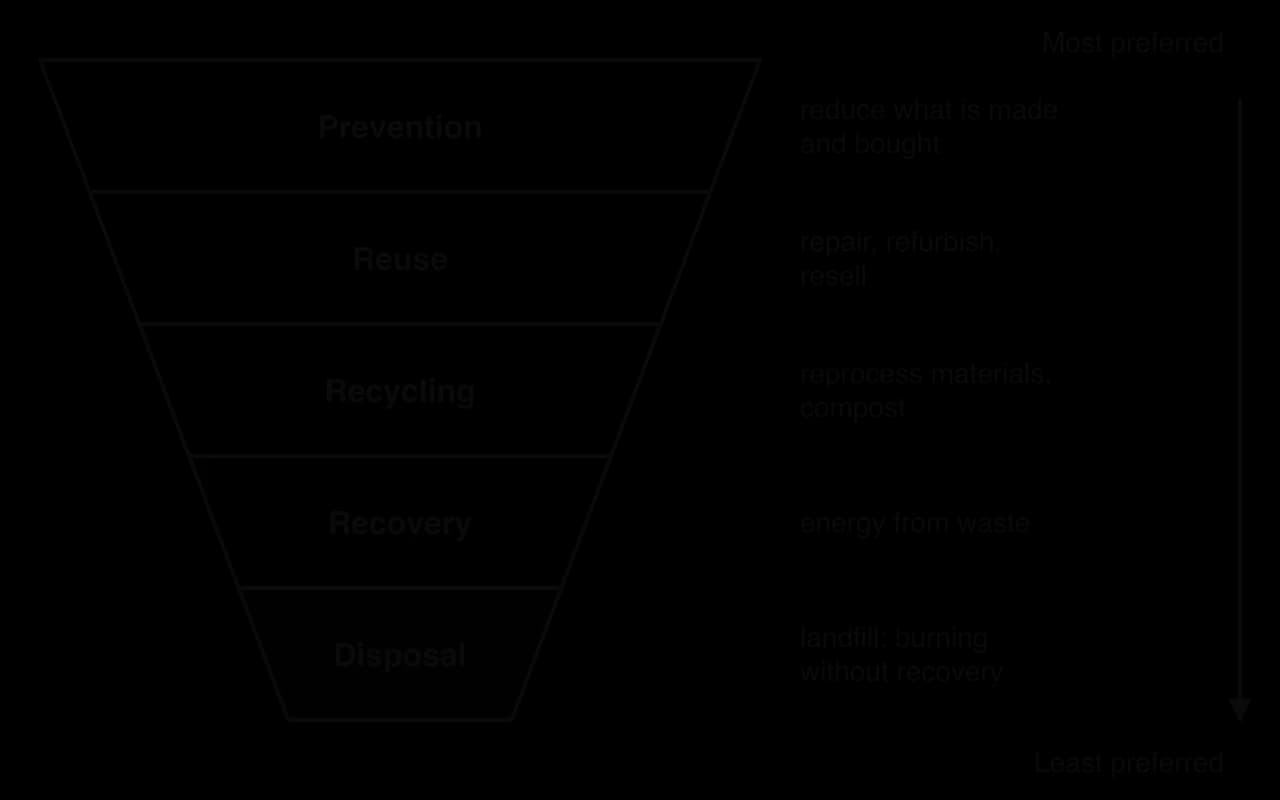
The waste hierarchy ranks ways of managing waste from the most to the least preferred for the environment. It is usually drawn as an inverted triangle, with prevention at the top and disposal at the bottom. The European Union’s Waste Framework Directive uses it as the basis of waste law, and the same idea lies behind the slogan “reduce, reuse, recycle”.
E-waste and planned obsolescence
E-waste is discarded electrical and electronic equipment: phones, computers, televisions, fridges, cables and batteries. It contains valuable metals such as copper, gold and cobalt, but also hazardous substances such as lead, mercury and brominated flame retardants. A record 62 million tonnes of e-waste was generated in 2022, 82% more than in 2010, and only 22.3% was formally documented as collected and recycled. The total is projected to reach 82 million tonnes by 2030.
E-waste grows quickly partly because products are replaced before they wear out. Planned obsolescence is the practice of designing products to have a limited useful life, for example through batteries that cannot be replaced, parts that cannot be repaired, software that stops being updated or frequent changes of style. In 2015 France made planned obsolescence an offence, with fines of up to €300,000 and prison terms of up to two years, and the EU and several US states have passed right-to-repair laws that require spare parts and repair information.
International flows of waste
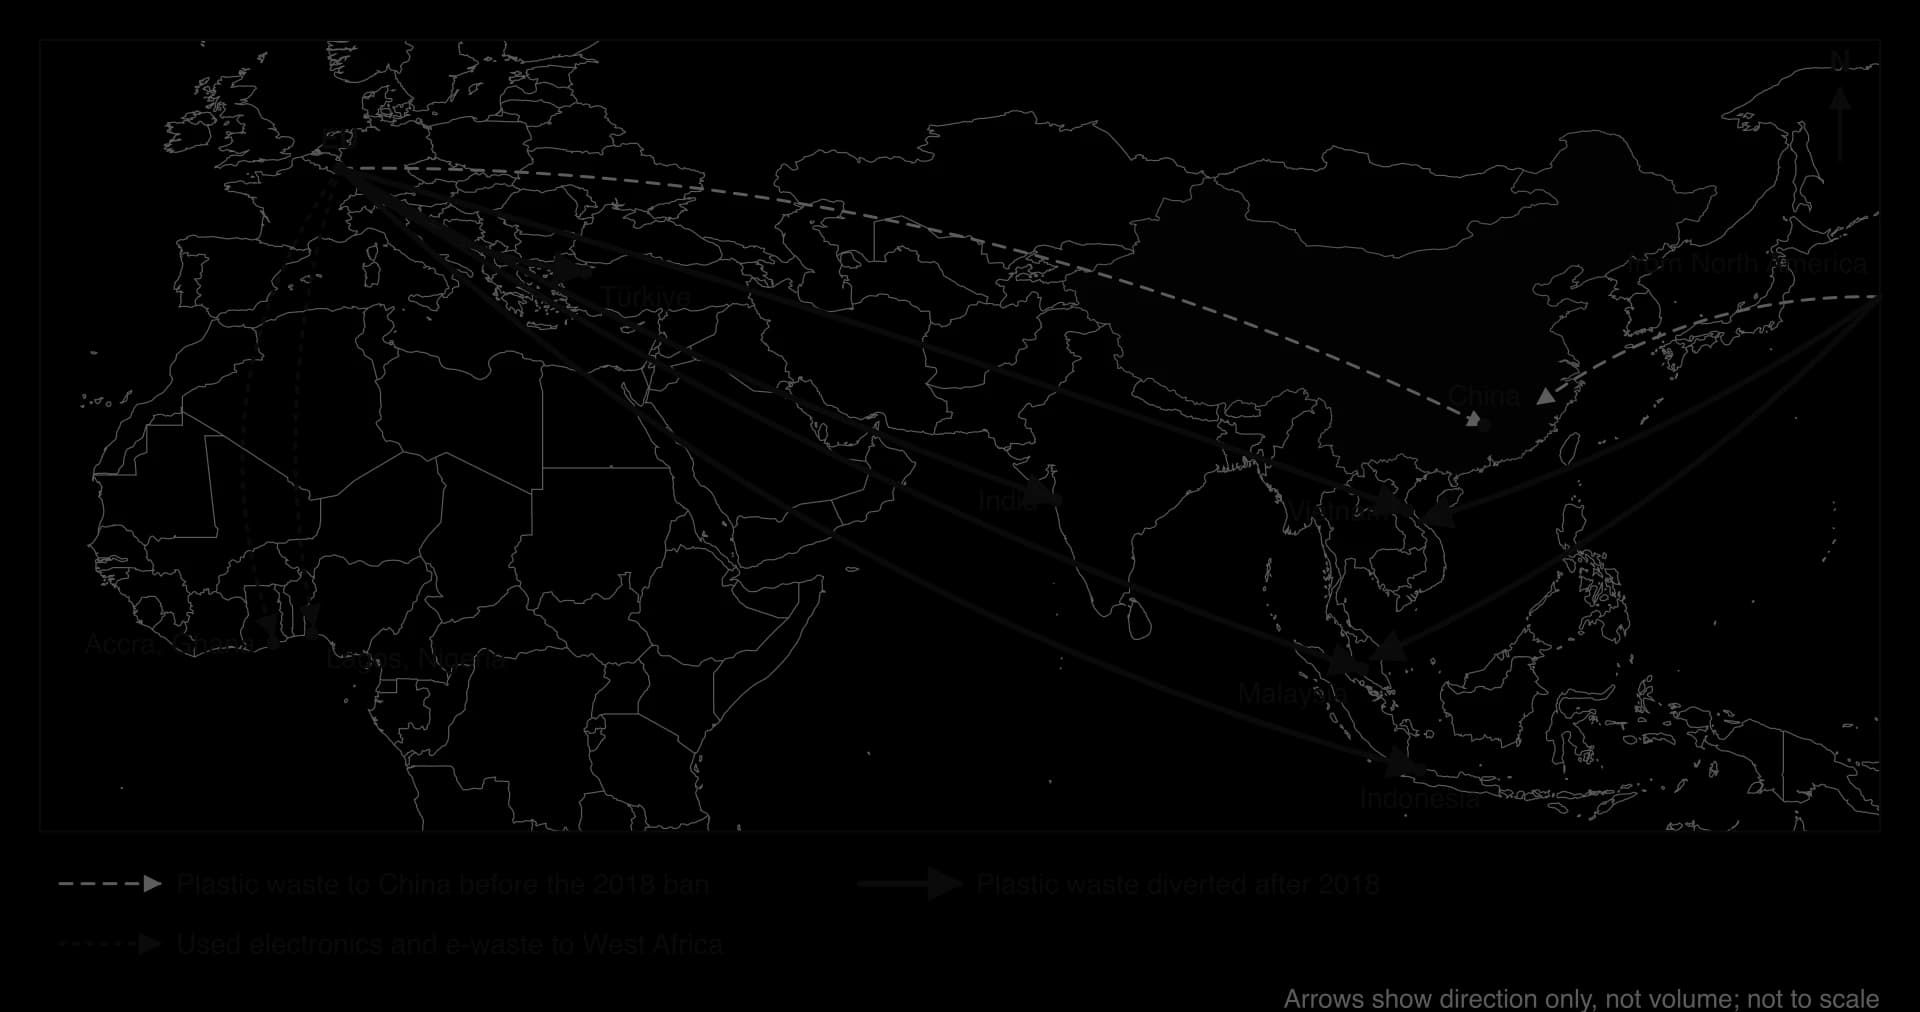
Waste is traded across borders like any other good. High-income countries export waste paper, scrap metal, plastics and used electronics, mainly to Asia and Africa, for three reasons: sorting and reprocessing are cheaper where wages are lower; factories in fast-growing economies want the materials; and exporting is cheaper than meeting strict domestic rules on landfill and incineration. Exported waste is counted as “recycled” in the exporting country’s statistics, whatever happens to it after it leaves.
China’s National Sword policy
For two decades China imported most of the recyclable waste collected in North America and Europe. Before its ban, about 95% of the plastics collected for recycling in the EU and 70% of the plastics exported from the USA were sent to mainland China and Hong Kong. Much of it was low-grade and contaminated, and what could not be recycled was dumped or burned, polluting air and water.
Under its Operation National Sword, China notified the World Trade Organization in July 2017 that it would ban imports of “foreign garbage”, and by 1 January 2018 it had banned 24 categories of solid waste and lowered the contamination allowed in recyclables to 0.5%. Chinese plastic imports fell by 99%. Exporters diverted waste to Malaysia, Vietnam, Indonesia, Türkiye and India, and by early 2019 several South-East Asian countries had begun to send contaminated containers back. In Europe and North America, some local authorities stockpiled waste or sent more of it to landfill and incineration.
The Basel Convention
The Basel Convention is the main international treaty controlling the movement of hazardous waste between countries. It was opened for signature on 21 March 1989, after cases in which ships from rich countries dumped toxic waste in poorer ones, and came into force on 5 May 1992. Exporters must obtain the prior informed consent of the importing country, and parties may not trade covered wastes with non-parties except under special agreements. By 2024 it had 191 parties; the United States signed it but has not ratified it.
In May 2019, after a petition signed by more than a million people, almost every country except the United States agreed to amend the convention so that mixed and contaminated plastic waste also needs the importing country’s consent. The Plastic Waste Amendments are now binding on 186 states. Enforcement is left to each party, however, and many parties do not submit their required national reports, so illegal shipments, often labelled as second-hand goods or clean scrap, continue.
Agbogbloshie, Accra: e-waste as livelihood and hazard
Agbogbloshie is a scrap district beside the Korle Lagoon near the centre of Accra, Ghana’s capital, next to the informal settlement of Old Fadama. For years it was described as one of the world’s largest e-waste sites. Workers, many of them young economic migrants from northern Ghana, take apart cars, appliances and electronics and burn the plastic coating off copper cables to sell the metal. Studies have found high levels of lead in the soil, released mainly by burning PVC cable insulation, with particular risks to workers and children.
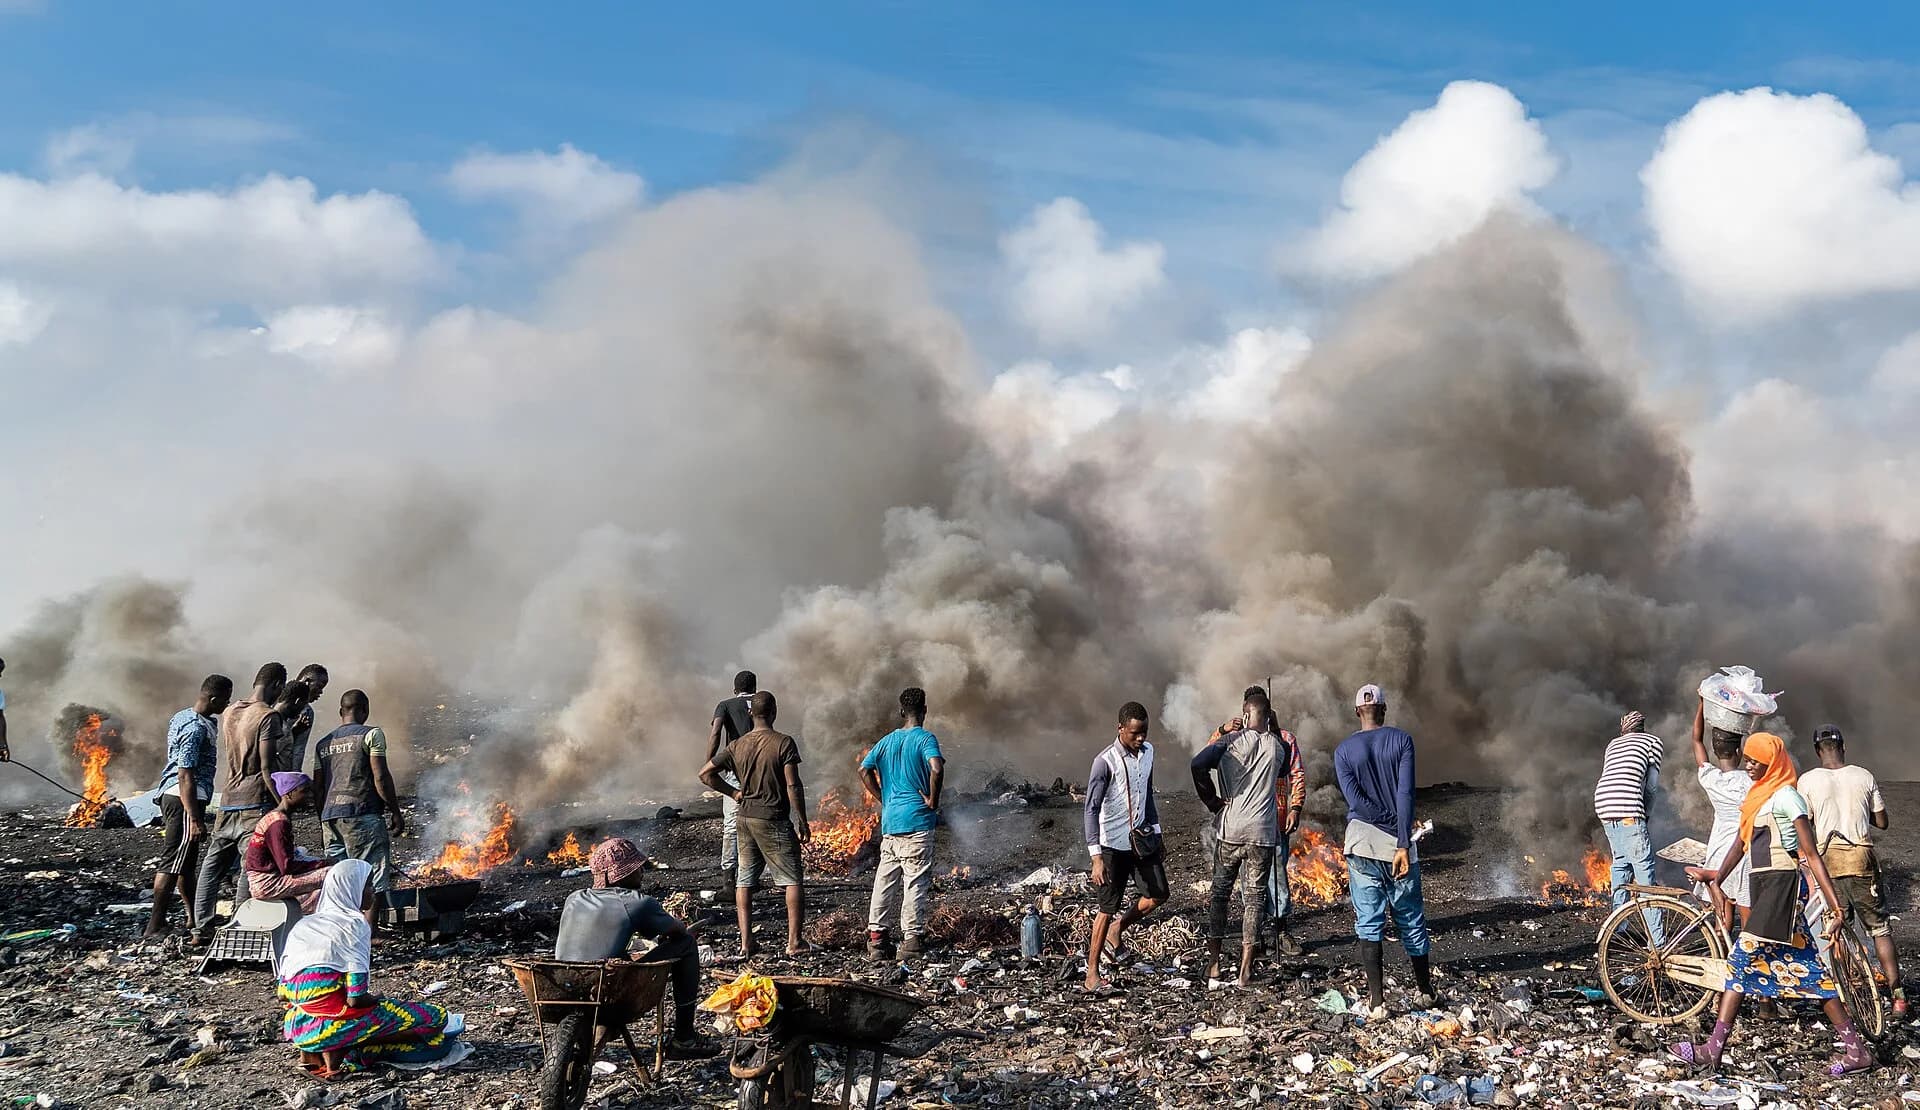
The site also shows the economic side of waste. Selling recovered copper, aluminium and iron gives an income to thousands of people with few other options, and repair and resale of used electronics is an important business in Ghana. In July 2021 the Ghanaian government demolished and cleared the scrap yard and settlement; scrap workers later returned to the area in 2025.
 YouTube
Evaluating waste exports: recycling or dumping?
Argument | Exports are recycling (benefits) | Exports are dumping (costs) |
|---|---|---|
Resources | Scrap metal, paper and clean plastic become raw materials for factories; fewer new resources are mined | Contaminated or mixed waste cannot be recycled and is burned or dumped |
Economy | Jobs and income for collectors, sorters, repairers and informal waste pickers | Low pay, no safety equipment, child labour; profits go mainly to traders |
Environment and health | Reuse of electronics extends their life | Toxic smoke, lead and dioxins; plastic leaks into rivers and the sea |
Equity and power | Importing countries choose to buy materials | Costs fall on poorer places with weaker regulation; exporters count the waste as “recycled” |
Regulation | The Basel amendments and import bans give receiving countries control | Weak enforcement; mislabelled shipments; the largest exporter of plastic waste, the USA, is not a party |
The evidence suggests that the answer depends on what is traded and where it goes. Clean, sorted materials sent to regulated factories are part of a genuine global recycling industry. Mixed plastic and broken electronics sent to places without safe processing move the environmental and health costs of consumption from rich to poor places. China’s ban, the Basel amendments and South-East Asian countries returning containers show that receiving countries have used their power to refuse waste, and the long-term solution is less waste and better recycling in the countries that produce it, higher up the waste hierarchy.
Case study: Qatar, resource security bought with gas wealth
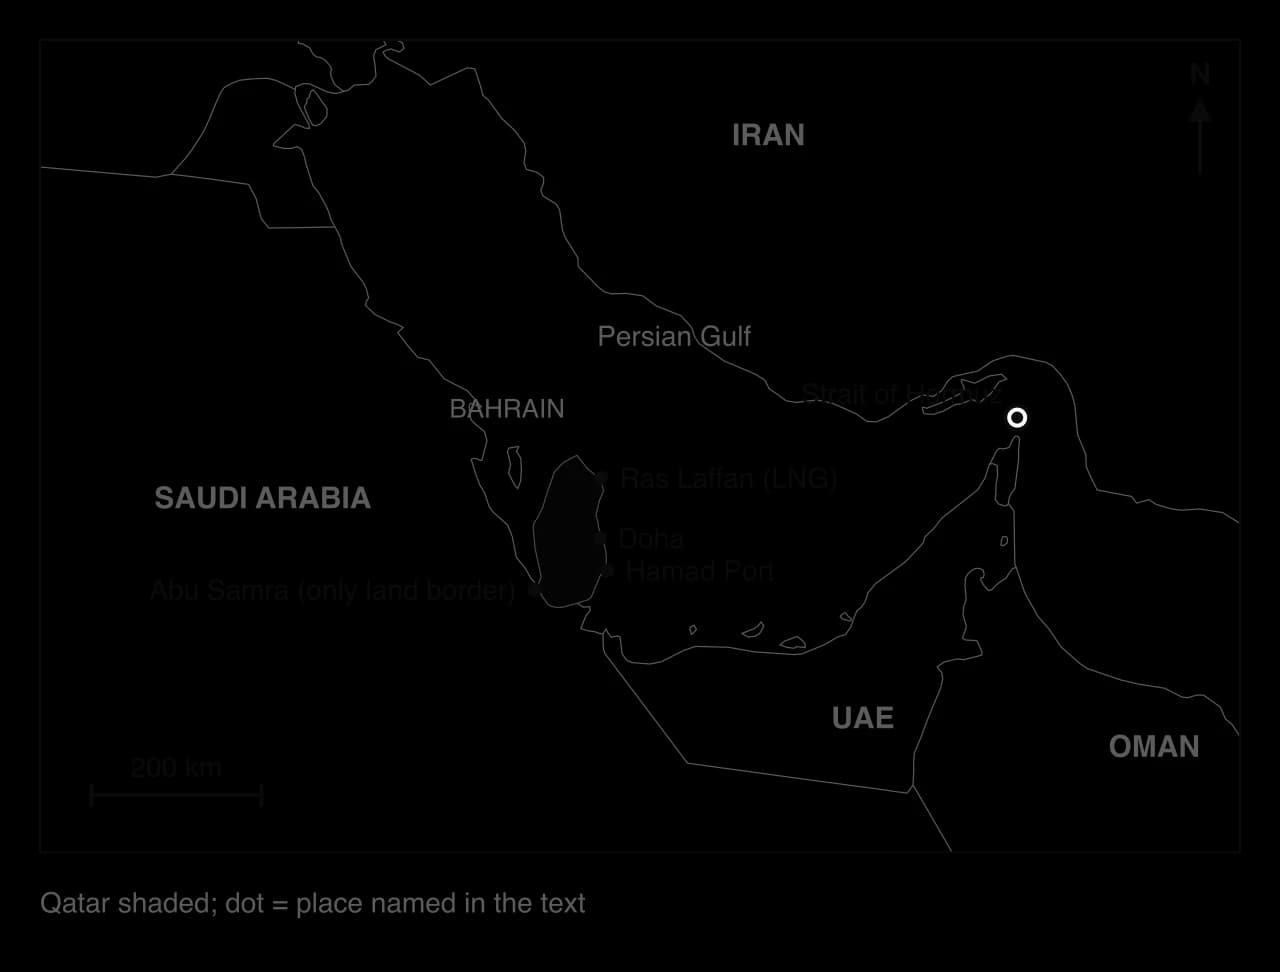
Qatar is a small peninsula on the Persian Gulf, about 11,600 km² in area, with a population of 2.86 million in 2024, most of them migrant workers. It shares its only land border with Saudi Arabia. It is one of the world’s driest countries and one of its richest: GDP per capita was US$75,685 in 2024, based on the vast offshore North Field gas reserve, which Qatar shares with Iran (where it is called South Pars). Qatar shows how a country can achieve high resource security without natural resources of water or food, and how that security depends on trade routes and politics.
Water: almost entirely manufactured
Qatar has no permanent rivers, and its internal renewable freshwater was only about 21 m³ per person in 2022, among the lowest in the world. Its water stress was 431%: it withdraws more than four times its renewable freshwater. Most groundwater is too mineral-rich to drink, and the aquifers in the north that support farming are being pumped so fast that saltwater is moving into them. Most of Qatar’s drinking water is therefore made by desalinating seawater, using energy from natural gas. Because gas is abundant and cheap, 95.3% of people used safely managed drinking water in 2024.
Food: the 2017–2021 blockade
Arable land covers less than 2% of Qatar, and before 2017 the country imported almost all of its food. At that time nearly 80% of its food came from its Gulf Arab neighbours, and only about 1% was produced at home. On 5 June 2017 Saudi Arabia, the United Arab Emirates, Bahrain and Egypt cut diplomatic ties with Qatar, closed the land border and their airspace to Qatari aircraft, and told their ports not to receive Qatari ships. Residents rushed to stockpile food.
Qatar responded by using its wealth and its other trade relations. Food arrived by sea and air instead of by road: Iran sent daily shipments of fruit, vegetables and meat, and Türkiye pledged food and water. Most visibly, the dairy company Baladna, with state support, bought 3,400 cows and began milking them in July 2017. Its farm now holds about 22,000 cows, fed on hay imported from Asia, Europe and Africa, and supplies over 85% of Qatar’s fresh dairy products; the country became self-sufficient in fresh milk by 2019. The dispute ended with the al-Ula declaration on 5 January 2021.
The dairy farm is self-sufficiency of an unusual kind. The cows’ feed is imported and their water is desalinated, so each litre of milk depends on imported fodder and on gas-powered water and electricity. Qatar therefore became more independent of its neighbours while remaining dependent on world markets and on energy.
Energy: a giant exporter with one exit
Qatar began exporting liquefied natural gas to Japan in 1996 and became one of the world’s largest LNG suppliers. Its net energy “imports” were −395% of its energy use in 2024, meaning it exports about four times as much energy as it uses. Before the 2026 war, QatarEnergy planned to expand its LNG capacity from 77 million tonnes a year to about 110 million tonnes in 2026 and about 126 million tonnes from 2028. Gas revenue pays for the desalination plants, food imports and storage on which water and food security depend.
All of this trade must leave the Gulf through the Strait of Hormuz. After the USA and Israel began air strikes on Iran on 28 February 2026, Iran warned ships that they could not pass the strait. QatarEnergy stopped gas production on 2 March and declared force majeure on its gas contracts on 4 March, the day Iran announced that the strait was closed. Europe had obtained 12–14% of its LNG from Qatar, and the disruption also cut supplies of helium and fertiliser from the Gulf, raising food production costs far from the region.
The strait stayed largely blocked through most of 2026. A ceasefire agreed on 8 April was meant to reopen it, and on 17 April Iran said it would allow commercial shipping, but restrictions were soon reimposed. In July, after an interim truce broke down, LNG tankers carrying Qatari cargoes were struck, and on 7 October a tanker was attacked off the northern coast of Qatar. On 25 September 2026 Iran’s foreign minister said that reopening the strait depended on the United States.
Qatar and Egypt compared
Indicator (year) | Qatar | Egypt |
|---|---|---|
Population (2024) | 2.86 million | 116.5 million |
GDP per capita, current US$ (2024) | 75,685 | 3,338 |
Internal renewable freshwater per person (2022) | 21 m³ | 9 m³ (but Nile inflow from upstream) |
Water stress, withdrawal as % of available freshwater (2022) | 431% | 141% |
People using safely managed drinking water (2024) | 95.3% | 78.9% |
Arable land, % of land area (2023) | 1.8% | 3.2% |
Moderate or severe food insecurity (2024) | No data | 29.9% |
Net energy imports, % of energy use (2024) | −395% (large exporter) | 26.4% (importer) |
The table shows two countries with similar physical shortages of water and farmland but very different resource security. The difference lies in wealth and power: Qatar can afford to manufacture water, import and store food and fly in cows, while Egypt, with forty times as many people and about one twenty-third of the income per person, struggles to pay for wheat and gas imports when prices rise. Qatar’s security is high but brittle: it rests on one export product and one sea route, and its consumption per person is very high, while Egypt’s insecurity is chronic but its population has long experience of coping with shortages.
Key concept | How the Qatar case shows it |
|---|---|
Place | A desert peninsula with almost no water or farmland but huge gas reserves; its only land border and its only sea exit both lie under the control of neighbours |
Power | Neighbours used control of the land border to put pressure on Qatar in 2017; Qatar used gas revenue and new alliances to break the blockade; Iran’s closure of Hormuz in 2026 halted its exports |
Process | Desalination and imported fodder turn energy into water and food: the nexus in action |
Possibility | More LNG capacity, solar-powered desalination and greater storage could raise security, but dependence on one strait is hard to remove |
How far is Qatar’s dairy self-sufficiency a gain in food security, given that the feed is imported?
Suggest why the 2026 closure of the Strait of Hormuz threatened Qatar’s water and food security as well as its energy exports.
To what extent could Egypt follow Qatar’s strategy of buying resource security?
Sources: World Bank, World Development Indicators (FAO AQUASTAT, IEA, WHO/UNICEF JMP, UN WPP), 2026; Wikipedia articles “Qatar diplomatic crisis”, “Baladna”, “Economy of Qatar” and “2026 Strait of Hormuz crisis”, read October 2026.
Exam practice
Paper 2 tests this content in three ways. Section A sets a structured question on a stimulus from Unit 3 (describe, suggest, explain); Section B may use an infographic on resources or waste; and Section C offers essays that reward synthesis across the core, for example between climate change, population and resource security.
Section A: structured question
The stimulus is the line graph of Egypt’s net energy imports as a percentage of energy use, 2000–2024, drawn with the Egypt example. Values below zero show net exports.
Part (b) moves from the graph to reasons. The question does not name Egypt, so any well-developed reason earns credit, but a named example strengthens the development.
Part (c) asks for links within the nexus, so each way must connect an energy problem to a food outcome.
Section B: infographic
An infographic on e-waste shows: “62 million tonnes of e-waste generated in 2022”; a pie chart in which 22.3% is labelled “formally documented as collected and recycled” and the rest “fate unknown”; an arrow labelled “82 million tonnes by 2030”; a world map with arrows from Europe to West Africa labelled “used electronics”; and a photograph of young men burning cables on blackened ground in Accra, Ghana, under thick smoke.
The (a) parts test reading the figures accurately; part (b) asks for an interpretation of the photograph, linked to what it shows.
The 6-mark part (c) needs points on both sides, each taken from the infographic, and an overall appraisal of how far the evidence goes.
Section C: extended answer
Summary
Resource security means reliable access to enough water, food and energy of acceptable quality at an affordable price, and it looks different at household, national and global scales.
The water–food–energy nexus links the three: water for food and energy, energy for water and food, and land for biofuels; decisions create trade-offs (Punjab’s free power, biofuels in 2007–08) or synergies.
Water security is measured by access to safely managed drinking water (2.1 billion people lacked it in 2024) and, nationally, by water stress.
Food security has four pillars; food availability depends on production, imports and stocks, and about 8% of the world’s people were undernourished in 2024.
Energy security depends on pathways and chokepoints such as the Strait of Hormuz, and on geopolitics, as Europe’s loss of Russian gas after 2022 showed.
Climate change stresses every node and link: drought cut hydropower in Zambia in 2024 and heat cut nuclear output in France in 2022.
Priorities differ between places and scales; Qatar buys high but fragile security with gas wealth, while Egypt’s water, food and energy insecurity reinforce one another.
Waste grows with income (about 2.3 billion tonnes of MSW in 2023; 62 million tonnes of e-waste in 2022); the waste hierarchy ranks prevention above reuse, recycling, recovery and disposal.
International waste flows shifted after China’s 2018 ban; the Basel Convention and its plastic amendments give importing countries control, but enforcement is weak.
Self-check
- To do:
I can describe the water–food–energy nexus as a system and explain one trade-off and one synergy with named examples.
- To do:
I can distinguish water security, food security and energy security, and give a measure for each.
- To do:
I can explain how energy pathways, chokepoints and geopolitics affected energy security in Europe after 2022 and in the Gulf in 2026.
- To do:
I can explain how climate change affects each part of the nexus, using Zambia and France.
- To do:
I can examine why priorities for resource security differ between Qatar, Egypt, Singapore and a poor household.
- To do:
I can describe waste trends, the methods of disposal and the waste hierarchy, and construct a compound bar chart of disposal data.
- To do:
I can evaluate whether international flows of waste are recycling or dumping, using National Sword, the Basel Convention and Agbogbloshie.
- To do:
I can compare the resource security of Qatar and Egypt using real data.