Explain the benefits of international trade, draw and analyse free trade diagrams for importing and exporting countries, and (HL) use absolute and comparative advantage to show the gains from specialisation.
Each is in the Economics glossary, with every other term in the subject.
The ability of a country to produce more of a good than another country using the same quantity of resources, or the same output with fewer resources.
The situation in which a country does not trade with other countries and consumes only what it produces itself.
The ability of a country to produce a good at a lower opportunity cost, in terms of other goods given up, than another country.
The equilibrium price in a country's market without international trade, set where domestic demand equals domestic supply.
The quantity and quality of the factors of production a country has, such as land, natural resources, labour, skills and capital, which shape its comparative advantage.
Foreign currencies, which a country earns mainly from exports and inflows of capital and needs in order to pay for imports and foreign debts.
International trade that takes place without government-imposed barriers such as tariffs, quotas, subsidies or administrative restrictions.
The increase in total output and consumption that countries obtain when they specialise according to comparative advantage and trade with each other.
Explain the main benefits of international trade for consumers, producers and the economy as a whole.
Explain how a world price below the domestic price leads to imports, and draw the free trade diagram for an importing country.
Explain how a world price above the domestic price leads to exports, and draw the free trade diagram for an exporting country.
Explain who gains and who loses when a country opens its market to trade.
Calculate the quantity of imports and exports, import expenditure and export revenue from a free trade diagram (HL).
Distinguish between absolute and comparative advantage, and calculate opportunity costs from data to identify comparative advantage (HL).
Draw linear PPC diagrams to show the gains from specialisation and trade, and explain the sources of comparative advantage (HL).
Evaluate the theory of comparative advantage by examining its assumptions and limitations (HL).
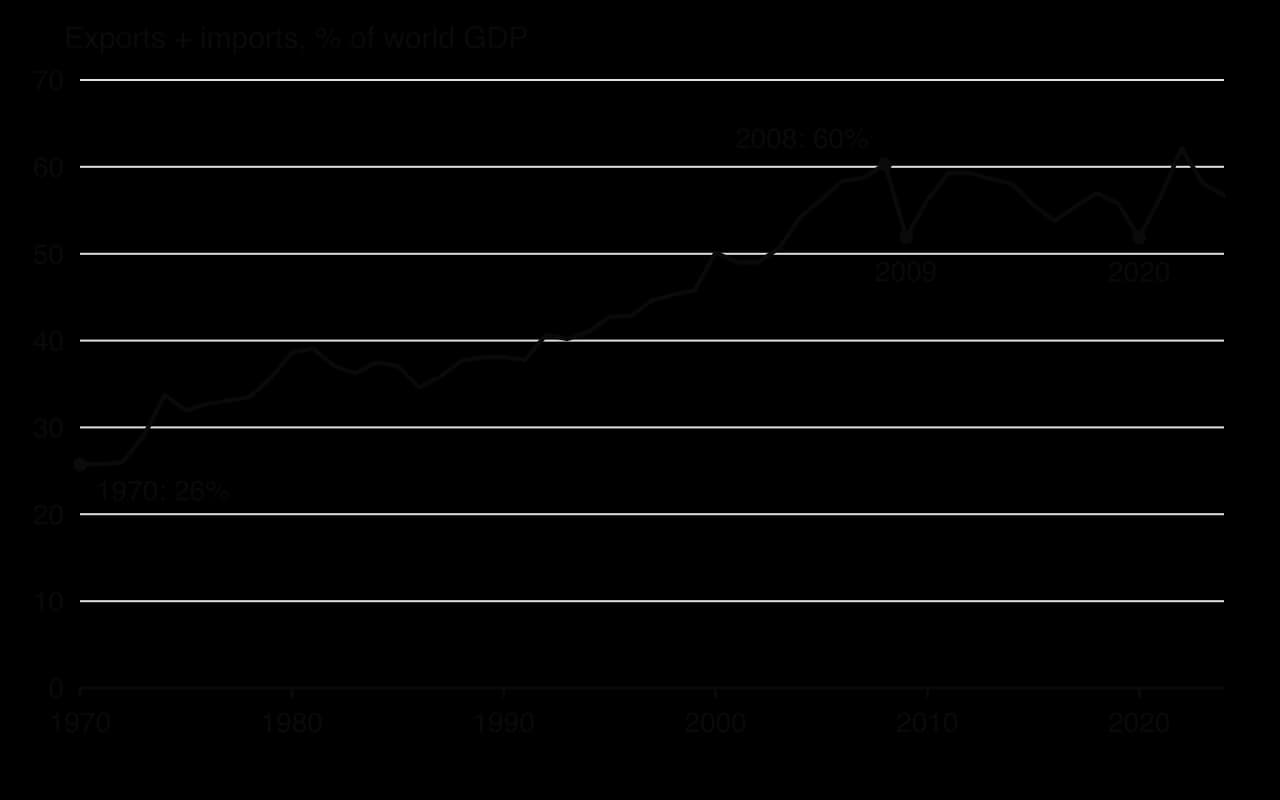
International trade is the exchange of goods and services across national borders. Almost everything people use, from phones and medicines to the fuel that moves food to shops, contains parts or materials that crossed at least one border, and in 2024 exports and imports together were equal to about 57% of world output.
Trade connects the key concepts of the course. It is the clearest example of interdependence, because a decision taken in one country changes prices, jobs and incomes in others. It raises efficiency by letting each country use its scarce resources for what it produces best, which eases the problem of scarcity. The gains, however, are not shared equally, so trade also raises questions of
99 exam-style questions on this subtopic, written in the style of the IB papers. The first has its markscheme open. Counted on
The production possibilities curve (PPC) is a model built on a set of simplifying assumptions.
Explain why a production possibilities curve (PPC) may be drawn as a straight line in some cases and as a curve bowed outward from the origin in others.
10 marks
Answers may include:
Terminology: definitions of PPC, opportunity cost, constant opportunity cost, increasing opportunity cost; assumptions of the model (two goods, fixed quantity and quality of resources, fixed technology, full and efficient use of resources, a given time period).
Explanation: the slope of the PPC measures the opportunity cost of one good in terms of the other; if resources are equally suited to producing both goods (perfectly adaptable), each unit of one good always costs the same amount of the other, giving a straight-line PPC with constant opportunity cost; in reality resources are specialized, so as production of one good rises, increasingly less suitable resources must be transferred and the opportunity cost rises, giving a concave (bowed-outward) PPC; the straight line is a simplification often used when comparing countries' opportunity costs.
Diagram: two PPC diagrams: a straight-line PPC with equal sacrifices of good Y for equal increases in good X; a concave PPC with increasing sacrifices of good Y for equal increases in good X.
A maximum of [6] should be awarded if only one shape is explained.
Markbands (best fit)
One of 50 short multiple-choice questions on 4.1. Pick an answer to see why it's right or wrong.
On a free trade diagram for a small country, why is the world price drawn as a horizontal line?
The official deck for this part of the syllabus.
What is international trade?
What are exports?
With a free account, Augment remembers where you stopped and what you have practiced.
The sequence of stages that turns inputs into a final product, from design to assembly and sale, when the stages are carried out in several different countries.
The growing integration and interdependence of the world's economies through rising flows of goods, services, capital, labour, technology and ideas across borders.
The exchange of goods and services across national borders, through exports sold to other countries and imports bought from them.
The concentration of a country, region, firm or worker on producing a narrow range of goods or services, and obtaining other goods through exchange.
The price of a good set by global demand and supply, at which a small country can buy or sell as much as it wishes under free trade.
When a country sells goods or services to buyers in other countries, it exports them; when it buys goods or services produced abroad, it imports them. Exports bring money into the country, while imports send money out. Trade covers goods, such as cars, soybeans and crude oil, and services, such as tourism, banking, shipping, software and education for foreign students.
A country that does not trade at all is in autarky. It can consume only what it produces itself, so its consumption possibilities are limited by its own resources and technology, as its production possibilities curve shows. Trade breaks that link: a country can consume combinations of goods that it could never produce on its own.
In practice, no country has completely free trade. Governments use trade protection of many kinds, and many countries have joined trade agreements to reduce barriers between them. Free trade is still the benchmark against which every form of protection is judged.
Countries trade for the same basic reason that people trade. A doctor does not grow her own food, make her own clothes and build her own house. She specialises in medicine, sells her services, and uses the income to buy everything else from people who produce it more cheaply. Countries differ in their natural resources, climate, labour skills, capital and technology, so the cost of producing a given good varies a great deal between them.
Some goods simply cannot be produced in some places: Japan has almost no oil of its own, and Norway cannot grow bananas outdoors. For many other goods, production is possible everywhere but far cheaper in some countries than others. Trade lets each country obtain goods from wherever they are produced at the lowest cost.
Trade has grown much faster than world output for most of the last fifty years. Lower transport costs, especially after the spread of the standard shipping container, cheaper communication, and the reduction of tariffs through successive international agreements all made it easier to sell abroad. This growing integration of economies is called globalisation.
The chart shows the long rise in trade relative to output, and the plateau since 2008. Trade fell in both 2009 and 2020, when demand collapsed and supply chains broke down, which illustrates how closely national economies now depend on each other.
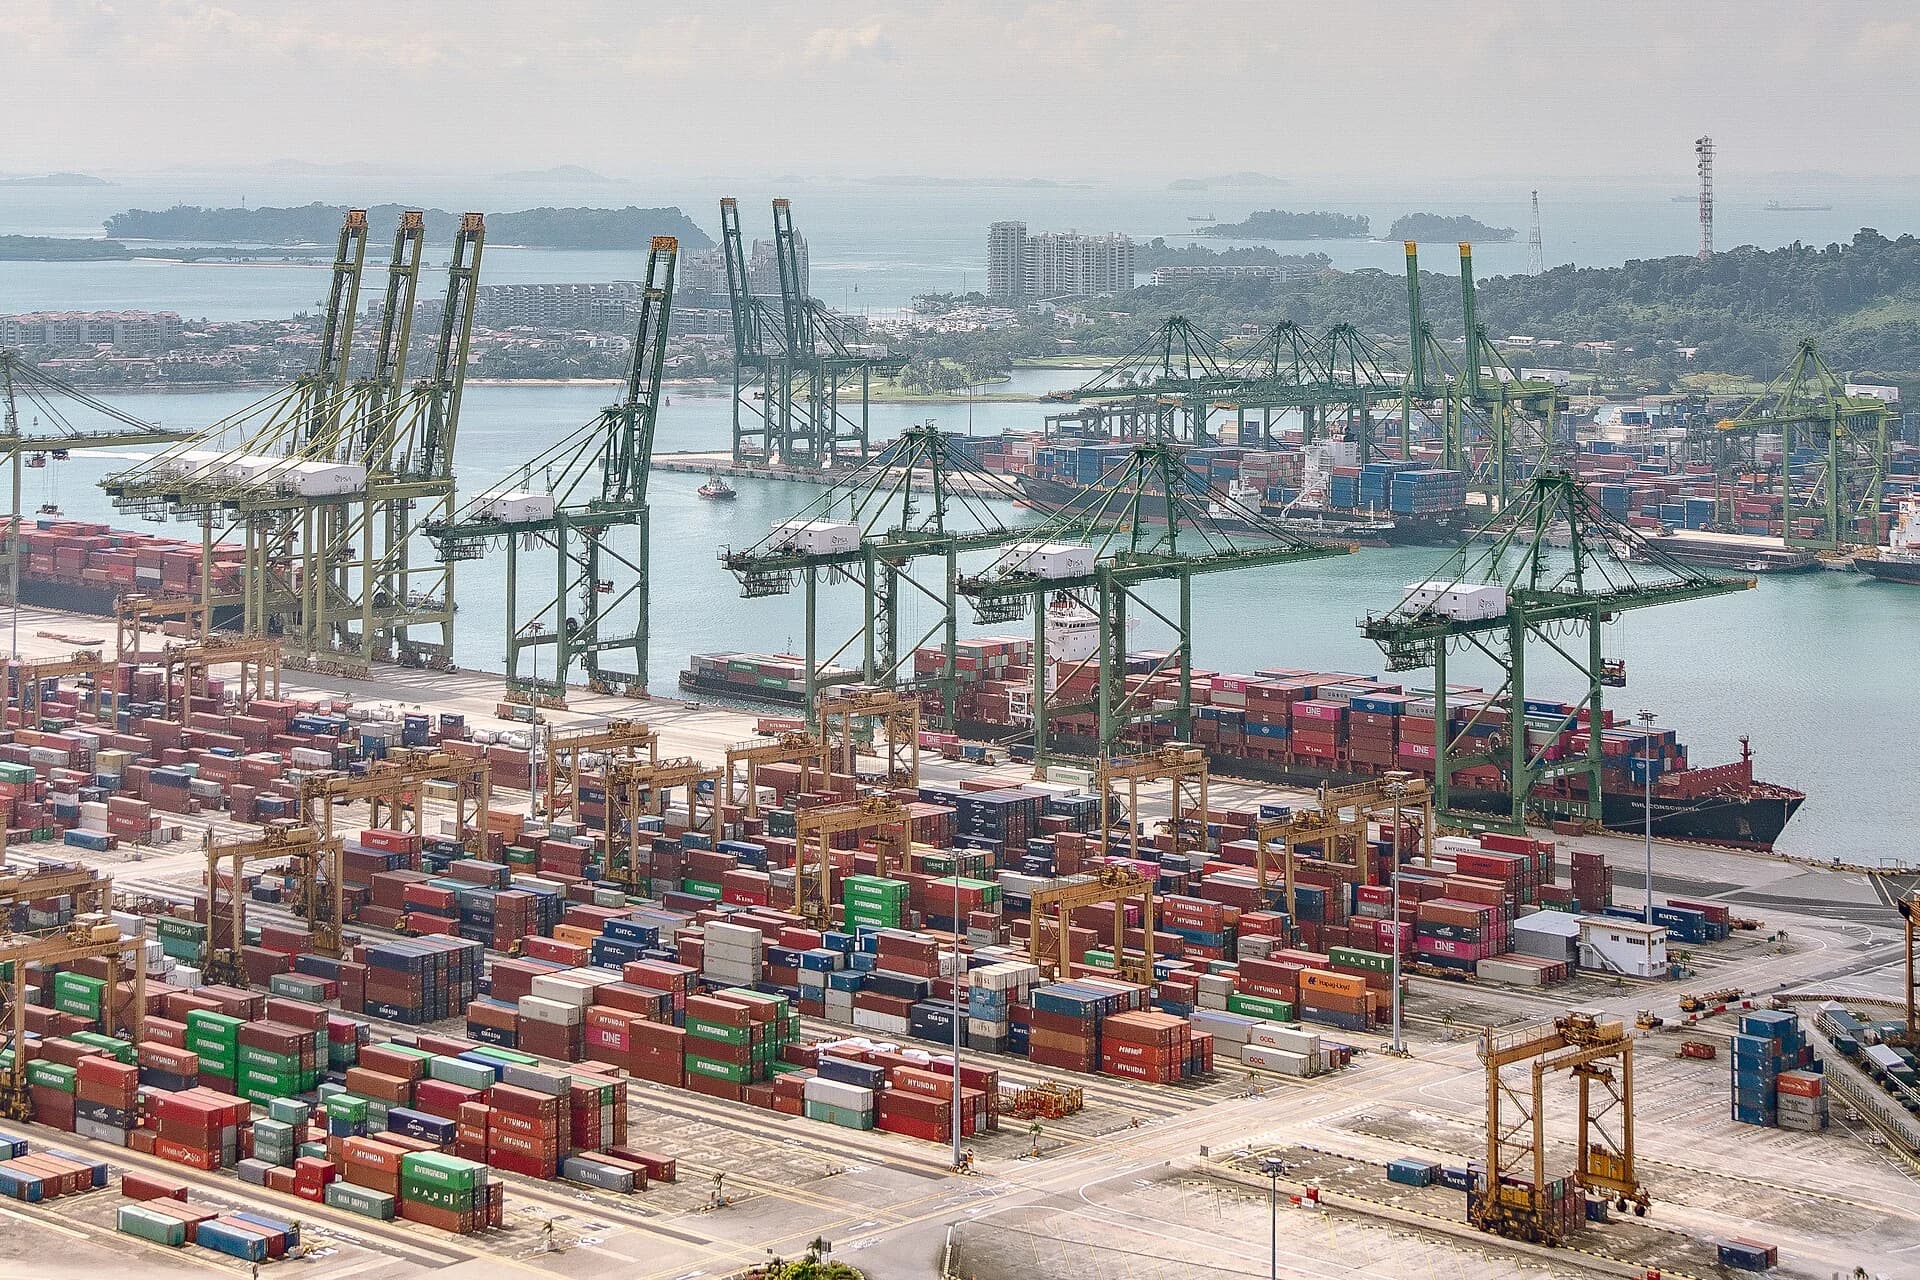
Many production processes are now split into stages carried out in different countries. A smartphone may be designed in the United States, use chips made in Taiwan and South Korea, a screen from Japan, and be assembled in Vietnam, China or India. Each stage is located where it can be done most cheaply or best.
The benefits of trade fall on consumers, producers, workers and the government. Each one is explained separately, but in practice they reinforce each other: greater competition lowers prices, which raises demand, which allows larger scale, which lowers costs further.
When a good can be imported from a country that produces it at lower cost, the domestic price falls towards the price on world markets. Consumers pay less, so their real incomes rise and they can buy more of other goods. Lower prices for imported inputs, such as steel, components and fuel, also reduce firms’ costs of production, which can lower the prices of goods made at home.
Lower prices matter most for low-income households, which spend a larger share of their income on traded goods such as food, clothing and basic electronics. This is one reason why trade is linked to rising economic well-being in many countries.
Trade widens the range of goods and services available. Consumers in Europe can buy tropical fruit all year, and consumers in the tropics can buy medicines and machinery that their own countries do not produce. Firms also gain a wider choice of inputs and technologies, which helps them make better products.
Many goods are traded in both directions between the same pair of countries: Germany both exports cars to France and imports French cars. This trade in similar goods exists largely because consumers value variety, and it would disappear under autarky.
Opening a market to imports exposes domestic firms to foreign competitors. A domestic firm that once dominated its home market, and could charge high prices because consumers had few alternatives, must now match the prices and quality of foreign rivals. Trade therefore reduces market power, which pushes prices closer to costs and gives firms a strong incentive to cut waste, innovate and improve quality.
Firms that cannot compete shrink or close, and their resources move to firms that can. This process is painful for the workers and owners involved, but it is one of the main ways in which trade raises productivity across the economy.
Natural resources are spread very unevenly around the world. Chile produced about 24% of the world’s copper in 2024, and most of the copper it mines is exported to China, which needs far more copper for its electrical and construction industries than it produces. Trade gives countries access to raw materials, energy, components and technologies that they lack or that would be very costly to produce at home.
Access to resources also includes access to capital goods and know-how. Low-income countries can import machinery, computers and medical equipment embodying technology developed elsewhere, which raises the productivity of their own workers far faster than if they had to develop that technology themselves.
Sources: Wikipedia, Copper mining in Chile (accessed 2026), citing US Geological Survey data for 2024.
A firm that sells only at home is limited by the size of its domestic market. Trade lets it sell to the whole world, so it can produce on a much larger scale. Many industries have high fixed costs, such as research, design, tooling and factories, and spreading those costs over more units lowers the average cost of each one. These cost savings from larger output are economies of scale.
Large passenger aircraft are a clear case. No single European country has a large enough market to support an aircraft maker of global size, but Airbus sells worldwide and spreads production across several countries: wings are built in the United Kingdom, and final assembly takes place in France and Germany, among other locations. Selling to airlines across the world spreads the huge cost of developing each aircraft model over thousands of units.
Access to larger markets matters most for small economies. A firm in Singapore, Denmark or Rwanda would find it hard to reach an efficient scale selling only to its own population.
Exports earn foreign exchange, the foreign currencies a country needs to pay for imports. A country that cannot export enough cannot import the fuel, food, medicines and machinery it needs, unless it borrows or receives aid. For many lower-income countries, export earnings from commodities such as copper, coffee, cocoa or oil, or from manufactures such as garments, are the main source of the foreign currency that pays for imported capital goods.
Under free trade, each country tends to produce more of the goods it can make at relatively low cost and to import the goods that it would make only at high cost. Resources move out of industries where the country is relatively inefficient and into industries where it is relatively efficient. The world as a whole produces more from the same scarce factors of production, which is a gain in allocative efficiency: resources are used to produce the combination of goods that consumers value most, given what each country is best at.
Bangladesh shows how strongly trade can shape a country’s pattern of production. Ready-made garments made up about four-fifths of its merchandise exports in the 2025–26 financial year; the industry employed about 4.2 million workers, around 54% of them women, and Bangladesh was the world’s second-largest exporter of clothing in 2024, after China. A large supply of relatively low-wage labour gives Bangladesh low costs in a labour-intensive industry, so resources flowed there once world markets were open to it.
Sources: Wikipedia, Textile industry in Bangladesh (accessed 2026), citing Export Promotion Bureau and WTO data and a 2025 Better Work report.
Trade raises productive efficiency as well. Specialisation lets workers and firms become highly skilled at a narrow range of tasks, competition forces firms to minimise their costs, and access to imported technology and inputs raises the output each worker can produce. Exporting firms also learn from foreign buyers, who often demand higher quality and faster delivery than home customers. Through these channels, trade can raise a country’s productive capacity over time and so contribute to economic growth.
Benefit | How it works | Main beneficiaries |
|---|---|---|
Lower prices | Imports from lower-cost producers; cheaper imported inputs | Consumers; firms that use imported inputs |
Greater choice | Goods not produced at home; more varieties of each good | Consumers; firms |
More competition | Foreign rivals reduce market power and push firms to cut costs and innovate | Consumers; the economy as a whole |
Access to resources | Raw materials, energy, components and technology a country lacks | Firms; consumers |
Larger markets and economies of scale | Selling worldwide spreads fixed costs over more units, lowering average costs | Exporting firms; their workers; consumers worldwide |
Foreign exchange earnings | Exports earn the currency needed to pay for imports | The whole economy; the government |
More efficient resource allocation | Resources move to the industries where a country is relatively efficient | The economy as a whole |
More efficient production | Specialisation, competition and imported technology raise productivity | Firms; workers; long-run growth |
Trade raises total output, but it does not make everyone better off. Firms and workers in industries that face new import competition lose sales, profits and jobs, and the workers may find it hard to move to the expanding export industries if they live in a different region or lack the right skills. Consumers in an exporting country may pay more for goods that are now sold abroad at higher world prices.
The gains are usually spread thinly across millions of consumers, while the losses are concentrated on particular industries and towns, which explains why the losers often campaign for protection. The arguments for and against trade protection build on exactly this distinction between total gains and their distribution.
The effects of opening a single market to trade can be shown on a demand and supply diagram. The diagram combines the domestic market (domestic demand and domestic supply) with the price at which the good is traded internationally.
Without trade, the price of a good is set where domestic demand equals domestic supply, as in any competitive market. This is the domestic price (the autarky price).
Under free trade, the price is instead set by global demand and supply: the world price. The free trade diagram assumes a small country, one whose purchases or sales are too small a part of the world market to change the world price. Such a country can buy or sell as much as it wishes at the world price, so world supply (for an importer) or world demand (for an exporter) is perfectly elastic and is drawn as a horizontal line at Pw.
Whether a country imports or exports a good depends only on where the world price lies relative to its domestic price. If the world price is lower, the country imports; if it is higher, the country exports.
Suppose a country can buy a good on world markets at a price below its domestic equilibrium price. Under free trade, no consumer will pay more than the world price, so the domestic price falls from Pe to Pw. Two things happen at the lower price.
Domestic firms move down their supply curve and reduce output from Qe to Q₁, because fewer of them can cover their costs at the lower price.
Consumers move down the demand curve and buy more, increasing consumption from Qe to Q₂.
The gap between what consumers buy and what domestic firms produce is filled by imports. Imports equal Q₂ − Q₁.
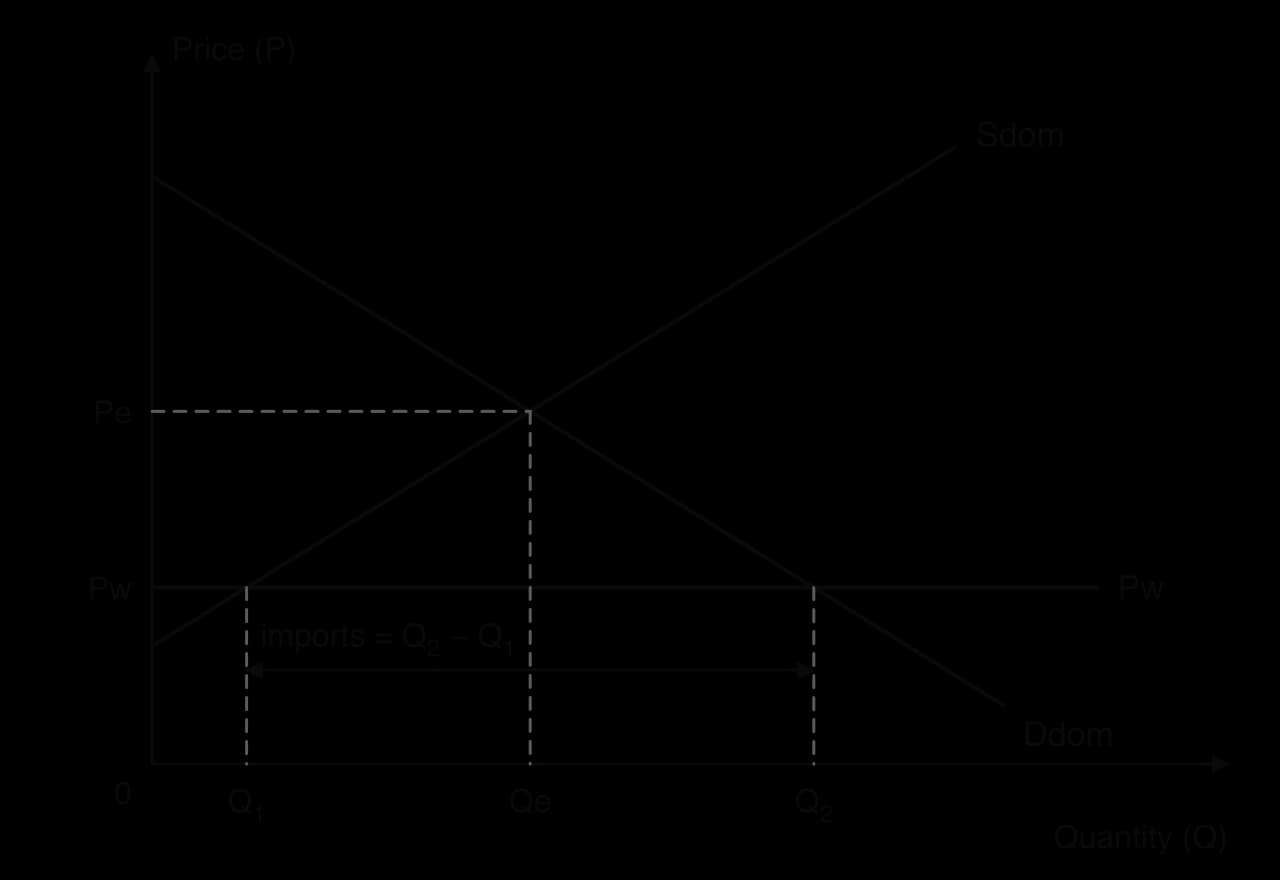
In the diagram, the domestic demand and supply curves cross at Pe and Qe, which is where the market would settle without trade. The horizontal world price line Pw cuts the supply curve at Q₁ and the demand curve at Q₂. Any quantity that consumers want beyond Q₁ is supplied by foreign producers at the world price.
Now suppose the world price is above the domestic price. Domestic producers can sell as much as they like abroad at Pw, so they will not sell at home for less. The domestic price rises from Pe to Pw.
Domestic firms move up their supply curve and increase output from Qe to Q₂.
Domestic consumers face a higher price and reduce consumption from Qe to Q₁.
The output that domestic consumers do not buy is sold abroad, so exports equal Q₂ − Q₁.
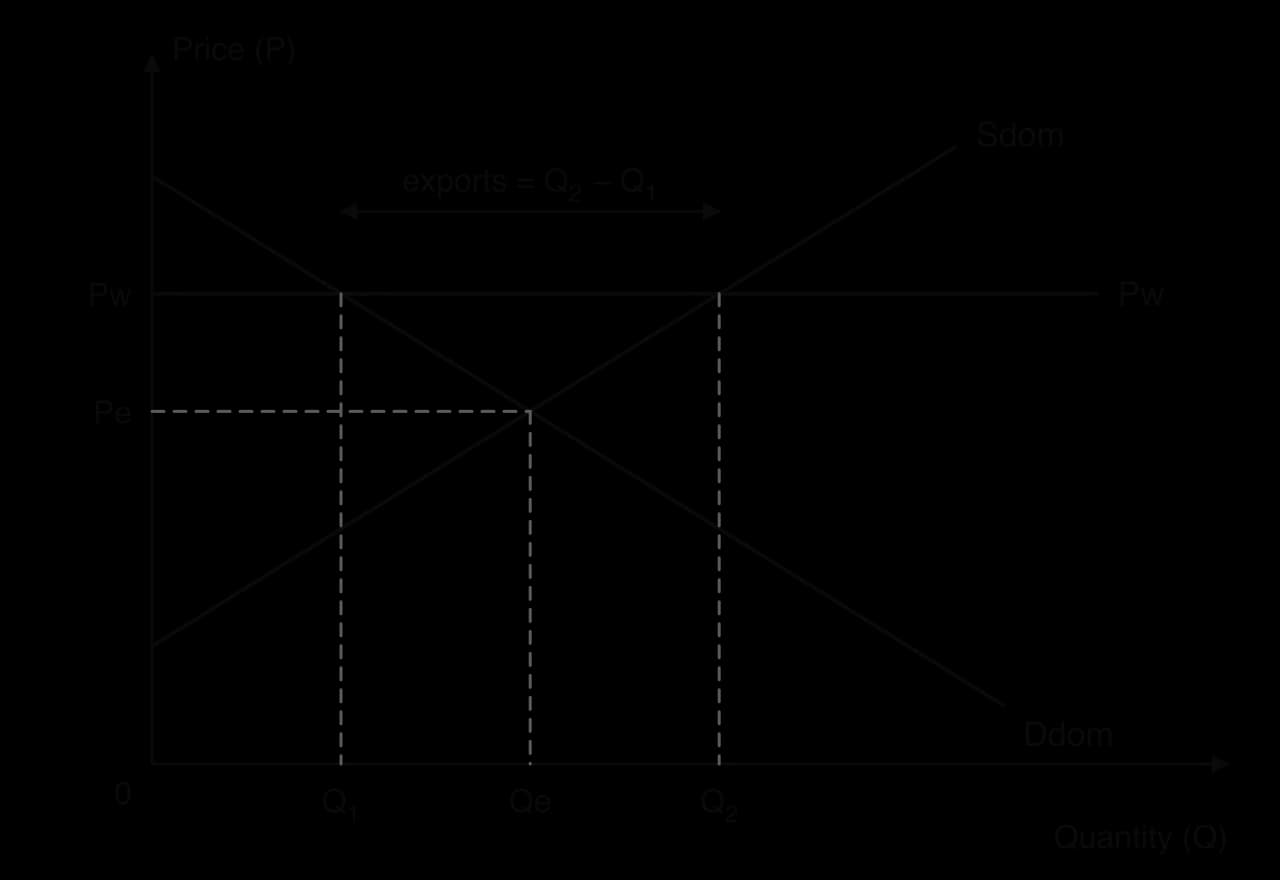
This is the position of countries that are relatively efficient producers of a good: Chile in copper, Brazil in soybeans, or Bangladesh in garments. Their producers gain from access to a much larger market than their own, while domestic buyers of the good pay the world price.
 YouTube
The free trade diagrams also show how opening a market changes consumer surplus and producer surplus. The figure compares, in two panels, a country that imports the good with one that exports it.
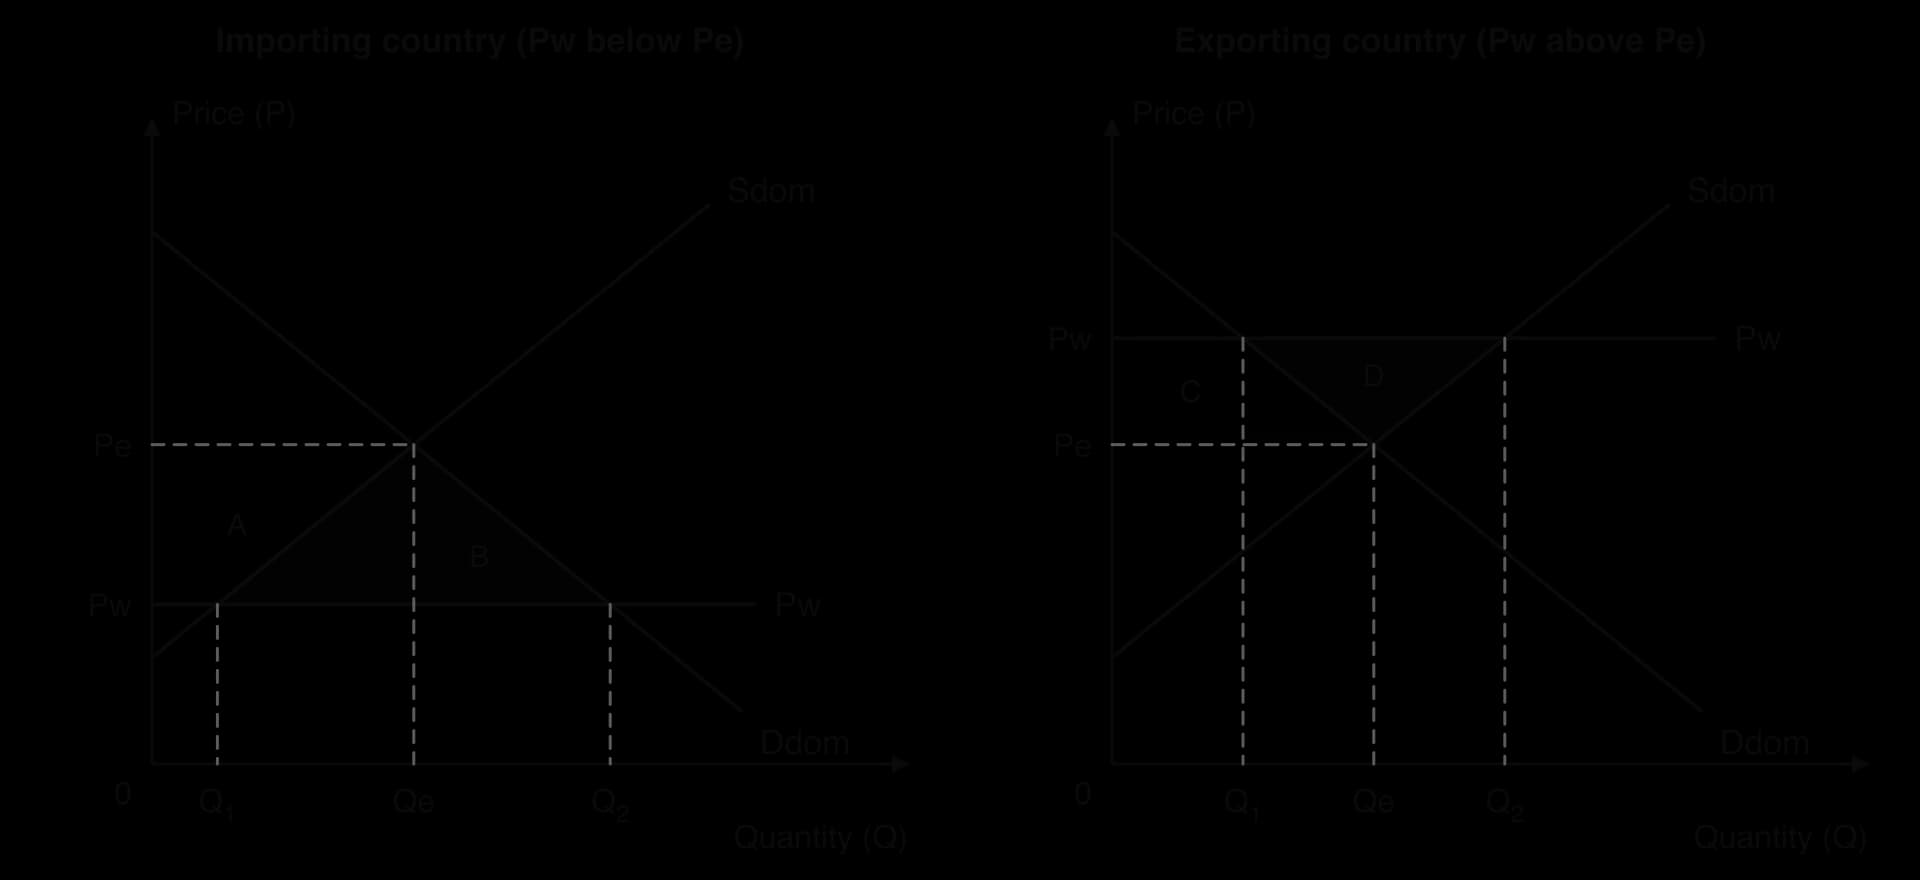
When the price falls from Pe to Pw, consumer surplus rises by areas A + B: consumers pay less for the units they bought before and buy extra units that are worth more to them than the world price. Producer surplus falls by area A, because domestic firms sell fewer units at a lower price. Area A is a transfer from domestic producers to domestic consumers, so it cancels out. The net gain to the country is triangle B, which comes from replacing high-cost domestic output with cheaper imports and from the extra consumption.
When the price rises from Pe to Pw, producer surplus rises by areas C + D. Consumer surplus falls by area C, as domestic consumers pay more and buy less. Area C is a transfer from consumers to producers, so the net gain to the country is triangle D.
In both cases social surplus rises. The gain is the same idea as the gains from specialisation: the country stops producing units that cost more than the world price (as an importer) or produces extra units that cost less than the world price (as an exporter). The distribution of the gain, however, is very different. In an importing country consumers gain and producers lose; in an exporting country producers gain and consumers lose.
When a free trade diagram has numbered axes, every quantity in it can be read off and used in a calculation. Four results are calculated most often.
Item | How to calculate it |
|---|---|
Quantity of imports | Quantity demanded at Pw − quantity supplied by domestic firms at Pw |
Quantity of exports | Quantity supplied by domestic firms at Pw − quantity demanded at Pw |
Import expenditure (spending on imports) | Pw × quantity of imports |
Export revenue (earnings from exports) | Pw × quantity of exports |
Other values follow in the same way: the revenue of domestic producers is the price times the quantity they sell, and total consumer spending is the price times the quantity consumers buy. Changes in consumer and producer surplus are areas of triangles and trapezoids, as in any surplus calculation.
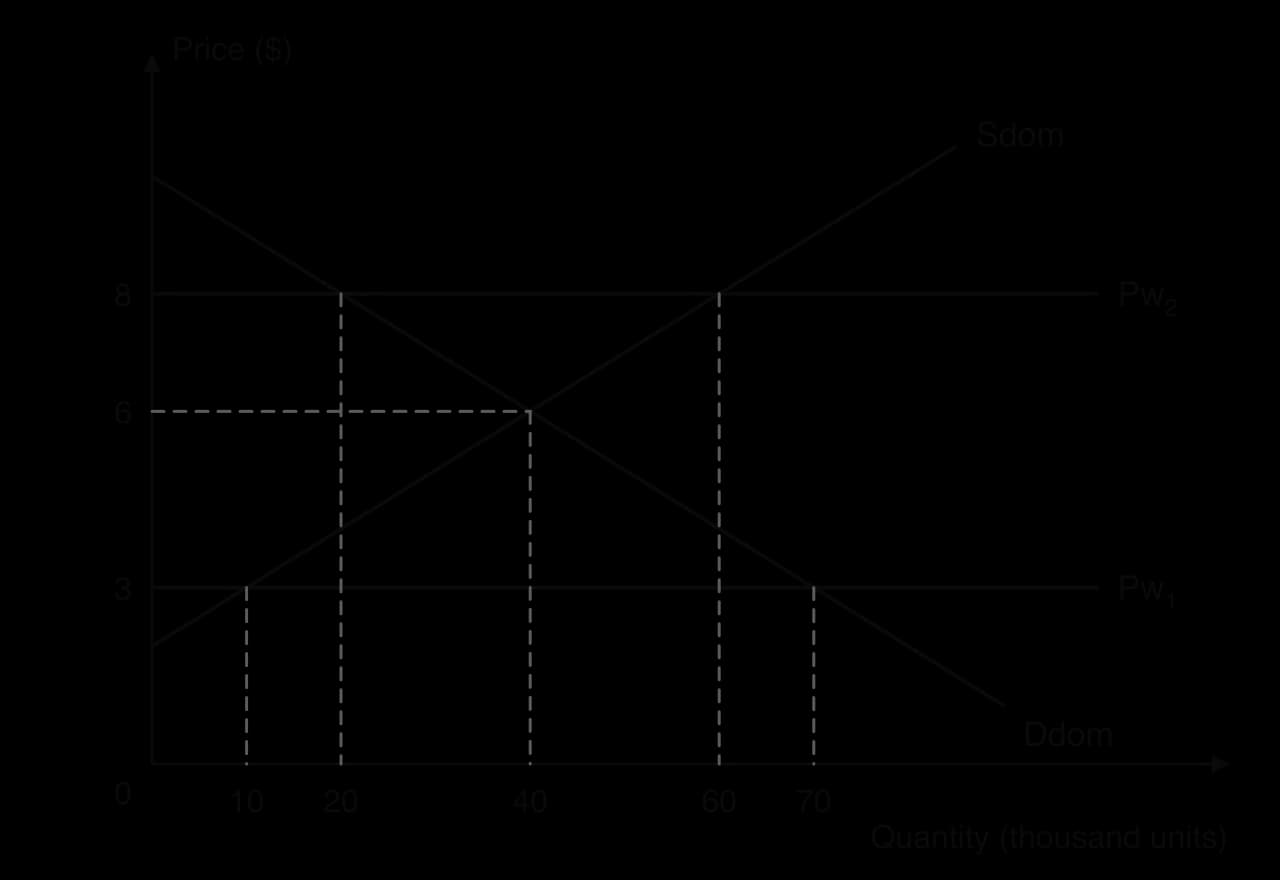
The same diagram can be used for an exporting country by reading the quantities at the higher world price.
The benefits of trade raise an obvious question: which goods should each country produce and export? The theories of absolute and comparative advantage answer it. Both start from simple models with two countries and two goods, in which every unit of resources can be switched between the goods at a constant rate, so each country’s PPC is a straight line.
Adam Smith argued in The Wealth of Nations (1776) that if one country can produce a good more cheaply than another, both gain when each specialises in the good it produces most efficiently and trades for the other.
Suppose that, with the same quantity of resources, Country X can produce 100 tonnes of wheat or 20 tractors, while Country Y can produce 40 tonnes of wheat or 40 tractors (hypothetical data). X has an absolute advantage in wheat and Y in tractors. If X produces only wheat and Y only tractors, total output is 100 wheat and 40 tractors, more of both than if each split its resources equally (70 wheat and 30 tractors). Trade then lets both countries consume more than before.
Absolute advantage explains a great deal of real trade, such as tropical countries exporting coffee to temperate ones. It leaves a puzzle, though. A country with high productivity may be more efficient than its trading partners in almost everything. Absolute advantage suggests, wrongly, that such a country has nothing to gain from trade and that a country that is less efficient at everything has nothing to sell.
David Ricardo solved the puzzle in On the Principles of Political Economy and Taxation (1817). He showed that what matters is not which country can produce a good with fewer resources, but which one gives up less of other goods to produce it. That is, what matters is the opportunity cost of production.
A country always has a comparative advantage in something, even if it has an absolute advantage in nothing, because opportunity costs are relative. If producing one tractor costs Country X two tonnes of wheat but costs Country Y six tonnes, then X has the comparative advantage in tractors. It follows automatically that Y has the comparative advantage in wheat, because producing a tonne of wheat costs Y only one-sixth of a tractor but costs X half a tractor.
The law of comparative advantage states that if each country specialises in the goods in which it has a comparative advantage and trades for the rest, total world output rises, and both countries can consume more than they could alone. The extra output and consumption are the gains from trade.
Data on comparative advantage come in two forms. The most common gives the output each country can produce with a given quantity of resources (or with all of its resources). The opportunity cost of one unit of a good is the amount of the other good given up, divided by the amount of the first good gained.
The second form gives the quantity of inputs, such as hours of labour, needed to produce one unit of each good. Ricardo’s own example used this form, with England and Portugal producing cloth and wine. With input data, the opportunity cost of one unit of a good is the input needed for that good divided by the input needed for the other good.
The gains from trade can be shown on a diagram with each country’s PPC. Because the models assume constant opportunity costs, each PPC is a straight line, and the slope of the line is the opportunity cost of the good on the horizontal axis.
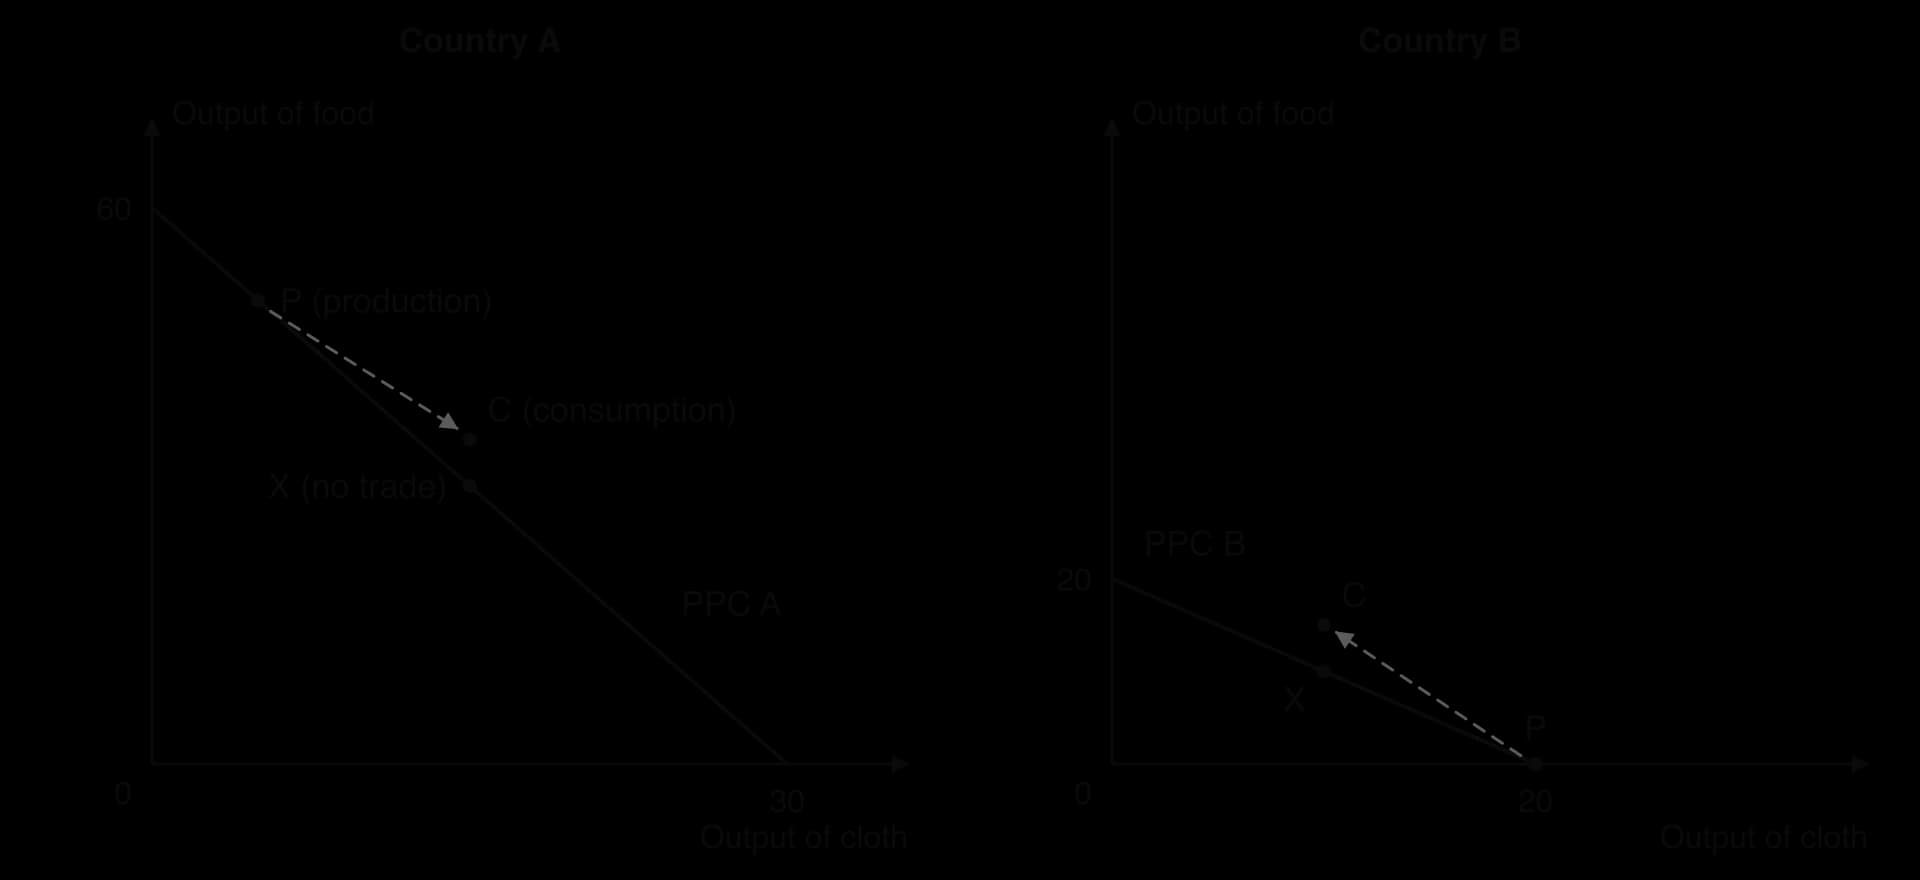
In the diagram, Country A can produce 60 units of food or 30 units of cloth, so one unit of cloth costs it 2 units of food. Country B can produce 20 units of food or 20 units of cloth, so one unit of cloth costs it 1 unit of food. A has an absolute advantage in both goods, but B has the comparative advantage in cloth (1 < 2 food), and A has the comparative advantage in food (½ < 1 cloth).
Without trade, each country consumes what it produces, at points X: A at 15 cloth and 30 food, B at 10 cloth and 10 food. Total world output is 25 cloth and 40 food. With trade, B specialises completely in cloth (20 units), and A moves along its PPC towards food, producing 5 cloth and 50 food at point P. Total output is now 25 cloth and 50 food: the same amount of cloth and 10 more units of food, from the same resources.
The countries then trade. B exports 10 cloth to A in exchange for 15 food, a rate of 1.5 food per cloth. A ends up with 15 cloth and 35 food; B ends up with 10 cloth and 15 food. Each country consumes at point C, which lies outside its own PPC. Each has the same amount of cloth as before and 5 more units of food. The central result of the theory is that trade lets countries consume beyond their own production possibilities.
Both countries gain only if the rate at which goods are exchanged lies between the two countries’ opportunity costs. In the example, A will not pay more than 2 food for a unit of cloth, because it could make cloth itself at that cost, and B will not accept less than 1 food per unit of cloth. Any rate between 1 and 2 food per cloth benefits both countries; the rate of 1.5 splits the gains equally. Where exactly the rate settles depends on world demand for each good and on bargaining power, which affects how the gains from trade are shared.
Comparative advantage reflects real differences between countries. The most important are differences in factor endowments: the quantity and quality of land, natural resources, labour and capital a country has.
A country tends to have a comparative advantage in goods that use its abundant factors intensively, because abundant factors are relatively cheap. This idea is developed in the Heckscher–Ohlin model of trade. The main sources are listed in the table.
Source | Why it creates comparative advantage | Example |
|---|---|---|
Natural resources | Mineral deposits, fertile land or energy sources make extraction or farming cheap | Australia produced about 37% of the world’s iron ore in 2019, and more than half of its iron ore exports go to China |
Climate and geography | Temperature, rainfall and location suit some crops or activities | Coffee in Ethiopia and Colombia; tourism in island economies |
Labour (quantity and cost) | A large supply of relatively low-wage labour makes labour-intensive goods cheap | Garments in Bangladesh; electronics assembly in Vietnam |
Human capital (skills) | An educated workforce lowers the cost of skill-intensive goods and services | Software and IT services in India; machinery in Germany |
Physical capital and technology | Abundant capital and advanced technology lower the cost of capital-intensive goods | Semiconductors in Taiwan and South Korea; aircraft in the US and Europe |
Institutions and infrastructure | Stable laws, good ports, reliable power and low trade costs reduce production and trading costs | Singapore’s port, logistics and financial services |
Sources: Wikipedia, Iron ore in Australia (accessed 2026).
Comparative advantage is not fixed. A country can acquire it in new industries by investing in education, infrastructure and technology, as South Korea did when it moved from textiles to steel, ships and then electronics between the 1960s and the 1990s. This dynamic comparative advantage is the basis of many development strategies, and it is one reason why some governments do not accept the pattern of trade that a country’s current factor endowments would suggest.
 YouTube
Comparative advantage is one of the most widely accepted results in economics, and it explains why trade is not a contest in which one country’s gain is another’s loss. Its simple form, however, rests on strong assumptions. Each assumption that fails in the real world limits how far the theory’s predictions can be relied on.
The model assumes straight-line PPCs, so opportunity costs stay constant however much a country specialises. In reality most PPCs are bowed outwards, because factors of production are not equally suited to every use. As a country specialises, it uses resources that are less and less suited to the good, so its opportunity cost rises and the advantage shrinks. This is why countries usually specialise partly rather than completely.
Some industries have the opposite feature: economies of scale. Then opportunity costs fall as output rises, and an early lead can become a lasting advantage that has little to do with factor endowments, as in aircraft or semiconductors.
The theory assumes that resources move freely and quickly from industries that shrink to industries that expand. In reality, a textile worker who loses her job cannot immediately become a software engineer, and a closed steel mill cannot become a vineyard. Resources may be unemployed for long periods, so the economy operates inside its PPC and the gains from specialisation are delayed or lost. Regions that depended on a single industry can suffer for decades.
The simple model ignores transport costs. Real goods must be shipped, insured and cleared through customs, and these costs can outweigh small differences in opportunity cost. They also change suddenly. After attacks on ships in the Red Sea from late 2023, trade volumes through the Suez Canal fell by about 50% year on year in the first two months of 2024, while transits around the Cape of Good Hope rose by an estimated 74%, adding 10 days or more to delivery times on many routes.
Sources: IMF, “Red Sea Attacks Disrupt Global Trade”, IMF Blog (March 2024).
The theory assumes free trade and competitive markets. In reality, tariffs, quotas and subsidies distort prices, so the pattern of trade may reflect government policy rather than opportunity costs. Large firms with market power may set prices well above costs. Exchange rates may also be managed, so goods may be cheaper in one country for reasons unrelated to its real costs of production.
Real trade involves around two hundred countries and many thousands of goods, most of them made from imported parts in global value chains. Firms do not know every country’s opportunity costs, and much trade is between similar countries in similar goods (cars for cars), which comparative advantage does not explain. The theory remains useful as a way of thinking, but it cannot predict precisely what each country will export.
The theory shows that total output rises, not that everyone gains. The terms of trade decide how the gains are shared between countries, and within each country workers and owners in import-competing industries lose. A country that specialises in primary commodities may also find that their prices are volatile and tend to fall relative to manufactures over long periods, so its share of the gains shrinks. These issues raise questions of equity that the theory does not answer.
Specialisation increases interdependence. A country that relies on one export, or imports all of an essential good, is exposed to shocks it cannot control: a fall in world demand, a new tariff, a pandemic that closes factories, or a war that closes a shipping route. Some governments therefore accept higher costs in return for producing essential goods, such as food, energy, medicines or semiconductors, at home.
Comparative advantage describes the best pattern of production given today’s resources and technology. It does not say that a country should remain an exporter of raw materials forever. Some economists argue that countries need to build new comparative advantages in more productive industries, and that temporary protection or state support can help. Others reply that governments are poor at choosing future winners.
The model ignores external costs. More trade means more transport and its emissions, and specialisation can lead to the overuse of resources, such as forests cleared for export crops or water used for export agriculture in dry regions. If these costs are not reflected in prices, the trade pattern that the theory predicts may not be efficient for society, which links trade to sustainability.
Assumption of the model | Reality | Effect on the theory’s predictions |
|---|---|---|
Constant opportunity costs (linear PPCs) | Increasing costs for most goods; economies of scale in some | Specialisation is partial; advantages may come from scale rather than endowments |
Perfect factor mobility | Workers and capital move slowly between industries | Unemployment and lost output during adjustment |
No transport or trade costs | Freight, insurance, delays and disruptions | Some potential trade does not happen; gains are smaller |
Free trade, perfect competition | Protection, market power, managed exchange rates | Trade patterns may not follow opportunity costs |
Two countries, two goods, perfect knowledge | Many countries and goods; value chains; trade in similar goods | The theory explains tendencies rather than precise patterns |
Everyone gains | Gains are unequally shared within and between countries | Losers may need compensation; equity concerns |
External costs ignored | Emissions and resource depletion | Market trade patterns may not be socially efficient |
Taken together, the limitations do not overturn the central insight that specialisation based on opportunity cost raises total output. They do show that the gains are smaller, slower and less evenly shared than the simple model suggests, and that the case for free trade has to be weighed against adjustment costs, risks and distributional effects.
Key concept | How it applies to the benefits of trade |
|---|---|
Interdependence | Specialisation makes countries rely on each other for goods, inputs and markets; shocks in one country spread to others. |
Efficiency | Trade moves resources to their relatively most productive uses and lowers costs through competition and economies of scale. |
Scarcity and choice | Trade lets a country consume beyond its own PPC, easing the constraint of scarce resources. |
Equity | The gains from trade are unevenly shared: import-competing workers lose while consumers and exporters gain. |
Economic well-being | Lower prices, more choice and higher incomes from exports raise living standards. |
Sustainability | More transport and the overuse of resources for export may harm future generations. |
Vietnam is one of the clearest recent examples of the benefits of opening an economy to trade. In 1986 the government launched the Đổi Mới (“renovation”) reforms, moving from central planning towards a market economy and opening the country to foreign trade and investment. A trade agreement with the United States, signed in July 2000, gave Vietnamese goods normal access to the US market, and Vietnam joined the World Trade Organization on 11 January 2007.
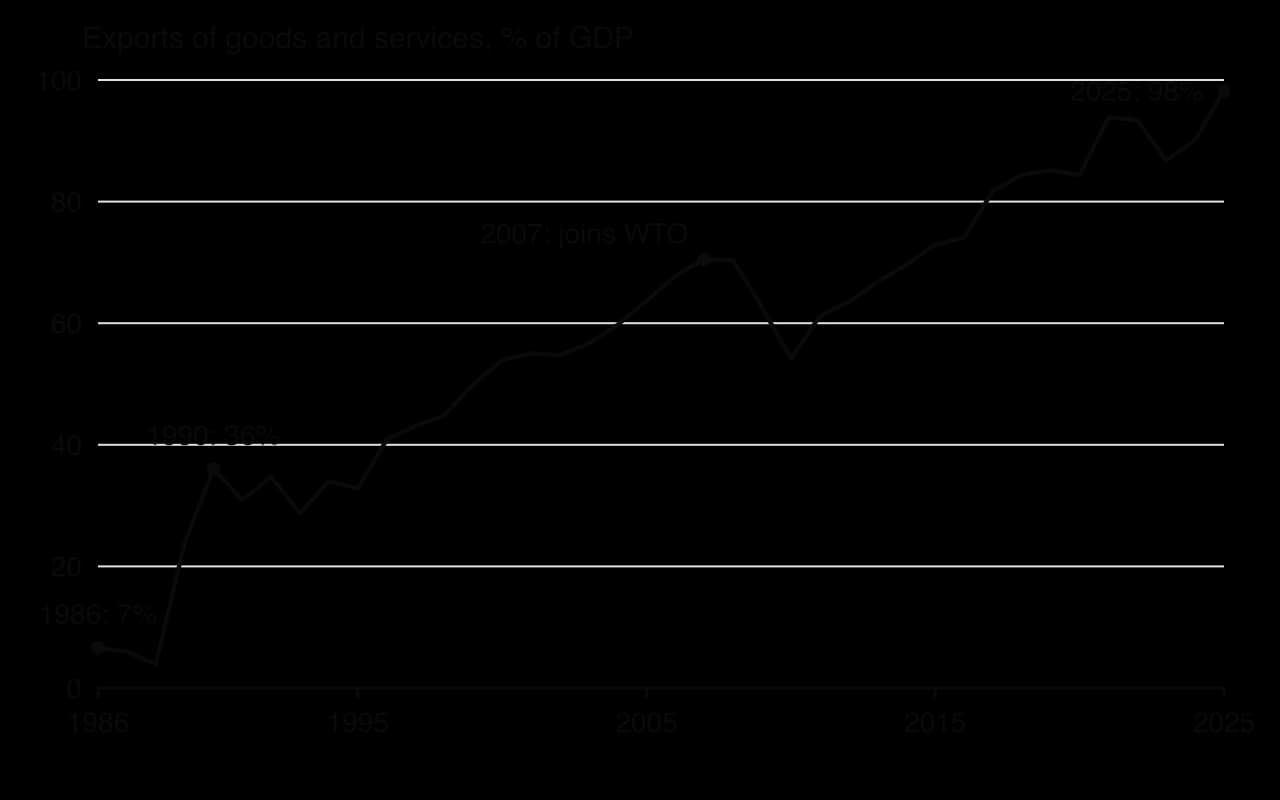
The chart shows how far trade has transformed the economy. Exports of goods and services were equal to only 7% of GDP in 1986, 36% in 1990, and 98% in 2025, one of the highest ratios for a large economy. Imports were almost as large, at 92% of GDP in 2025, because much of what Vietnam exports is assembled from imported components. Total exports of goods and services were worth about US$506 billion in 2025.
Larger markets and economies of scale. Vietnam’s domestic market is far too small to support factories of global scale for phones or electronics, but access to world markets allowed them to be built. Samsung employed more than 200,000 people in the Hanoi area making smartphones by 2019, and electronics rose from 14% of Vietnam’s exports in 2010 to 38% in 2020.
Comparative advantage and specialisation. Vietnam had abundant, relatively low-wage labour and a strategic location next to China’s supply chains. It specialised first in labour-intensive goods such as garments, footwear and processed food, and later in electronics assembly within global value chains, while importing machinery and components it could not produce cheaply.
Foreign exchange and investment. Export earnings paid for imported capital goods, and access to export markets attracted foreign direct investment, whose net inflows rose to about US$22 billion in 2025. Foreign firms brought technology, management skills and links to buyers.
Growth and well-being. Real GDP per capita (in constant 2015 US dollars) rose from about $690 in 1990 to about $4,310 in 2025, more than six times higher. The share of the population living on less than $3.00 a day (2021 PPP) fell from 57.5% in 1992 to 1.6% in 2022.
Indicator | Earlier | Latest |
|---|---|---|
Exports of goods and services (% of GDP) | 36.0 (1990) | 98.2 (2025) |
Real GDP per capita (constant 2015 US$) | 688 (1990) | 4 308 (2025) |
Poverty headcount at $3.00 a day, 2021 PPP (% of population) | 57.5 (1992) | 1.6 (2022) |
FDI, net inflows (US$ billion) | 15.5 (2018) | 22.0 (2025) |
Vietnam’s experience supports the predictions of trade theory. Specialising on the basis of comparative advantage in labour-intensive manufacturing and gaining access to large foreign markets went together with rapid growth and one of the fastest falls in extreme poverty in the world.
The case has limits as evidence. Trade was only one part of a wider set of reforms that also included secure land rights for farmers, investment in education and infrastructure, and political stability, so not all of the growth can be credited to trade.
Much of the value of Vietnam’s electronics exports comes from imported components and foreign-owned firms, so the domestic value added and the profits kept in Vietnam are smaller than the export figures suggest. Heavy reliance on a few large foreign investors and on demand in a few export markets also exposes the economy to shocks, such as the collapse in world demand in 2009 or tariffs in its main markets.
A balanced judgment is that openness to trade was a necessary condition for Vietnam’s rapid growth, because no small domestic market could have supported its export industries, but that the benefits were large because trade was combined with domestic reforms and investment in people. The next challenge is to move from assembly towards higher value-added activities, which depends on building new comparative advantages rather than relying on low wages.
Sources: World Bank, World Development Indicators: NE.EXP.GNFS.ZS, NE.IMP.GNFS.ZS, NY.GDP.PCAP.KD, SI.POV.DDAY, BX.KLT.DINV.CD.WD (2026); Wikipedia, Economy of Vietnam and Samsung Electronics (accessed 2026).
The benefits of trade and the free trade diagrams are SL content and can appear on Paper 1 and Paper 2. Absolute and comparative advantage, the calculations from free trade diagrams and the limitations of comparative advantage are HL content, so they can appear on HL Paper 1 and especially on Paper 3, where opportunity cost calculations and linear PPC diagrams are common short items.
Paper 2 often asks for short definitions, a diagram and an explanation tied to the text, followed by a part (g) evaluation.
An HL Paper 1 part (b) can ask for an evaluation of the theory itself.
International trade is the exchange of goods and services across borders; it has grown much faster than world output since 1970.
The benefits of trade include lower prices, more choice, more competition, access to resources, larger markets and economies of scale, foreign exchange, and more efficient allocation and production.
If the world price is below the domestic price, the country imports Q₂ − Q₁; if it is above, the country exports Q₂ − Q₁.
Opening to trade raises total welfare, but consumers gain and producers lose in an importing market, and the reverse in an exporting market.
HL: import expenditure and export revenue equal the world price times the quantity imported or exported.
HL: comparative advantage depends on opportunity cost, not absolute output; specialising by comparative advantage lets both countries consume beyond their PPCs.
HL: comparative advantage comes from factor endowments, skills, technology and institutions, and it can change over time.
HL: the theory’s assumptions (constant costs, mobile factors, no transport costs, free trade) limit it, and it says nothing about how the gains are shared.
I can explain at least five benefits of international trade and say who gains from each.
I can draw and explain the free trade diagram for a country that imports a good.
I can draw and explain the free trade diagram for a country that exports a good.
I can explain which groups gain and which lose when a market opens to trade.
I can calculate imports, exports, import expenditure and export revenue from a free trade diagram (HL).
I can distinguish absolute from comparative advantage and calculate opportunity costs from output or input data (HL).
I can draw linear PPCs that show the gains from specialisation and trade, and explain the sources of comparative advantage (HL).
I can evaluate the theory of comparative advantage using its assumptions and real examples (HL).
Marks |
|---|
Descriptor |
|---|
0 | 0 | The work does not reach a standard described by the descriptors below. |
1 | 1–2 | Little understanding of the specific demands of the question. Relevant economic theory is stated but not relevant. Economic terms are stated but not relevant. |
2 | 3–4 | Some understanding of the specific demands of the question. Relevant economic theory is described. Some relevant economic terms are included. |
3 | 5–6 | The specific demands of the question are understood but only partially addressed. Relevant economic theory is partly explained. Some relevant terms are used appropriately. Where appropriate, relevant diagram(s) are included. |
4 | 7–8 | The specific demands of the question are understood and addressed. Relevant economic theory is explained. Relevant terms are used mostly appropriately. Where appropriate, relevant diagram(s) are included and explained. |
5 | 9–10 | The specific demands of the question are understood and addressed. Relevant economic theory is fully explained. Relevant terms are used appropriately throughout. Where appropriate, relevant diagram(s) are included and fully explained. |
Using real-world examples, discuss the limitations of the view that countries should specialize according to comparative advantage.
15 marks
Answers may include:
Terminology: comparative advantage, absolute advantage, opportunity cost, specialization, free trade, terms of exchange, diversification, transport costs.
Explanation: the theory states that if countries specialize in the goods they produce at a lower opportunity cost and trade, world output rises and both countries can consume beyond their own PPCs; limitations arise from its assumptions: constant opportunity costs (straight-line PPCs), no transport costs, perfect factor mobility between industries, no trade barriers, full employment, and that comparative advantage is fixed.
Diagram(s): straight-line PPCs for two countries showing different opportunity costs and the consumption gains from trade; a concave PPC showing that opportunity costs rise as specialization increases, so complete specialization may not occur.
Synthesis/evaluation: increasing opportunity costs limit the gains; transport costs and trade barriers may remove them; specialization in primary commodities exposes economies to price volatility and dependence; structural unemployment as factors move between industries; strategic and security concerns (food and energy security); comparative advantage can be created over time through investment and education; environmental costs of specialization (monoculture, resource depletion); despite limitations, the theory explains large gains from trade; a reasoned conclusion.
Examples: Zambia's dependence on copper exports and the impact of price swings; Ghana and Côte d'Ivoire's concentration on cocoa; South Korea's development of new comparative advantages in electronics and shipbuilding; concerns about dependence on imported energy in Europe after 2022.
N.B. Terminology, theory, diagrams and examples given in part (a) and referred to in part (b) should be rewarded.
Examiners should be aware that candidates may take a different approach which, if appropriate, should be rewarded.
Markbands (best fit)
Level | Marks | Descriptor |
|---|---|---|
0 | 0 | The work does not reach a standard described by the descriptors below. |
1 | 1–3 | Little understanding of the specific demands of the question. Theory is stated but not relevant. Terms are not relevant. No synthesis or evaluation. Real-world examples are identified but not relevant. |
2 | 4–6 | Some understanding of the demands. Relevant theory is described. Some relevant terms are included. Synthesis or evaluation is superficial. A relevant real-world example is identified. |
3 | 7–9 | The demands are understood but only partially addressed. Theory is partly explained. Some terms are used appropriately. Relevant diagram(s) are included where appropriate. Synthesis or evaluation is appropriate but lacks balance. Example(s) are identified and partly developed in context. |
4 | 10–12 | The demands are understood and addressed. Theory is explained. Terms are used mostly appropriately. Diagram(s) are included and explained. Synthesis or evaluation is appropriate and mostly balanced. Example(s) are identified and developed in the context of the question. |
5 | 13–15 | The demands are understood and addressed. Theory is fully explained. Terms are used appropriately throughout. Diagram(s) are included and fully explained. Synthesis or evaluation is effective and balanced. Example(s) are identified and fully developed to support the argument. |
Read the extract and answer the questions that follow.
Text A — Should Kordova and Ilmaris specialize?
[1] Kordova and Ilmaris are neighbouring economies that both produce textiles and wheat. Each country has 100 workers available in the industries concerned, and each worker can be moved between the two industries without any loss of productivity. Kordova's workers are more productive in both goods (Table 1).
[2] A regional trade agreement would allow the two countries to trade freely. Negotiators have suggested that wheat and textiles could be exchanged at a rate of 1 unit of wheat for 2.5 units of textiles. Each country's choice involves an opportunity cost.
Table 1: Output per worker per week
Country | Textiles (units) | Wheat (units) |
|---|---|---|
Kordova | 20 | 10 |
Ilmaris | 12 | 4 |
Define the term opportunity cost indicated in bold in the text (Text A, paragraph 2).
2 marks
Using information from Table 1, calculate the opportunity cost of one unit of wheat in each country.
2 marks
Using your answer to (b)(i), identify which country has a comparative advantage in the production of textiles.
1 mark
Using information from Text A and Table 1, sketch the production possibilities curve (PPC) of each country on a single diagram.
2 marks
Using a PPC diagram, explain how both countries could gain from specialization and trade at the rate of exchange proposed in Text A, paragraph 2.
4 marks
Adam Smith argued that specialization and the division of labour are the main sources of a nation's wealth.
Explain why Smith's ideas of specialization and laissez faire provide support for free trade between countries.
10 marks
Using real-world examples, discuss the view that developing economies should never use trade protection.
15 marks