Explain the goals of market-based and interventionist supply-side policies, draw the LRAS and minimum wage diagrams, and evaluate how well these policies deliver growth, low unemployment and low inflation.
Each is in the Economics glossary, with every other term in the subject.
Laws and regulators that promote competition by preventing firms from abusing market power, blocking mergers that reduce competition, and punishing price fixing and other collusion.
A tax on the profit made when an asset, such as shares or property, is sold for more than it was bought for.
The removal or reduction of government rules that restrict how firms operate or who may enter a market, intended to increase competition and efficiency.
Rewards or penalties, often financial, that influence the decisions of economic agents, such as the higher take-home pay that encourages people to work more or firms to invest.
Government policy that supports the growth of particular industries or sectors judged important for the economy, using tools such as subsidies, tax credits, public investment, protection or state ownership.
The physical capital an economy needs to function, such as roads, railways, ports, energy networks, telecommunications, and water and sanitation systems, often provided or financed by the government.
The ability of a country's firms to sell goods and services in world markets, which depends on the relative price and quality of its output, including unit labour costs and the exchange rate.
Explain the goals of supply-side policies and how they increase an economy’s productive capacity.
Draw an AD/AS diagram showing the effect of supply-side policies on LRAS in the monetarist/new classical and Keynesian models.
Explain market-based supply-side policies that increase competition, make labour markets more flexible and strengthen incentives.
Draw a labour market diagram showing the effect of abolishing a minimum wage.
Explain interventionist supply-side policies: education and training, health care, research and development, infrastructure and industrial policy.
Explain the demand-side effects of supply-side policies and the supply-side effects of fiscal policies.
Evaluate the effectiveness of supply-side policies in achieving economic growth, low unemployment and low and stable inflation.
Supply-side policies are government policies that aim to raise the amount an economy can produce, rather than the amount people want to buy. They work on the quantity and quality of the factors of production and on how efficiently markets use them, so they matter most for long-term economic growth and living standards.
Supply-side policy brings together several key concepts. Every policy is a form of intervention, even when its aim is to reduce the role of the state; most aim to raise efficiency; and many involve a trade-off with equity, because policies that strengthen incentives often widen the gap between high and low incomes.
144 exam-style questions on this subtopic, written in the style of the IB papers. The first has its markscheme open. Counted on
The output an economy can produce depends on the quantity and quality of its factors of production.
Explain the four factors of production and the factor income earned by each.
10 marks
Answers may include:
Terminology: definitions of factors of production, land (natural resources: soil, minerals, forests, water), labour (human physical and mental effort used in production), capital (man-made goods used to produce other goods, such as machinery and infrastructure; also human capital), entrepreneurship (organizing the other factors and bearing risk); factor incomes: rent, wages, interest, profit.
Explanation: each factor is a scarce input combined in the production of goods and services; households own the factors and supply them to firms; in return they receive factor incomes: rent for land, wages for labour, interest for capital and profit for entrepreneurship; profit is a reward for risk-taking and innovation and can be negative; the quantity and quality of each factor determine the position of the PPC.
Diagram: a circular flow of income diagram showing factor services flowing from households to firms and factor incomes (rent, wages, interest, profit) flowing back; or a PPC showing how more or better factors shift the curve outward.
A maximum of [6] should be awarded if factor incomes are not explained, or if fewer than four factors are explained.
Markbands (best fit)
Level |
|---|
One of 40 short multiple-choice questions on 3.7. Pick an answer to see why it's right or wrong.
What is privatisation?
The official deck for this part of the syllabus.
Explain what supply-side policies aim to change in the economy.
Explain how the key concepts of intervention, efficiency and equity apply to supply-side policies.
With a free account, Augment remembers where you stopped and what you have practiced.
Supply-side policies in which the government acts directly to raise productive capacity, for example by spending on education, training, health care, research and development, infrastructure or industrial policy.
The ease with which wages, hours and the number of workers adjust to changes in economic conditions, including how easily firms can hire and dismiss workers.
An organisation of workers that bargains collectively with employers over wages, working conditions and other terms of employment on behalf of its members.
Supply-side policies that raise productive capacity by letting markets work more freely, through more competition, more flexible labour markets and stronger incentives, such as deregulation, privatisation and tax cuts.
The transfer of ownership of a firm or industry from the public sector (the government) to the private sector, usually by selling shares or assets.
Output per unit of input over a period of time; labour productivity is output per worker or per hour worked.
Government policies that aim to increase an economy's productive capacity by improving the quantity and quality of factors of production and the efficiency of markets, shifting LRAS to the right.
The reduction or removal of barriers to international trade, such as tariffs, quotas and subsidies to domestic producers.
Groups that gain from an existing situation and therefore resist policies that would change it, such as protected firms, trade unions or professional bodies lobbying against reform.
Scope: Supply-side policies are taught in the same way at SL and HL: their goals, market-based and interventionist policies (with the LRAS and minimum wage diagrams), how supply-side and demand-side effects overlap, and how effective the policies are. HL adds nothing further here.
Governments manage the macroeconomy with two broad groups of policies. Demand-side policies, monetary policy and fiscal policy, change aggregate demand (AD): they raise or lower total spending to close an output gap in the short run. Supply-side policies change the economy’s capacity to produce: they shift long-run aggregate supply (LRAS) and so change potential output, the level of real GDP the economy can produce when all its resources are fully employed.
Productive capacity depends on how much land, labour, capital and entrepreneurship the economy has and on how productive they are. A larger, healthier and better-educated labour force, more and better capital, new technology and markets that move resources quickly to their most valued uses all raise it. Supply-side policies target one or more of these sources.
Economists group supply-side policies into two families. Market-based policies try to raise capacity by letting markets work more freely, for example by removing regulations, selling state-owned firms or cutting taxes. Interventionist policies raise capacity through direct government action, for example spending on schools, hospitals, research or roads.
Market-based supply-side policies | Interventionist supply-side policies | |
|---|---|---|
Basic idea | Free markets allocate resources efficiently; the government removes obstacles to competition and incentives | Markets under-provide some things that raise capacity; the government provides or funds them directly |
Examples | Deregulation, privatisation, trade liberalisation, anti-monopoly regulation, labour market reforms, tax cuts | Education and training, health care, research and development, infrastructure, industrial policy |
Main cost | Often little direct cost to the budget (tax cuts are the exception); costs fall on some groups through lower equity | Large government spending, financed by taxes or borrowing |
Main link to theory | Monetarist/new classical economics | Keynesian economics and market failure (positive externalities, public goods) |
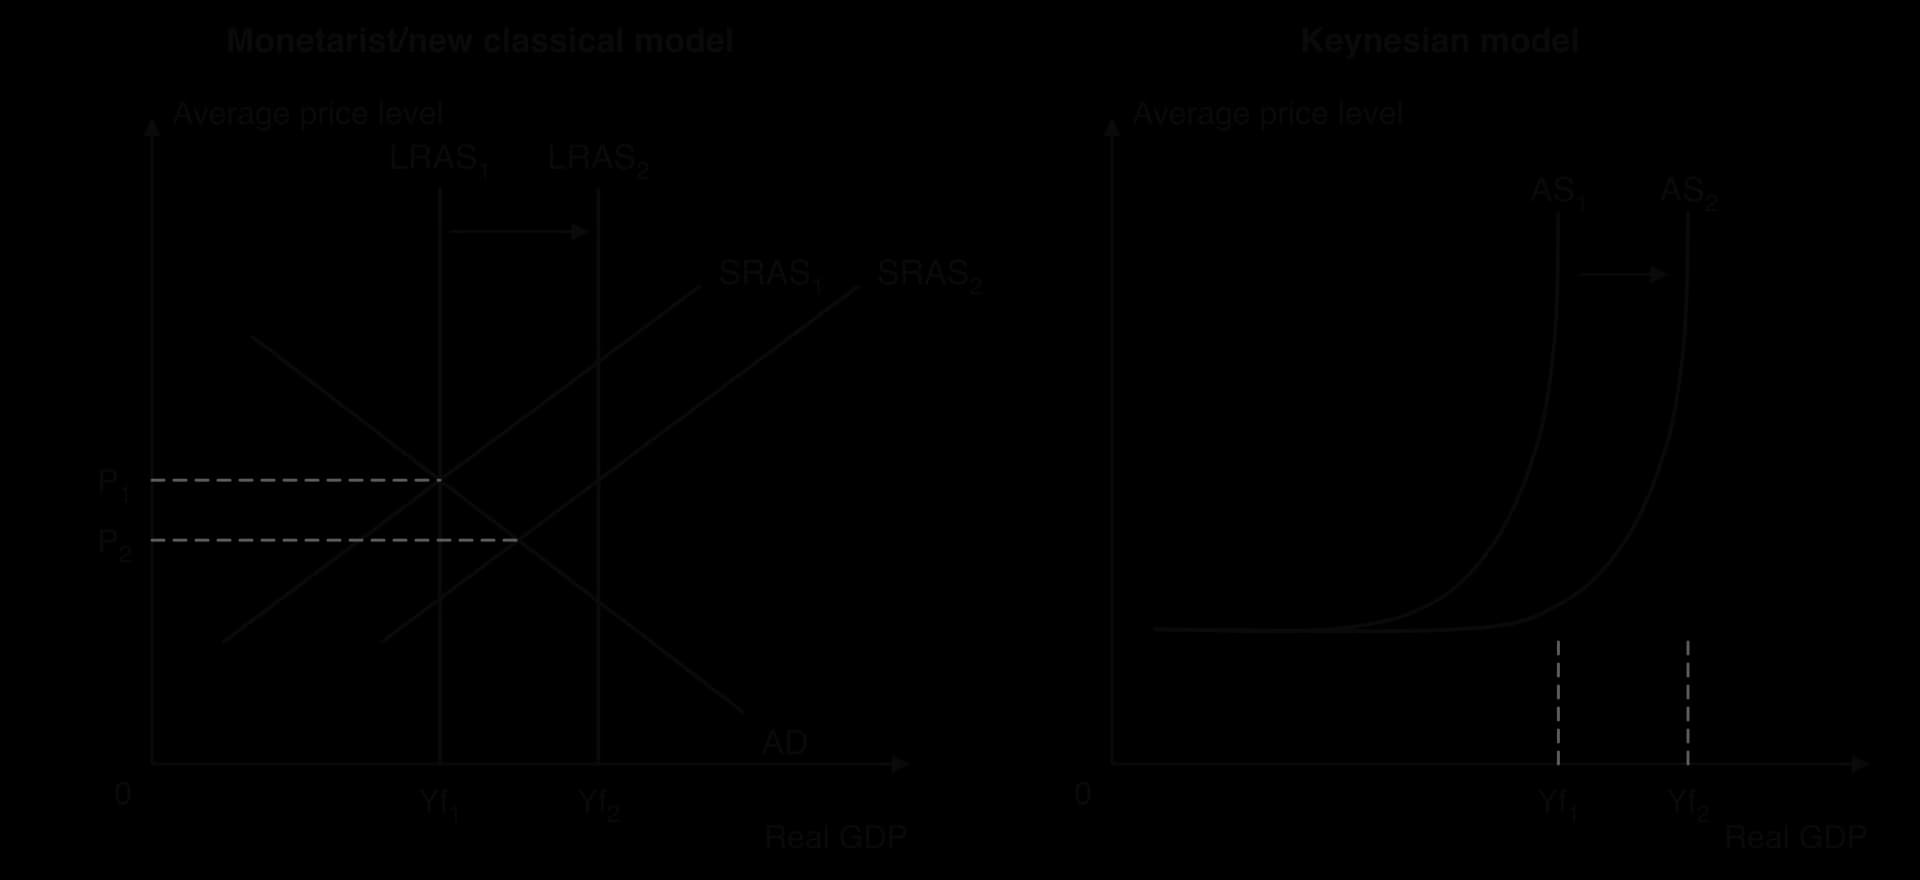
In the monetarist/new classical model, LRAS is vertical at potential output (Yf), because in the long run output depends on the economy’s resources and technology, not on the price level. A successful supply-side policy shifts LRAS to the right, from LRAS₁ to LRAS₂. Lower costs of production and higher productivity also shift short-run aggregate supply (SRAS) to the right, from SRAS₁ to SRAS₂.
In the Keynesian model, the AS curve is horizontal at low output, upward sloping as the economy approaches full capacity and vertical at full employment output. A supply-side policy shifts the whole curve to the right, so the vertical section, which marks full employment output, moves from Yf₁ to Yf₂. In both models the economy can now produce more without running into the capacity limits that cause inflation.
The left-hand diagram shows the most complete version. If AD stays the same, the new long-run equilibrium is where AD meets LRAS₂ and SRAS₂: real GDP rises from Yf₁ to Yf₂ and the average price level falls from P₁ to P₂. In practice AD usually grows at the same time, so the more common result is growth with a stable price level.
Supply-side policies serve several macroeconomic objectives at once. Each goal is linked to the same idea: if the economy can produce more, at lower cost, it can grow faster without inflation and with more people in work.
Demand-side policies can raise real GDP only until the economy reaches its potential output. After that point, more spending mainly raises the price level. Sustained growth in real GDP over decades therefore needs potential output itself to grow, which is what supply-side policies aim for. In the language of the production possibilities curve, they shift the curve outwards rather than moving the economy towards it.
Most long-run growth comes from higher productivity, more output from each worker or each hour of work, rather than from simply adding more workers. Productivity rises when workers have more skills (human capital), more and better machines, better technology and better organisation.
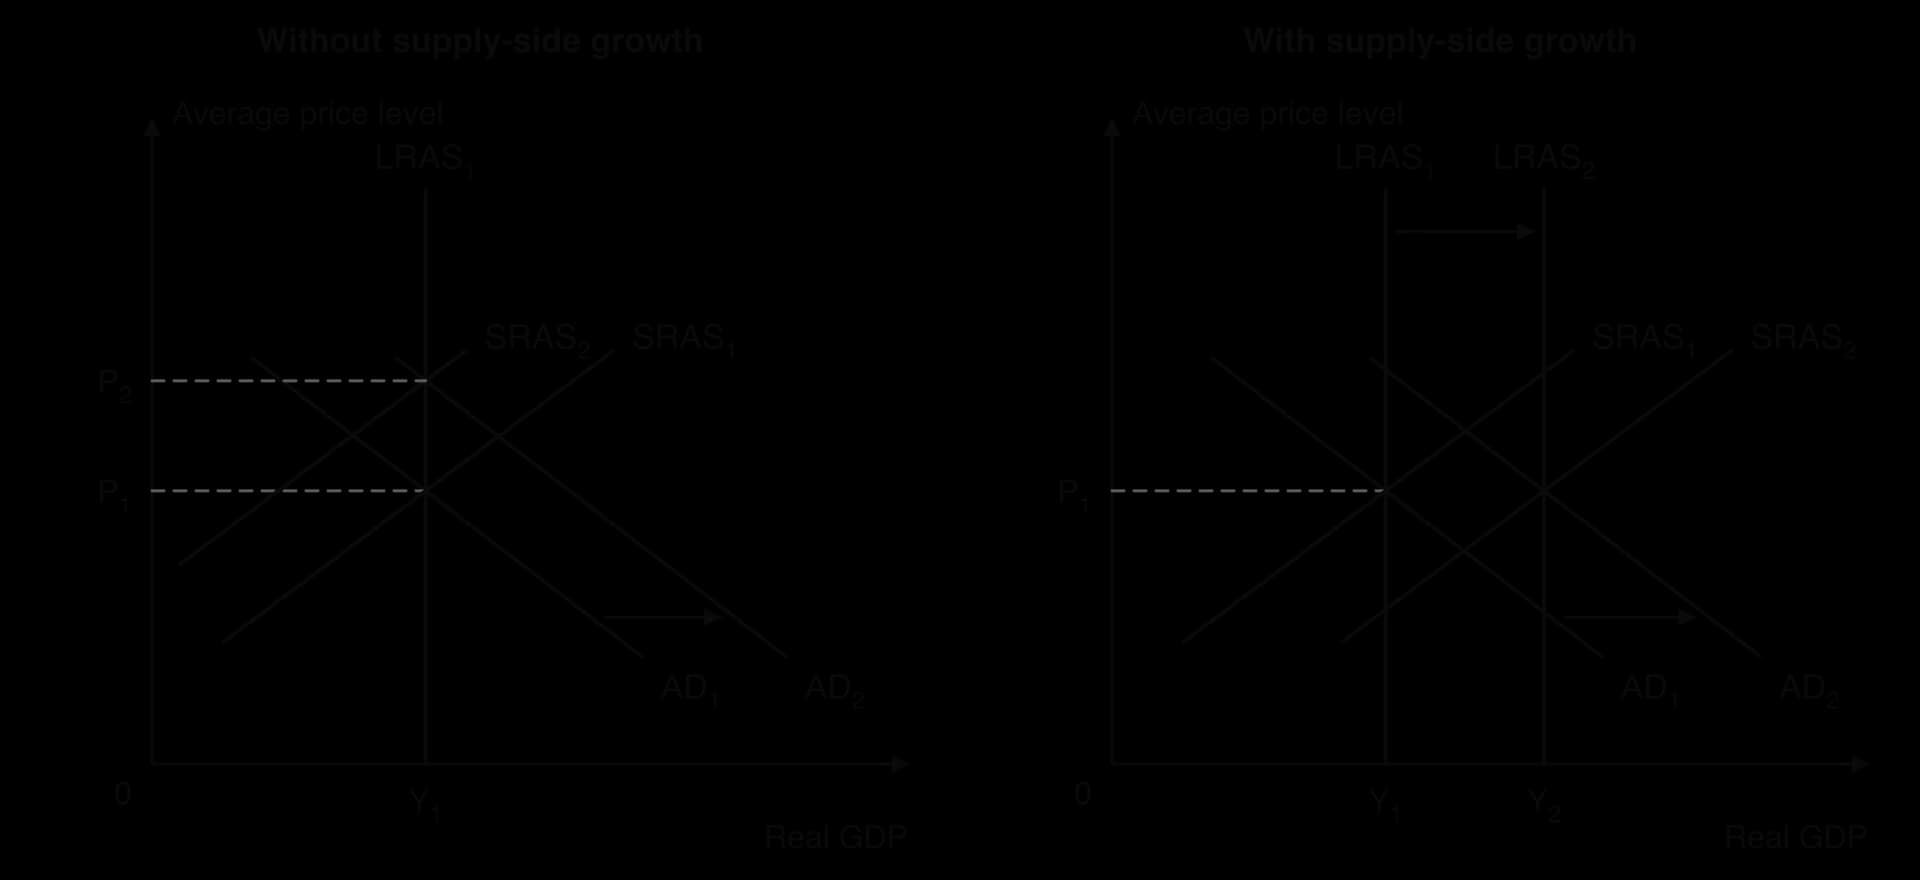
When LRAS grows in step with AD, an economy can grow without inflation. If AD rises while LRAS stays fixed, output can exceed potential only in the short run; wages and other costs then rise, SRAS shifts left and the economy returns to the same real GDP at a higher price level. With supply-side growth, the same rise in AD is matched by more capacity, so real GDP rises and the price level stays stable.
Firms that face strong competition must keep costs low and prices close to cost, or they lose customers to rivals. Competition therefore pushes firms towards productive efficiency (producing at the lowest possible cost) and towards allocative efficiency (producing what consumers value most). Firms with market power face weaker pressure and may let costs rise, a problem economists call X-inefficiency.
Several market-based policies aim at this goal: removing rules that keep new firms out, selling state-owned firms to private owners who must make a profit, opening markets to imports and enforcing competition law. When resources move from inefficient to efficient firms, the economy produces more from the same inputs, which shifts LRAS to the right.
Labour is the largest cost for most firms. Where wages cannot fall when demand for labour is weak, or where it is costly to hire and dismiss workers, firms employ fewer people and unemployment stays high. Supply-side policies that make the labour market more flexible aim to reduce structural unemployment and frictional unemployment, and so lower the natural rate of unemployment.
Flexibility has several dimensions. Wage flexibility lets wages adjust to supply and demand; numerical flexibility lets firms change the size of their workforce; and functional flexibility means workers can move between tasks, jobs and regions because they have the skills and information to do so. Market-based policies mainly target the first two; interventionist policies such as retraining mainly target the third.
When productivity rises faster than wages, the cost of producing each unit of output (unit labour cost) falls. Firms can then hold or cut prices, which reduces cost-push inflation and lowers the inflation rate at any given level of demand. Lower prices relative to other countries make domestic goods more attractive to foreign buyers, which raises exports and reduces imports.
Competitiveness depends on quality as well as price. Policies that support research, training and infrastructure can make a country’s goods more reliable, more advanced or faster to deliver, which lets its firms compete without having the lowest prices.
Innovation, the development of new products and better ways of producing, is the main long-run source of productivity growth. It is risky and expensive, and firms often cannot keep all the benefits for themselves because rivals copy ideas, which is a positive externality. Firms therefore tend to spend less on innovation than is best for society.
Supply-side policies strengthen the incentive to innovate by lowering firms’ costs: tax credits for research and development (R&D), lower taxes on profits, grants, cheaper finance and well-trained workers. When innovation is cheaper and more profitable, more of it takes place, and the gains spread through the whole economy.
Market-based policies rest on the view, associated with monetarist/new classical economists, that free markets allocate resources efficiently through the price mechanism. Government rules, state ownership, strong unions and high taxes are seen as obstacles that blunt incentives and keep resources in low-value uses. Removing those obstacles should shift LRAS to the right.
Regulations can protect consumers and the environment, but some regulations mainly protect existing firms, for example licences that limit the number of taxis or rules that fix prices in an industry. Removing such rules lowers barriers to entry, so new firms enter, prices fall and existing firms are pushed to cut costs and improve their service.
The US Airline Deregulation Act of October 1978 removed federal control of fares, routes and the entry of new airlines. Inflation-adjusted fares fell by roughly 30% between 1976 and 1990, and passenger numbers rose from 207.5 million in 1974 to 721.1 million in 2010. Competition was also harsh: eight major carriers went bankrupt or were liquidated between 1978 and mid-2001.
Sources: Airline Deregulation Act, Public Law 95-504 (1978); US General Accounting Office (1996); Stephen Breyer (2011); “Airline Deregulation Act”, Wikipedia (accessed October 2026).
A state-owned enterprise does not need to make a profit and may be protected from closure by the government, so its managers have weaker incentives to control costs. Private owners want profit, so they press managers to cut waste, invest and respond to customers. Privatisation also raises a one-off sum for the government and ends any losses it was financing.
Privatisation raises efficiency most when it is combined with competition. Selling a state monopoly to private owners without opening the market can simply replace a public monopoly with a private one that charges higher prices. In November 1984 the UK sold 50.2% of British Telecom to the public and its employees; its monopoly had already been broken in 1982, when a rival, Mercury Communications, was licensed to compete, and a regulator was set up to control prices.
Sources: Telecommunications Act 1984; “BT Group”, Wikipedia (accessed October 2026).
 YouTube
Some industries, such as water supply and rail track, are natural monopoly industries: one firm can supply the whole market at the lowest cost. Privatising them does not create competition, so they need a regulator that limits prices and sets quality standards. How well privatisation works in these industries depends on how good that regulation is.
Removing tariffs and quotas exposes domestic firms to foreign competition. Inefficient firms must cut costs or close, and resources move to industries in which the country produces most efficiently. Firms also gain cheaper imported inputs and machinery, which lowers their costs and shifts SRAS and LRAS to the right. Export industries gain access to larger markets and can exploit economies of scale.
Large firms may try to keep rivals out, agree prices with competitors in a cartel or buy up rivals to remove competition. Competition authorities can fine firms for these practices, block mergers or, in extreme cases, require a firm to be broken up. Unlike most market-based policies, this is a policy in which the government takes a more active role, so that markets stay competitive.
Labour market reforms aim to make wages and employment more responsive to supply and demand, lower firms’ labour costs and strengthen the incentive to work. They are among the most controversial supply-side policies, because the people who bear their costs are often low-paid workers.
Strong unions can push wages above the level that would clear the market and resist changes in working practices, which raises labour costs and may reduce employment. Governments that want more flexible labour markets can limit union power, for example by requiring secret ballots before strikes, restricting strikes in essential services or ending rules that make union membership compulsory in some workplaces. The intended result is lower labour costs, more employment and faster adoption of new methods.
Unions also have benefits. They can raise wages where a single large employer has the power to hold wages down, improve safety and give workers a voice that reduces staff turnover. Weakening them may therefore lower wages and worsen working conditions without raising employment much, which makes the policy an equity question as well as an efficiency question.
Unemployment benefits support people while they look for work, but if they are generous or last a long time, the gain from taking a job is small. Cutting the level of benefits, limiting how long they are paid or making them conditional on active job search raises the incentive to accept work. More people seek jobs at each wage rate, so labour supply shifts to the right.
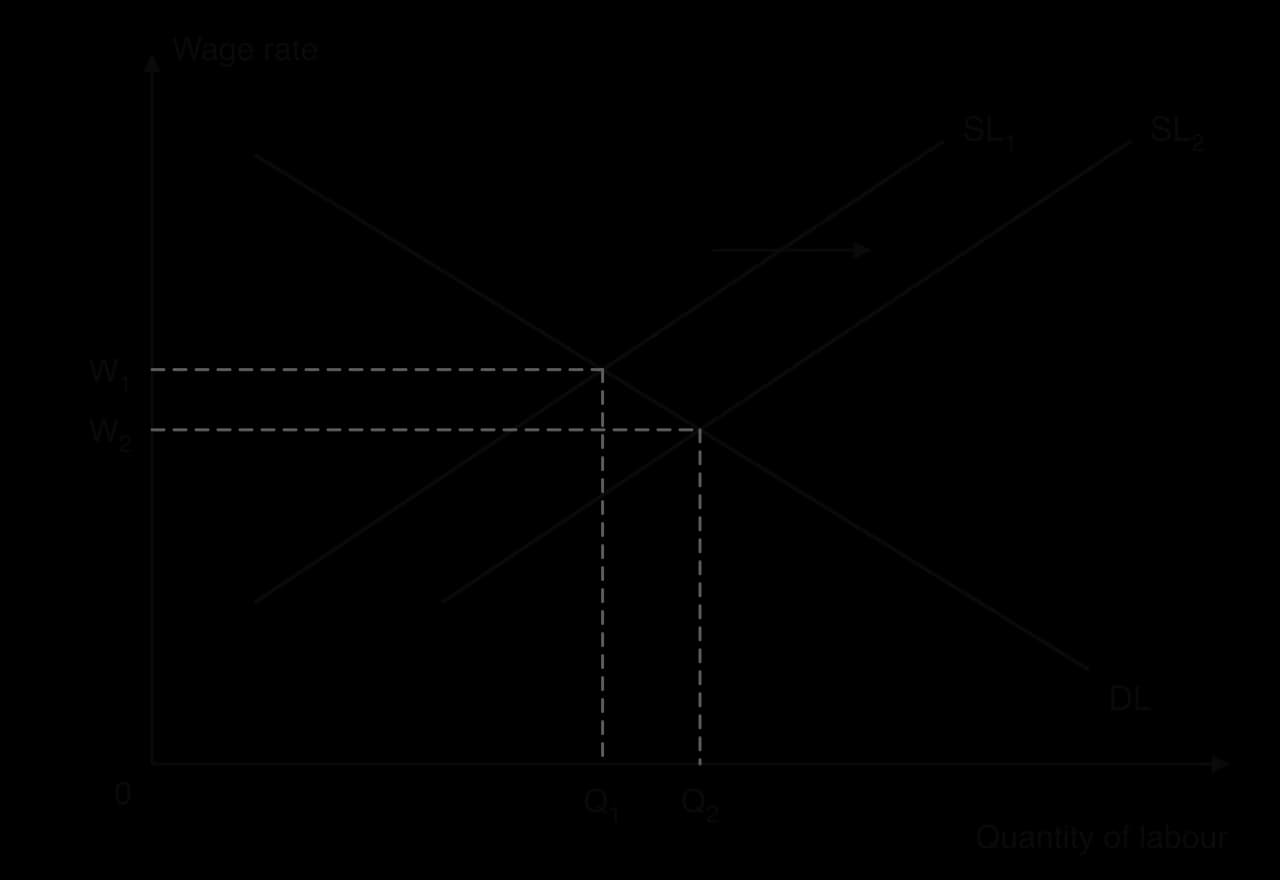
The diagram shows the labour market for the whole economy. As labour supply shifts from SL₁ to SL₂, the wage rate falls from W₁ to W₂, firms hire more workers and employment rises from Q₁ to Q₂. Frictional unemployment also falls if people spend less time between jobs. The cost is borne by unemployed people, who face lower incomes and may be pushed into poorly matched jobs, which can waste their skills.
A minimum wage is a price floor in the labour market: a legal minimum wage rate, Wmin, set above the equilibrium wage, We. At Wmin firms demand only Qd workers, while Qs people want to work, so Qs − Qd workers are unemployed. Those who keep their jobs earn more, but fewer people are employed than at the equilibrium.
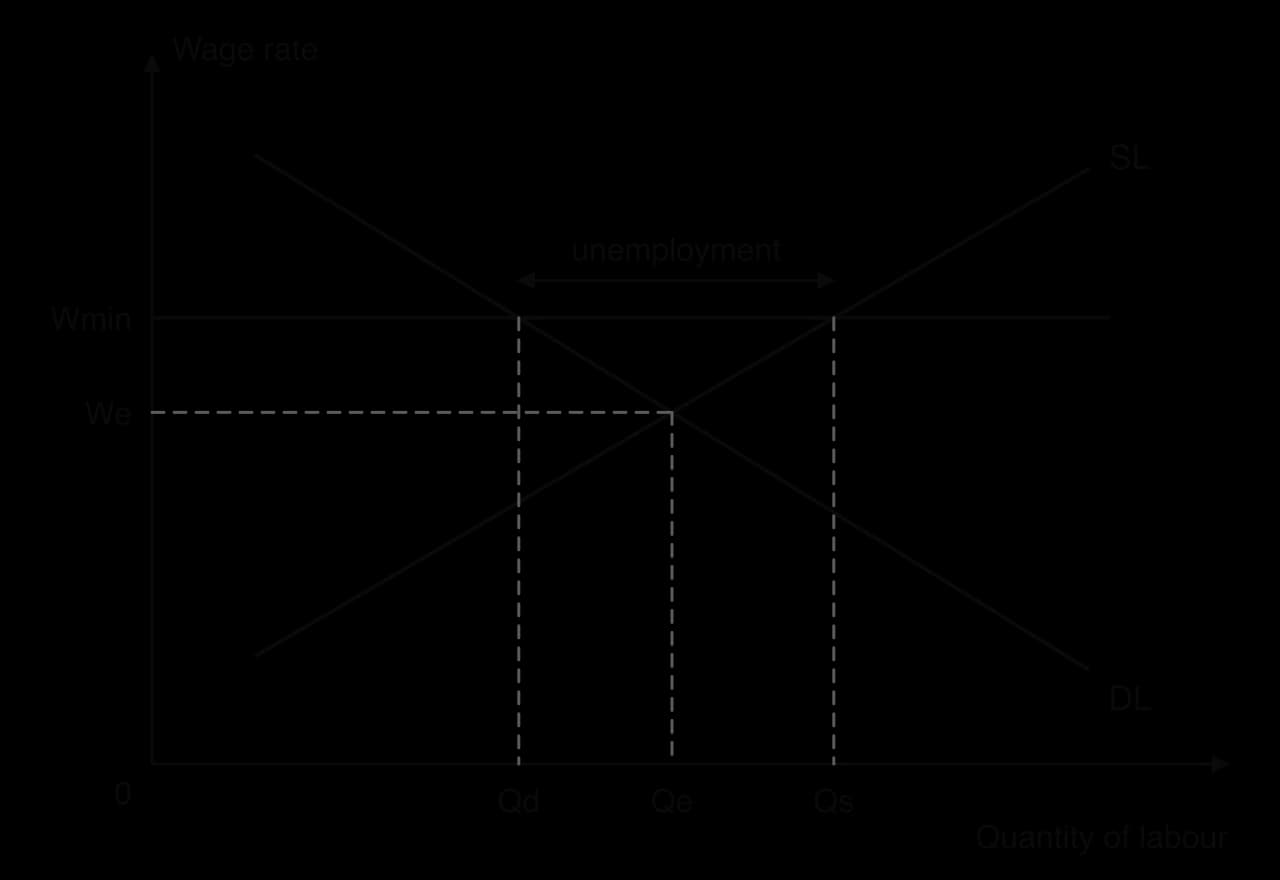
Abolishing the minimum wage removes the floor. The wage falls to We, firms move down the labour demand curve and hire Qe workers, and the excess supply of labour disappears. Employment rises from Qd to Qe, and lower labour costs shift SRAS to the right. Supporters also argue that young and low-skilled workers gain a first job and the training that comes with it.
The diagram assumes a competitive labour market. Where a few large employers dominate local hiring, they can keep wages below the competitive level, and a minimum wage can raise both wages and employment. Evidence also matters: Germany introduced a statutory minimum wage of €8.50 an hour on 1 January 2015, after forecasts that it could cost up to 900,000 jobs, yet later research found no significant job losses. Abolishing a minimum wage would also lower the incomes of the poorest workers and could raise spending on in-work benefits.
Sources: Minimum Wage Act (Germany), 2014; Ifo Institute (2014); London School of Economics Centre for Economic Performance and DIW Berlin studies, summarised in “Minimum wage in Germany” (2026).
Between 2003 and 2005 Germany introduced four packages of labour market reforms, Hartz I to IV. They created “mini-jobs” with lower taxes and social contributions, reorganised job centres and, from January 2005, merged long-term unemployment assistance with social assistance into a single, lower benefit. From 2008 the standard unemployment benefit was generally limited to 12 months, against up to 36 months before.
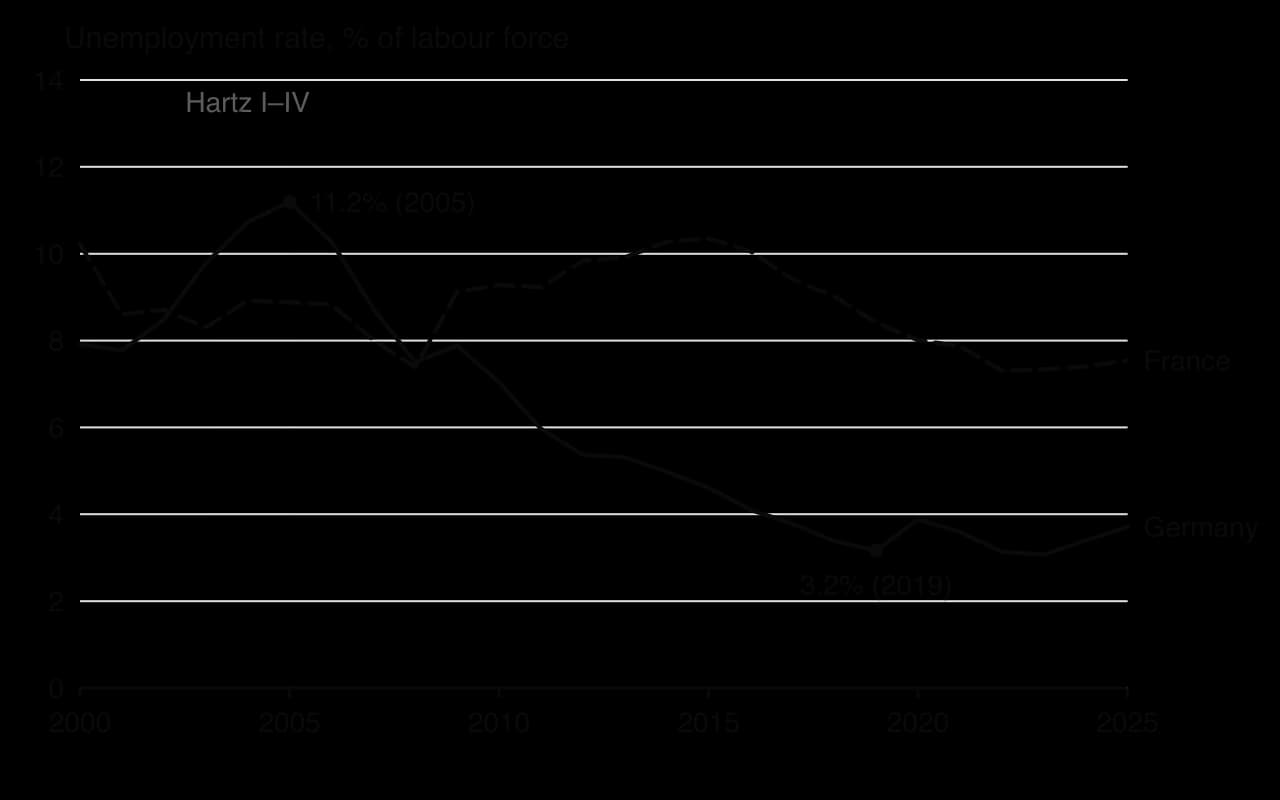
German unemployment fell from 11.2% in 2005 to 3.2% in 2019, while France’s rate stayed far higher. The reforms are often given credit, but other factors also helped: wage restraint agreed by unions, strong demand for German exports and short-time work schemes during the 2009 recession. Critics point to the growth of a low-wage sector and to the large number of children in households receiving the basic benefit, and in 2023 Germany replaced the Hartz IV benefit with a more generous “citizen’s income”.
Sources: World Bank, World Development Indicators (2026); “Hartz concept”, Wikipedia (accessed October 2026).
Taxes reduce the reward from working, saving, investing and starting a business. Incentive-related supply-side policies cut those taxes so that each of these activities becomes more rewarding, with the aim of raising the quantity and quality of labour and capital in the economy.
A cut in personal income tax, especially in the marginal tax rate (the rate paid on each extra unit of income), raises the take-home pay from an extra hour of work. People may work longer hours, seek promotion, train for better-paid jobs or move from benefits into work, so the labour force and the number of hours worked rise. Lower taxes on high earners may also keep skilled workers and entrepreneurs in the country.
The evidence on income tax cuts is mixed. Higher take-home pay makes extra work more attractive, but it also lets people earn their target income in fewer hours, and the two effects pull in opposite directions. Many workers cannot easily change their hours. Second earners in households and people deciding whether to take a job at all tend to respond more than people already in full-time work.
A cut in corporate income tax raises firms’ after-tax profit. Projects that were not worth doing before now earn an acceptable return, so firms invest more in capital and R&D, and foreign firms are more likely to locate in the country. More capital per worker raises productivity and shifts LRAS to the right.
Lower capital gains tax raises the reward to entrepreneurs who build up a business and later sell it, and to investors who provide finance for new firms. Supporters argue that this encourages risk-taking and the creation of new firms. Critics note that most capital gains go to the richest households, so cutting the tax makes the tax system less progressive.
The US Tax Cuts and Jobs Act, signed in December 2017, cut the federal corporate income tax rate to a flat 21%. Later studies found that investment by the affected firms rose, but that the gains in growth and wages were smaller than the law’s supporters had claimed, while corporate tax revenue fell substantially.
Sources: Tax Cuts and Jobs Act, Public Law 115-97 (2017); “Tax Cuts and Jobs Act”, Wikipedia (accessed October 2026).
Interventionist policies are based on the view that markets alone provide too little of the things that raise long-run capacity. Education, health care and research create positive externalities, so private spending on them is below the socially optimal level; infrastructure has features of public good provision; and private investors may be unwilling to take the long-term risks of building new industries. Government provision or funding corrects these market failure problems.
 YouTube
Education and training raise human capital: the knowledge, skills and health that make workers productive. More skilled workers produce more per hour, can use more advanced technology and can move between jobs more easily when the structure of the economy changes. Spending on schools, universities, apprenticeships and retraining programmes for adults therefore shifts LRAS to the right and reduces structural unemployment.

Singapore’s SkillsFuture programme, introduced in 2015, gives every citizen aged 25 and over a credit of S$500 to spend on approved courses. More than 285,000 Singaporeans had used the credit by the end of 2017. The programme aims to keep workers’ skills up to date as technology changes, so that older workers are not left in structural unemployment.
Sources: The Straits Times (1 February 2018); “SkillsFuture”, Wikipedia (accessed October 2026).
Healthy workers miss fewer days, work more effectively and stay in the labour force for longer. Improving the quality of health care, the number of doctors and clinics, and access to them, particularly for low-income groups and rural areas, therefore raises both the quantity and the quality of labour. In low-income countries, where diseases such as malaria cut working days and children’s learning, health spending can be among the most effective supply-side policies of all.
Governments support R&D in three main ways: by funding research in universities and public laboratories, by giving firms tax credits or grants for their own research, and by protecting new ideas through patents. Publicly funded research has produced technologies, such as the internet and GPS, that private firms then developed into products. Since the release of generative artificial intelligence tools in 2022, many governments have increased funding for AI research and for the computing power it needs, on the grounds that these technologies could raise productivity across the whole economy.
Good infrastructure lowers firms’ costs. Faster transport cuts delivery times and the cost of moving goods, reliable electricity avoids lost production, and broadband lets firms reach customers and suppliers anywhere. Better infrastructure also widens the area from which firms can hire workers and the market they can sell to, which raises productivity and attracts investment. It shifts both SRAS and LRAS to the right.
Industrial policy targets particular industries rather than the whole economy. Governments may support industries that seem likely to drive future growth, that have large positive externalities, or that matter for national security. Common tools include subsidies, tax credits, cheap loans, public investment in specialised infrastructure and special economic zones.
India’s Production Linked Incentive (PLI) scheme for smartphones, launched in 2020, pays manufacturers a share of the extra sales they make from factories in India. Apple’s contract manufacturers expanded assembly there, and India’s smartphone exports reached an estimated $30 billion in 2025, about 47% more than in the previous year. Whether the scheme builds lasting capability depends on how much of the value is added in India rather than in imported components.
Sources: IANS, industry estimates of smartphone exports (January 2026).
The main criticism of industrial policy is that governments are poor at “picking winners”: officials may lack the information to know which industries will succeed, and support may go to firms with political influence rather than to the most promising ones. This is a form of government failure: intervention that makes resource allocation worse rather than better.
The case for industrial policy is strongest where a clear market failure exists, such as a positive externality from research, and where support is temporary, conditional on results and open to competition between firms.
Many supply-side policies change AD before they change LRAS. Spending on infrastructure, education or health is part of government spending, a component of AD, so it raises AD as soon as the money is spent, while the extra capacity it creates appears only once the project is finished and in use. Tax cuts raise disposable income and profits, which increase consumption and investment, again raising AD in the short run.
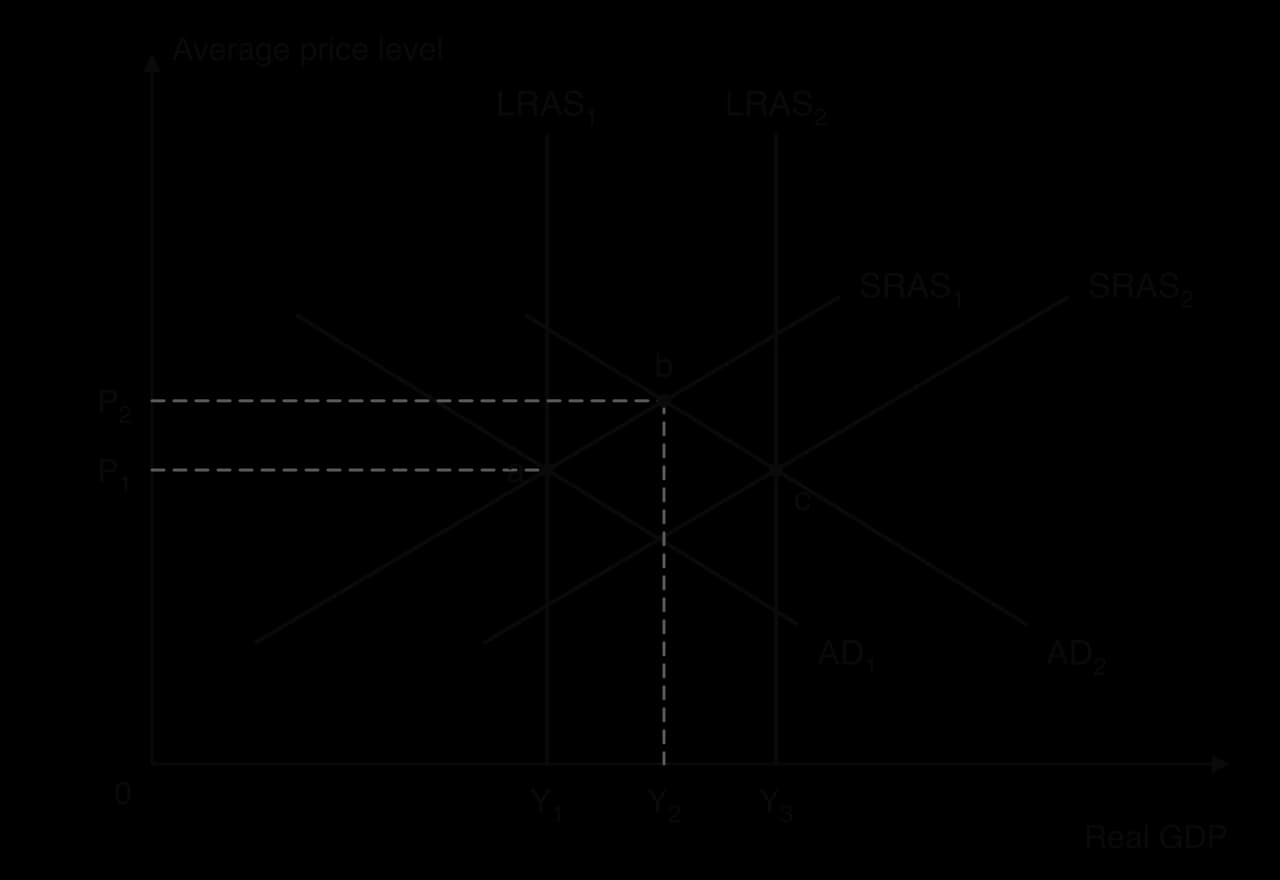
The diagram shows the two stages. In the short run, AD shifts from AD₁ to AD₂ and the economy moves from point a to point b: real GDP rises from Y₁ to Y₂ and the price level rises from P₁ to P₂. In the long run, the new roads or railways raise productive capacity, so LRAS₁ shifts to LRAS₂ and SRAS₁ to SRAS₂. The new long-run equilibrium is at point c, with output Y₃ and the price level back at P₁.
The timing matters for policy. If the economy has a deflationary gap, the demand-side effect is welcome: it raises output and employment while the supply-side benefits are still being built. If the economy is already close to potential output, the demand-side effect adds to inflationary pressure in the short run, before the extra capacity arrives.
The overlap also works the other way. Fiscal policy is normally treated as demand management, but government spending on capital expenditure such as schools and transport, and on current spending such as teachers’ salaries and health care, also raises productive capacity over time. Tax changes alter incentives to work and invest, which are supply-side effects. A government choosing between different ways to stimulate AD can therefore favour those that also raise LRAS, such as investment in infrastructure, rather than spending that adds nothing to future capacity.
Supply-side policies are judged by how well they achieve the macroeconomic objectives, at what cost, how quickly, and who gains and loses. Market-based and interventionist policies have different strengths and constraints, so each needs its own evaluation.
Better resource allocation. Competition and the price mechanism move resources towards their most valued uses and push firms towards productive efficiency, which raises output from the same inputs.
Little burden on the government budget. Deregulation, privatisation, trade liberalisation and labour market reforms cost the government little, and privatisation brings in revenue. Governments with high debt can still use them. (Tax cuts are the exception: they reduce revenue.)
No risk of government failure in choosing industries. Market-based policies do not require officials to decide which firms or sectors will succeed; prices and profits determine which firms and sectors grow.
Equity. Cutting benefits, weakening unions, abolishing minimum wages and cutting taxes on high incomes and capital gains tend to widen income inequality. The gains go mostly to firms and high earners, while low-paid workers and unemployed people bear the costs.
Time lags. New firms take time to enter deregulated markets, workers take time to respond to new incentives, and the benefits of privatisation appear only once new owners have restructured the firm.
Vested interests. Groups that gain from the existing situation resist reform.
Environmental damage. Deregulation can remove rules that protect the environment, and faster growth based on more production can increase pollution and resource depletion, which conflicts with sustainability.
Vested interests make many market-based reforms politically difficult. Taxi drivers oppose more licences, protected industries lobby against lower tariffs, and public sector workers may strike against privatisation. Reforms may then be delayed, weakened or reversed after an election, which reduces their long-run effect.
The main strength of interventionist policies is that they directly support the sectors and factors most important for growth. Education and health raise human capital, research produces new technology and infrastructure lowers costs for every firm, and none of these depends on firms responding to incentives in the way the market-based approach assumes. They also tend to improve equity, because free or subsidised education and health care benefit low-income households most and reduce inequality of opportunity.
Their main constraints are cost and time lags. Schools, hospitals and railways require large government spending, which has an opportunity cost in other public services, or must be financed by higher taxes or more borrowing. The benefits come slowly: a child who starts school today joins the labour force in ten to fifteen years, and large infrastructure projects take years to plan and build. Governments may also choose the wrong projects, and spending decisions may be influenced by politics rather than economic returns.
Objective | Strengths of supply-side policies | Limitations |
|---|---|---|
Economic growth | The only way to raise potential output and so achieve sustained long-run growth; both types raise productivity | Slow to work; growth depends on many other factors (demand, world trade, technology); market-based growth may not be environmentally sustainable |
Low unemployment | Reduce structural and frictional unemployment (training, flexibility, incentives); infrastructure spending also creates jobs in the short run | Do little against cyclical unemployment in a recession, which needs demand-side policy; flexible labour markets may raise insecure, low-paid work |
Low and stable inflation | Lower unit costs reduce cost-push inflation; growth in LRAS lets AD grow without inflation | Too slow to deal with a sudden inflationary shock; the demand-side effects of spending and tax cuts can add to inflation in the short run |
Equity | Interventionist education and health policies widen opportunity | Market-based policies (benefit cuts, tax cuts for high earners, weaker unions) tend to increase inequality |
Supply-side policies and demand-side policies are best seen as complements. Demand management deals with short-run fluctuations in the business cycle; supply-side policy raises the long-run growth path around which the economy fluctuates. A government that relies only on demand-side policy will find that each expansion ends in inflation at a lower level of output than it would otherwise reach.
Which type of supply-side policy works better depends on the country’s situation. An economy with heavily regulated markets, inefficient state-owned firms and high trade barriers may gain most from market-based reforms. An economy with low school enrolment, poor health and weak infrastructure, as in many low-income countries, may gain most from interventionist investment. Most governments combine the two, and the choice between them also reflects value judgments about equity and the proper role of the state.
Key concept | How it applies to supply-side policies |
|---|---|
Efficiency | Market-based policies aim to raise productive and allocative efficiency through competition and incentives. |
Equity | Labour market and tax reforms often widen inequality; education and health spending can reduce inequality of opportunity. |
Intervention | Interventionist policies use government provision to correct market failure; market-based policies reduce intervention but still require the government to act. |
Sustainability | Growth in LRAS can increase pressure on the environment unless policy directs investment towards clean technology. |
Change | Training and flexible labour markets help workers and firms adapt to structural and technological change. |
By the early 2020s most of the world’s advanced semiconductors were made in East Asia, and the chip shortage of 2020–23 showed how a disruption in supply could halt car factories and other industries. The US government responded with the CHIPS and Science Act, signed on 9 August 2022. It appropriated $52.7 billion for the semiconductor industry, including $39 billion of manufacturing incentives (grants, loans and loan guarantees) and $11 billion for research, and created a 25% investment tax credit for building chip factories.
The act is a clear example of an interventionist supply-side policy, and more specifically of industrial policy. It targets one industry judged vital for growth and national security and uses subsidies and tax credits to lower the cost of investing there. The aim is to raise the US capacity to produce chips, which in the AD/AS model is a rightward shift of LRAS, and to reduce dependence on imports, a goal connected to international competitiveness and security.
Large awards followed in 2024: about $7.9 billion for Intel, $6.6 billion for TSMC and $6.1 billion for Micron, each to build or expand factories in the United States, and preliminary terms of $6.4 billion for Samsung. Construction spending on manufacturing structures rose from an annual rate of about $80 billion before 2022 to a peak of $250 billion in September 2024. An industry association counted more than $630 billion of announced private investment in about 140 projects by December 2025.
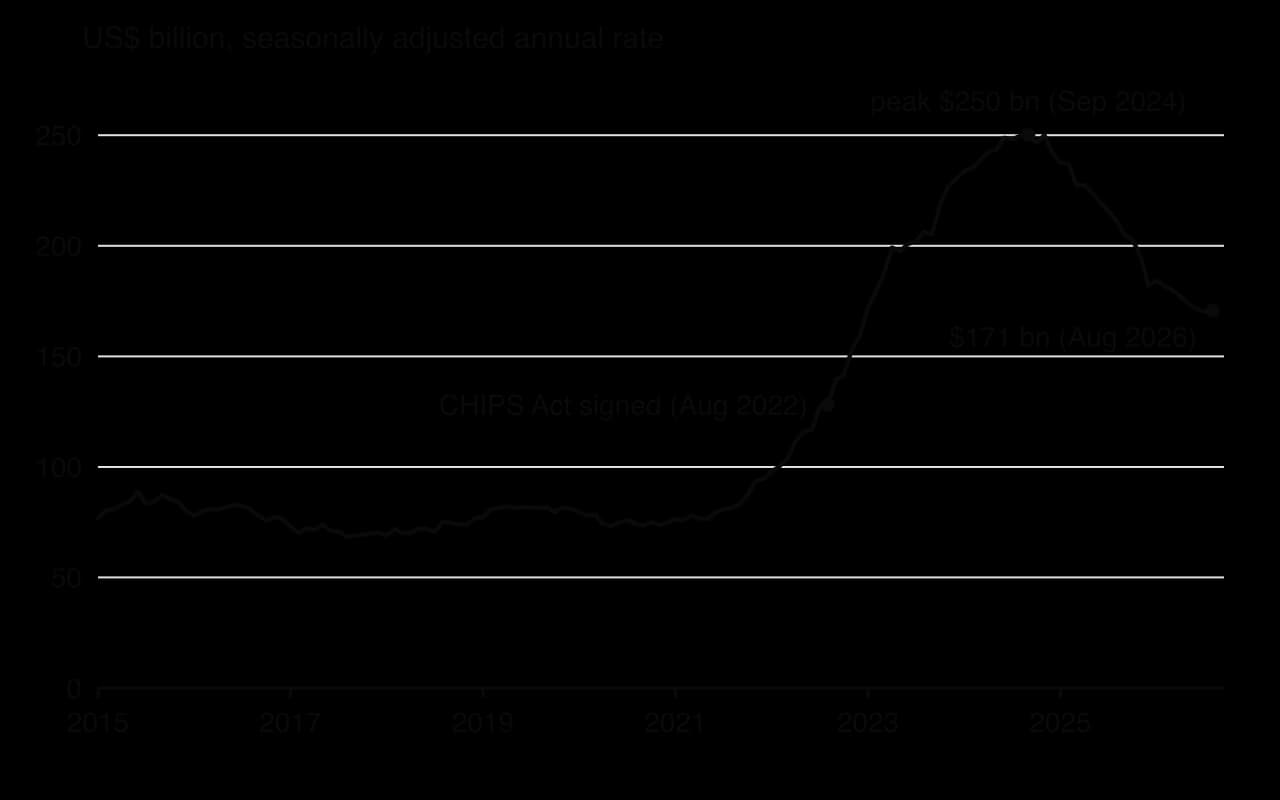
The chart shows the demand-side effect of the policy arriving first. Building factories is investment, a component of AD, so the boom raised demand for construction workers and materials years before any chip was produced. The supply-side effect, more chip-making capacity, depends on the factories being finished and run efficiently, and here the time lags have been long. Only two small grants had been awarded by January 2024, TSMC delayed the opening of its second Arizona plant from 2026 to 2028, partly because of a shortage of skilled workers, and Intel delayed its Ohio site.
The policy also shows the constraints of interventionist policy. Its cost is large and falls on taxpayers; it relies on officials choosing which firms to support; and critics warned of a subsidy race with the EU and other governments. Construction spending has fallen since late 2024, to $171 billion at an annual rate in August 2026. The chart covers all factory building, including battery and electric-vehicle plants supported by other laws, so it overstates the effect of the CHIPS Act alone.
From 2025 the new administration changed the approach while keeping the law. In August 2025 the government took a 9.9% ownership stake in Intel in exchange for $11.1 billion of grants, most of them under the act, and it raised the investment tax credit by 10 percentage points. Taking equity in private firms moves the policy further from market-based thinking and closer to state ownership. Whether the act raises US productive capacity at a reasonable cost will only be clear once the new factories are producing at scale, which illustrates how long the time lags of interventionist supply-side policy can be.
Sources: CHIPS and Science Act, Public Law 117-167 (2022); US Department of Commerce CHIPS award announcements (2024); Semiconductor Industry Association (December 2025); US Census Bureau, Construction Spending, via FRED (October 2026); “CHIPS and Science Act”, Wikipedia (accessed October 2026).
Supply-side policies appear in every paper. Paper 1 questions often ask you to explain how a supply-side policy works (part (a)) and then to evaluate its effectiveness, or to compare it with demand-side policy (part (b)). Paper 2 uses the topic in diagram questions and in the final 15-mark evaluation, and Paper 3 often asks HL students to recommend a policy to raise growth or reduce unemployment.
Paper 2-style items (built around a text on a country that has cut corporation tax and privatised its rail network):
(a) Define the term privatisation indicated in bold in the text. [2]
(c) Using an AD/AS diagram, explain how the cut in corporation tax could increase the country’s potential output. [4]
(d) Using a labour market diagram, explain why abolishing the minimum wage could increase employment. [4]
(g) Using information from the text/data and your knowledge of economics, evaluate the government’s use of market-based supply-side policies to promote economic growth. [15]
For item (g), a strong answer uses each policy named in the text, explains its mechanism with the LRAS diagram, and evaluates using the text’s data: the cost of the tax cut to the budget, the time it takes for rail investment to rise after privatisation, the effect on equity, and the need for a rail regulator if the network is a natural monopoly.
Supply-side policies aim to raise productive capacity, shifting LRAS (or the Keynesian AS curve) to the right and increasing potential output.
Their goals are long-term growth, more competition and efficiency, flexible labour markets with lower unemployment, lower inflation with stronger international competitiveness, and more innovation.
Market-based policies (deregulation, privatisation, trade liberalisation, anti-monopoly regulation, labour market reforms, tax cuts) let markets work more freely.
Interventionist policies (education and training, health care, R&D, infrastructure, industrial policy) raise capacity through direct government action.
Many supply-side policies raise AD first and LRAS later; many fiscal policies also have supply-side effects.
Market-based policies cost the budget little but raise equity concerns and face vested interests; interventionist policies support key sectors directly but are costly and slow.
Supply-side policies are the main route to sustained growth without inflation, but they work slowly and do little against cyclical unemployment.
I can define supply-side policies and explain how they increase potential output.
I can draw the LRAS shift in the monetarist/new classical model and the AS shift in the Keynesian model.
I can explain each of the five goals of supply-side policies.
I can explain at least six market-based policies and classify them correctly.
I can draw and explain the minimum wage diagram and the effect of abolishing a minimum wage.
I can explain five interventionist policies and how each raises productive capacity.
I can explain the demand-side effects of supply-side policies with an AD/AS diagram.
I can evaluate supply-side policies against growth, unemployment and inflation, using real examples.
Marks
Descriptor |
|---|
0 | 0 | The work does not reach a standard described by the descriptors below. |
1 | 1–2 | Little understanding of the specific demands of the question. Relevant economic theory is stated but not relevant. Economic terms are stated but not relevant. |
2 | 3–4 | Some understanding of the specific demands of the question. Relevant economic theory is described. Some relevant economic terms are included. |
3 | 5–6 | The specific demands of the question are understood but only partially addressed. Relevant economic theory is partly explained. Some relevant terms are used appropriately. Where appropriate, relevant diagram(s) are included. |
4 | 7–8 | The specific demands of the question are understood and addressed. Relevant economic theory is explained. Relevant terms are used mostly appropriately. Where appropriate, relevant diagram(s) are included and explained. |
5 | 9–10 | The specific demands of the question are understood and addressed. Relevant economic theory is fully explained. Relevant terms are used appropriately throughout. Where appropriate, relevant diagram(s) are included and fully explained. |
Using real-world examples, evaluate the view that investment in education and training is the most effective way to increase an economy's productive capacity.
15 marks
Answers may include:
Terminology: human capital, productive capacity, potential output, long-run aggregate supply (LRAS), supply-side policies, interventionist and market-based policies, infrastructure, productivity.
Explanation: education and training raise labour productivity, adaptability and innovation, increasing the quality of the labour factor; this shifts the PPC and LRAS outward and can reduce structural unemployment; positive externalities justify government provision or subsidy.
Diagram(s): PPC shifting outward; AD/AS diagram showing LRAS (or the vertical section of Keynesian AS) shifting right.
Synthesis/evaluation: long time lags before benefits appear; high opportunity cost for government budgets; benefits depend on quality and on whether skills match labour market needs; brain drain may remove the gains; alternatives may be more effective in some contexts: infrastructure investment, investment in physical capital, research and development, market-based policies (deregulation, labour market reform, competition policy), institutional change and property rights; the relative effectiveness depends on the country's stage of development and binding constraints; consideration of 'most effective' and a reasoned judgement.
Examples: South Korea's heavy investment in education since the 1960s and its rapid growth; Germany's dual vocational training (apprenticeship) system; Singapore's SkillsFuture programme (2015); India's large infrastructure programmes as an alternative route to capacity growth; emigration of trained nurses and doctors from countries such as Zimbabwe reducing the returns to education.
For 'most effective' questions, a maximum of [12] should be awarded where no alternative policies are considered.
N.B. Terminology, theory, diagrams and examples given in part (a) and referred to in part (b) should be rewarded.
Examiners should be aware that candidates may take a different approach which, if appropriate, should be rewarded.
Markbands (best fit)
Level | Marks | Descriptor |
|---|---|---|
0 | 0 | The work does not reach a standard described by the descriptors below. |
1 | 1–3 | Little understanding of the specific demands of the question. Theory is stated but not relevant. Terms are not relevant. No synthesis or evaluation. Real-world examples are identified but not relevant. |
2 | 4–6 | Some understanding of the demands. Relevant theory is described. Some relevant terms are included. Synthesis or evaluation is superficial. A relevant real-world example is identified. |
3 | 7–9 | The demands are understood but only partially addressed. Theory is partly explained. Some terms are used appropriately. Relevant diagram(s) are included where appropriate. Synthesis or evaluation is appropriate but lacks balance. Example(s) are identified and partly developed in context. |
4 | 10–12 | The demands are understood and addressed. Theory is explained. Terms are used mostly appropriately. Diagram(s) are included and explained. Synthesis or evaluation is appropriate and mostly balanced. Example(s) are identified and developed in the context of the question. |
5 | 13–15 | The demands are understood and addressed. Theory is fully explained. Terms are used appropriately throughout. Diagram(s) are included and fully explained. Synthesis or evaluation is effective and balanced. Example(s) are identified and fully developed to support the argument. |
An economy's choice between producing capital goods and consumer goods today affects what it can produce in the future.
Using a production possibilities curve (PPC), explain why an economy that devotes more resources to capital goods today may be able to produce more consumer goods in the future.
10 marks
Using real-world examples, evaluate the effectiveness of interventionist supply-side policies in increasing an economy's potential output.
15 marks
Several economies that were once centrally planned have moved towards greater use of markets.
Explain how a planned economy answers the basic economic questions and why it may fail to allocate resources efficiently.
10 marks
Using real-world examples, evaluate the effects on stakeholders of the privatization of state-owned enterprises.
15 marks