Explain and draw the four externality diagrams, merit and demerit goods and the tragedy of the commons, then evaluate taxes, permits, regulation, subsidies and international agreements as responses.
Each is in the Economics glossary, with every other term in the subject.
The shift of production and emissions from a country with strict carbon pricing to countries with weaker rules, so that global emissions fall less than domestic emissions.
A tax on the carbon content of fossil fuels, or on each tonne of carbon dioxide emitted, intended to make polluters pay for the external cost of greenhouse gas emissions.
The management of a common pool resource by its own users, who agree, monitor and enforce rules on its use without relying mainly on government or private ownership.
A natural resource that is rivalrous but non-excludable, such as fish in the open sea, groundwater or forests, so that it tends to be overused and depleted.
A good or service that is more harmful to people than they realise, such as cigarettes or alcohol, so it is overconsumed in a free market; it often has negative consumption externalities.
Government campaigns and information that change people’s knowledge of a good’s costs or benefits, so as to raise demand for merit goods and lower demand for demerit goods.
Describes a good from which people who do not pay can be prevented from benefiting, for example by charging an entry price.
Explain why the socially optimal output is where marginal social benefit equals marginal social cost (MSB = MSC).
Draw and explain diagrams of negative and positive externalities of production and consumption, with the welfare loss shaded.
Distinguish between merit goods and demerit goods and explain why free markets misallocate resources to them.
Explain the characteristics of common pool resources and why they lead to the tragedy of the commons and unsustainable production.
Draw diagrams of Pigouvian and carbon taxes, subsidies, regulation and education, and explain how each one moves output towards the social optimum.
Explain how tradable permits, international agreements, collective self-governance and government provision work.
Calculate the welfare loss caused by an externality from a diagram (HL).
Evaluate the policies used to correct externalities and manage common pool resources, including the difficulty of measuring externalities.
Discuss why international cooperation is needed for global sustainability problems and why it is hard to achieve.
Markets do not always produce the quantity of a good that is best for society. When the production or consumption of a good affects people outside the transaction, or when a shared natural resource has no owner, the free market produces too much or too little, and governments have reasons to step in.
This kind of market failure lies behind many of today’s most pressing problems: air pollution, climate change, overfishing and the spread of preventable diseases. It brings together the key concepts of efficiency,
255 exam-style questions on this subtopic, written in the style of the IB papers. The first has its markscheme open. Counted on
Economies differ in the extent to which resources are allocated by markets or by the state.
Distinguish between a free market economy and a planned economy in the way each answers the basic economic questions.
10 marks
Answers may include:
Terminology: definitions of free market economy (resources privately owned and allocated through the price mechanism), planned (command) economy (resources mostly owned by the state and allocated by central planners), the basic economic questions (what and how much to produce, how to produce, for whom to produce).
Explanation: in a free market economy, what to produce is decided by consumer demand and profit signals; how to produce is chosen by firms seeking the lowest-cost combination of factors; for whom is decided by ability to pay, which depends on income earned from factors of production. In a planned economy, planners set output targets (what), allocate inputs and technology to state enterprises (how) and distribute output through state-set prices, rationing or provision according to perceived need (for whom). Distinguishing features: decentralized versus centralized decision-making; private versus public ownership; price signals versus administrative targets.
Diagram: a demand and supply diagram showing how a change in demand leads to a price change that signals producers to reallocate resources; may use a PPC to show the chosen combination of goods.
A maximum of [6] should be awarded if only one economic system is explained, or if the basic economic questions are not addressed.
Markbands (best fit)
One of 66 short multiple-choice questions on 2.8. Pick an answer to see why it's right or wrong.
A factory’s pollution harms people living nearby. What is this an example of?
The official deck for this part of the syllabus.
What is market failure?
State the five sources of market failure.
With a free account, Augment remembers where you stopped and what you have practiced.
The situation where consumers or producers lack the information they need to make choices that serve their own interest, such as underestimating the harm from smoking.
Treaties or accords between countries in which they agree to take joint action, such as limiting emissions, on problems that no single country can solve alone.
The extra benefit to a consumer of consuming one more unit of a good; the demand curve shows it.
The extra cost to a producer of producing one more unit of a good; in a competitive market the supply curve shows it.
The total extra benefit to society of consuming one more unit of a good: marginal private benefit plus any marginal external benefit.
The total extra cost to society of producing one more unit of a good: marginal private cost plus any marginal external cost.
The situation where a free market fails to allocate resources efficiently, so that too much or too little of a good is produced and consumed compared with the socially optimal output.
A good or service that is better for people than they realise, such as education or healthcare, so it is underconsumed in a free market; it often has positive consumption externalities.
A cost of producing or consuming a good that falls on third parties and is not paid for by the producer or consumer, so the good is overproduced or overconsumed.
An external cost created when a good is consumed, borne by third parties, so that marginal social benefit is less than marginal private benefit, as with second-hand smoke or traffic congestion.
An external cost created when a good is produced, borne by third parties, so that marginal social cost is greater than marginal private cost, as when a factory pollutes a river.
The situation where more resources are used to produce a good than is socially optimal, so output is above the level where MSB = MSC.
The international climate treaty adopted in December 2015 under which countries aim to keep global warming well below 2 °C and set their own national emissions pledges.
An indirect tax set to equal the external cost of a good at the socially optimal output, so that producers or consumers pay the full social cost and output falls to where MSB = MSC.
The principle that those who cause pollution should bear its costs, for example through taxes, charges or the purchase of permits.
A benefit of producing or consuming a good that is enjoyed by third parties who do not pay for it, so the good is underproduced or underconsumed.
An external benefit created when a good is consumed, enjoyed by third parties, so that marginal social benefit is greater than marginal private benefit, as with vaccination or education.
An external benefit created when a good is produced, enjoyed by third parties, so that marginal social cost is less than marginal private cost, as when a firm trains workers who later move to other firms.
Describes a good whose consumption by one person reduces the amount available for others, such as a fish caught from the sea.
The level of output at which marginal social benefit equals marginal social cost (MSB = MSC), where resources are allocated efficiently and social surplus is maximised.
A person, firm or group that is not directly involved in buying or selling a good but is affected by its production or consumption.
A scheme in which a government caps total pollution, issues permits to emit up to the cap, and lets firms buy and sell the permits, so emissions are cut where it is cheapest to do so.
The overuse and depletion of a common pool resource that happens when each user, acting in their own interest, takes more of it because the cost of depletion is shared by all users.
The situation where fewer resources are used to produce a good than is socially optimal, so output is below the level where MSB = MSC.
In a competitive market, the price mechanism brings quantity demanded and quantity supplied into balance. Consumers buy until the benefit of one more unit to them equals the price, and producers sell until the cost of one more unit to them equals the price. If those private benefits and costs are the only benefits and costs that exist, the equilibrium is also the best outcome for society.
Problems arise when some costs or benefits fall on other people. A free market then still reaches an equilibrium, but it allocates the wrong amount of resources to the good from society’s point of view.
Economists identify several sources of market failure: externalities, common pool resources, public goods, asymmetric information and market power. Externalities and common pool resources are among the most widespread, and they are closely related to public goods, which share the feature that people cannot easily be made to pay for them.
To see why markets misallocate resources, economists separate the costs and benefits that the buyer and seller take into account from those that fall on everyone else. Four marginal values are needed. “Marginal” means the cost or benefit of one more unit.
Consumers base their decisions only on MPB. A driver deciding whether to make an extra car journey weighs the time saved and the comfort of the journey against the cost of fuel; the noise and fumes that other people suffer play no part in the decision.
Firms base their decisions only on MPC: wages, raw materials, energy and other costs they actually pay. The abbreviation MPC is also used for the marginal propensity to consume in macroeconomics; in the study of externalities it always means marginal private cost.
Society’s benefit includes the consumer’s benefit and any benefit that spills over to others. When there is no spillover, MSB and MPB are the same curve.
The difference between a private and a social value is the spillover onto people outside the market. These spillovers are called externalities, and the people who bear them are third parties.
An externality can be negative, when it imposes a cost on third parties, or positive, when it gives them a benefit. It can arise from production (the factory, the farm, the power station) or from consumption (the smoker, the driver, the person who is vaccinated). Combining the two gives four types, each with its own diagram.
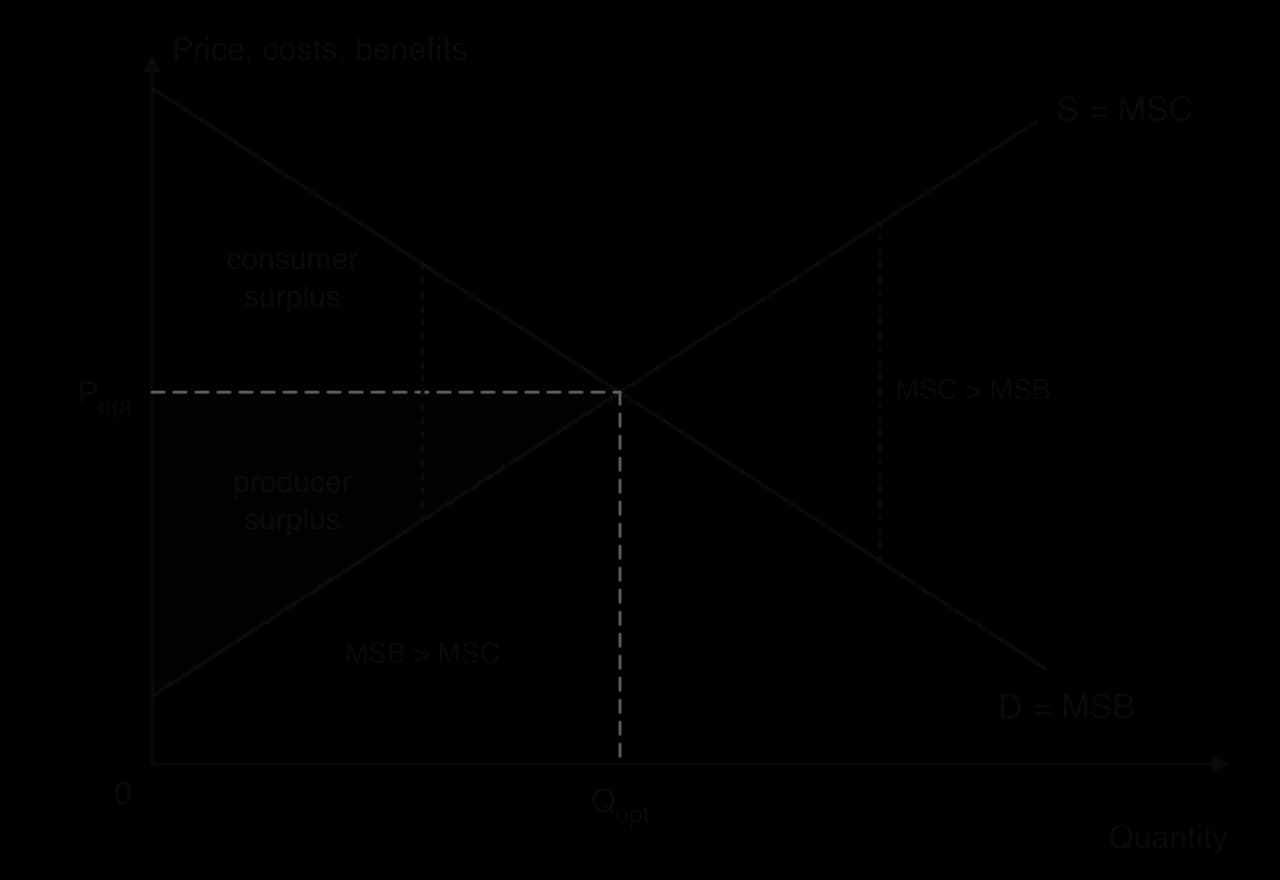
Society’s scarce resources are used best when each good is produced up to the point where the benefit of the last unit to society equals the cost of that unit to society. This point is the socially optimal output, and producing it achieves allocative efficiency.
The diagram shows why MSB = MSC is the right rule. At any output below Qopt, the next unit adds more to society’s benefit than to its cost (MSB > MSC), so producing it makes society better off. At any output above Qopt, the last unit costs society more than it is worth (MSC > MSB), so cutting output makes society better off. Only at Qopt is there no gain from changing output.
At Qopt, social surplus (also called community surplus), the sum of consumer surplus and producer surplus, is maximised. When there are no externalities, MPB = MSB and MPC = MSC, so the free-market equilibrium is at Qopt and the market is allocatively efficient. When externalities exist, the market equilibrium is where MPB = MPC, which is no longer where MSB = MSC.
The surplus that society loses when output is not at the social optimum is a welfare loss (sometimes called deadweight loss). On every externality diagram, the welfare loss is the triangle between the MSB and MSC curves, from the market output to the optimal output.
Many production processes harm people who are not involved in buying or selling the product. A power station burning coal releases sulphur dioxide and carbon dioxide; a cement works covers nearby homes in dust; a factory discharges waste into a river used by fishers downstream. The firm pays for its fuel and labour, but not for the damage it causes to others.
When the external cost comes from making the good, it is a negative externality of production. The cost to society of each unit is then the firm’s private cost plus the cost imposed on others.
The firm’s supply decisions follow its private costs, so the supply curve is MPC. The true cost to society, MSC, lies above MPC by the external cost of each unit. Assuming there is no externality on the consumption side, demand equals both MPB and MSB.
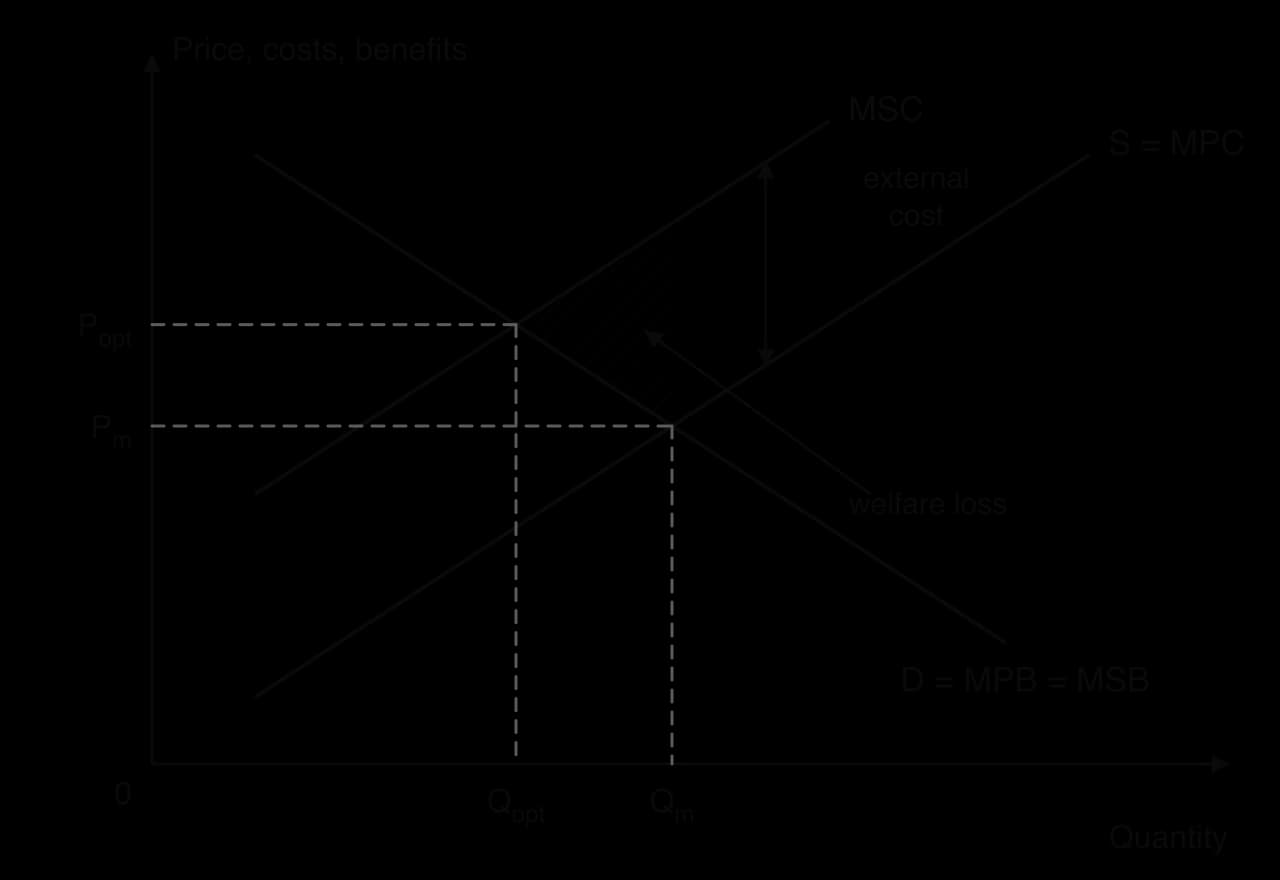
The market settles at Qm and Pm, where demand (MPB) meets supply (MPC). The social optimum is at Qopt, where MSB meets MSC. Because the firm ignores the external cost, the market produces too much (Qm > Qopt) at too low a price (Pm < Popt): the price does not include the damage the good causes.
Each unit between Qopt and Qm has a social cost (read off MSC) above its social benefit (read off MSB). Society loses the difference on each of those units, and adding these losses together gives the hatched triangle between MSC and MSB from Qopt to Qm. This is the welfare loss. Too many resources are used in this industry, which is an overallocation of resources.
In the stubble-burning seasons of October and November, farmers in the Indian states of Punjab, Haryana and Uttar Pradesh burn the straw left after the rice harvest, because it is the cheapest and quickest way to clear fields for wheat. An estimated 35 million tonnes of crop waste are burned each season, and the smoke drifts over Delhi, where it has led to declarations of air-pollution emergencies. The farmers’ private cost of clearing a field is low, while the health cost falls on millions of people in another state.
Sources: Wikipedia, “Stubble burning” (2026), citing Indian government and research sources.
External costs can also come from using a good. Second-hand smoke harms people near a smoker; a car journey in a busy city adds to congestion and slows every other road user; loud music at night disturbs neighbours. In each case the consumer gains from the good, but part of the cost of that consumption falls on others.
Here the external cost is shown on the benefit side. The consumer’s benefit from each unit is MPB, but society’s benefit is MPB minus the harm done to third parties, so MSB lies below MPB. On the production side there is no externality, so supply is MPC = MSC.
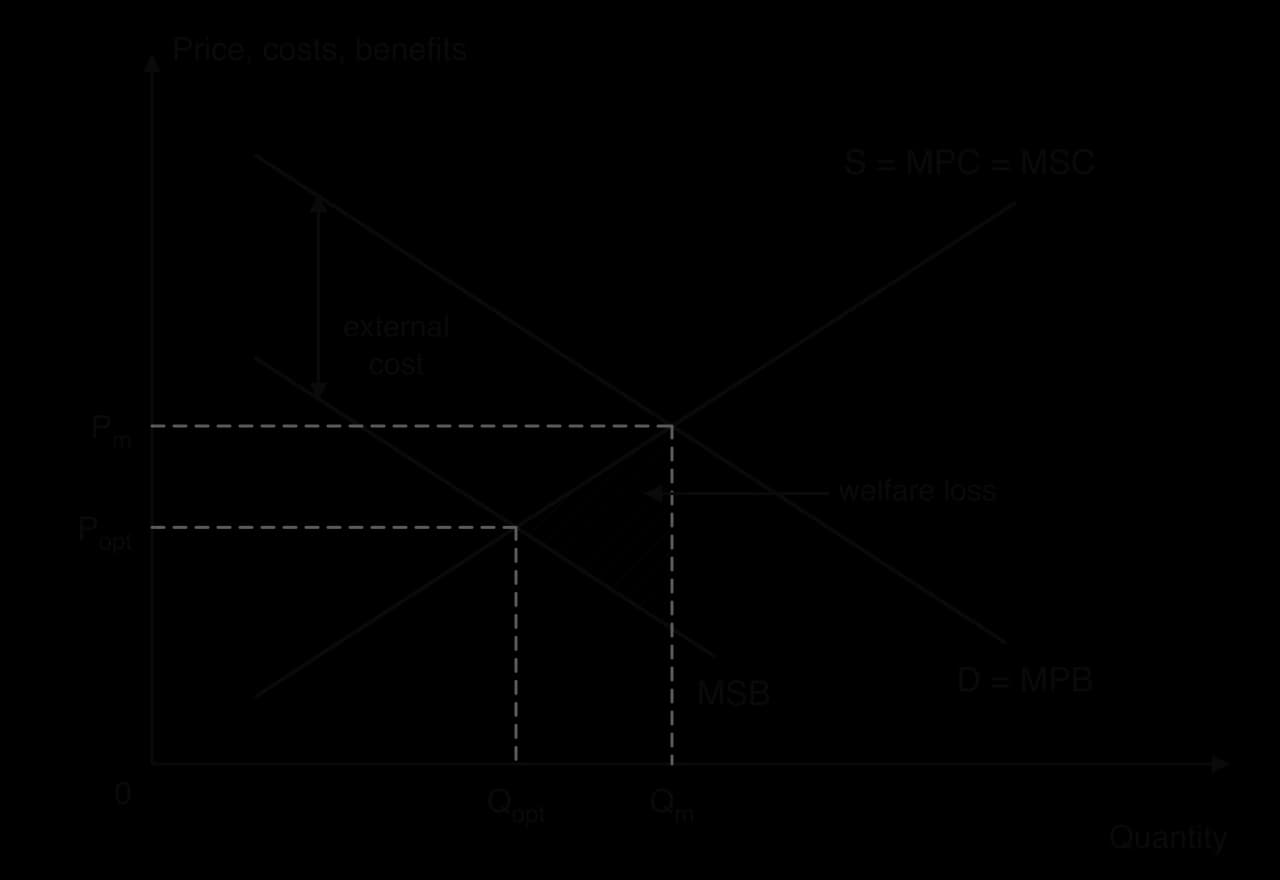
Consumers buy up to Qm, where their private benefit equals the price. At Qm, the benefit to society of the last unit (on MSB) is below its cost (on MSC). Society would be better off at Qopt, so the units between Qopt and Qm are overconsumed, and the welfare loss is the triangle between MSC and MSB over that range.
London’s Congestion Charge, introduced on 17 February 2003, is a response to this kind of externality. Drivers entering the central zone pay a daily charge (£5 at first, £15 from June 2020 and £18 from January 2026), which makes them face part of the cost their journey imposes on others. Traffic fell by at least 15% in the first weeks, and most of the revenue has been spent on public transport, especially buses.
Sources: Wikipedia, “London congestion charge” (2026), citing Transport for London reports.
 YouTube
Some goods are consumed in larger amounts than is good for the consumers themselves. Cigarettes, alcohol, sugary drinks and gambling are common examples. Economists call these demerit goods.
There are two separate reasons. The first is that consumers may misjudge the harm to themselves. They may lack information about the long-term health effects, underestimate the risk of becoming addicted, or give too little weight to future costs compared with today’s pleasure. This is a form of information failure.
The second reason is the external cost. Smoking harms people who breathe second-hand smoke and, in countries with public health systems, raises the cost of healthcare paid for by taxpayers. Heavy drinking can lead to accidents and violence that harm others. These are negative consumption externalities, so the diagram of a demerit good is the negative consumption externality diagram, with MSB below MPB.
Whether a good is a demerit good is partly a value judgment. Most societies agree that heroin and tobacco are harmful, but people disagree about alcohol, sugary food or gambling, and about how far governments should override individual choice. Policy towards demerit goods therefore raises questions of personal freedom as well as of efficiency.
Production can also benefit people outside the market. A firm that trains its workers in new skills raises the productivity of other firms when those workers later change jobs. A firm’s research may create knowledge that other firms copy. A beekeeper’s bees pollinate the crops of nearby farms. In each case, the producer is not paid for the benefit others receive.
When the external benefit arises in production, it lowers society’s cost of the good below the firm’s cost. The extra skills or knowledge would otherwise have cost other firms something to obtain, so each unit produced saves society some cost.
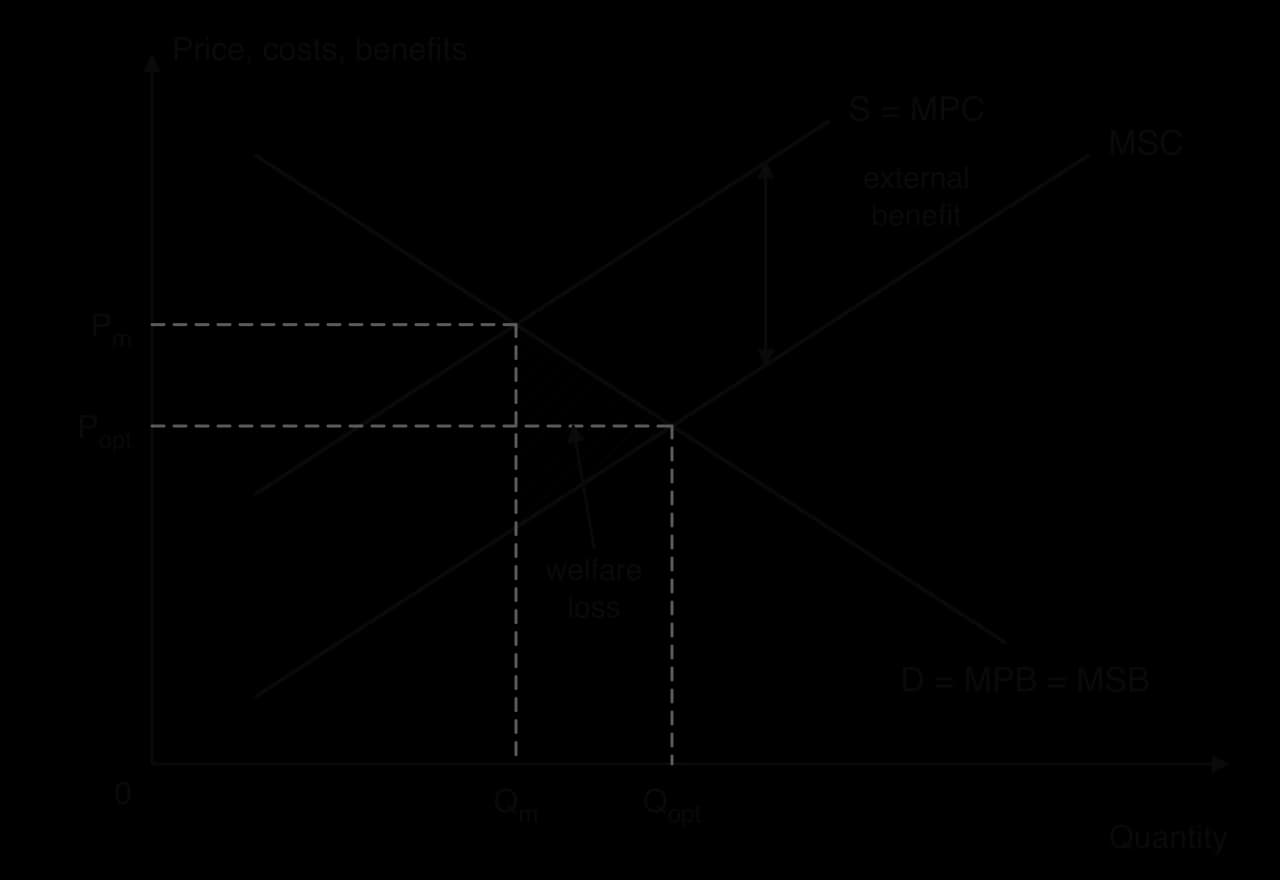
The firm’s output decisions follow MPC, so the market is at Qm and Pm. The social optimum is where MSB = MSC, at Qopt, which is greater than Qm. Between Qm and Qopt, each unit is worth more to society (on MSB) than it costs society (on MSC), but the market does not produce these units, so their potential surplus is lost. Too few resources go to the industry: an underallocation of resources.
Positive production externalities explain why governments fund training schemes and offer tax credits for research and development. Without support, firms would train and research less than is best for the economy as a whole, because they cannot keep all the gains for themselves.
Many goods benefit people other than the consumer. A person vaccinated against measles cannot pass the disease on, which protects others, including babies too young to be vaccinated. Education makes people more productive and better-informed citizens, which benefits employers and society as a whole. Well-maintained private gardens make a whole street more pleasant.
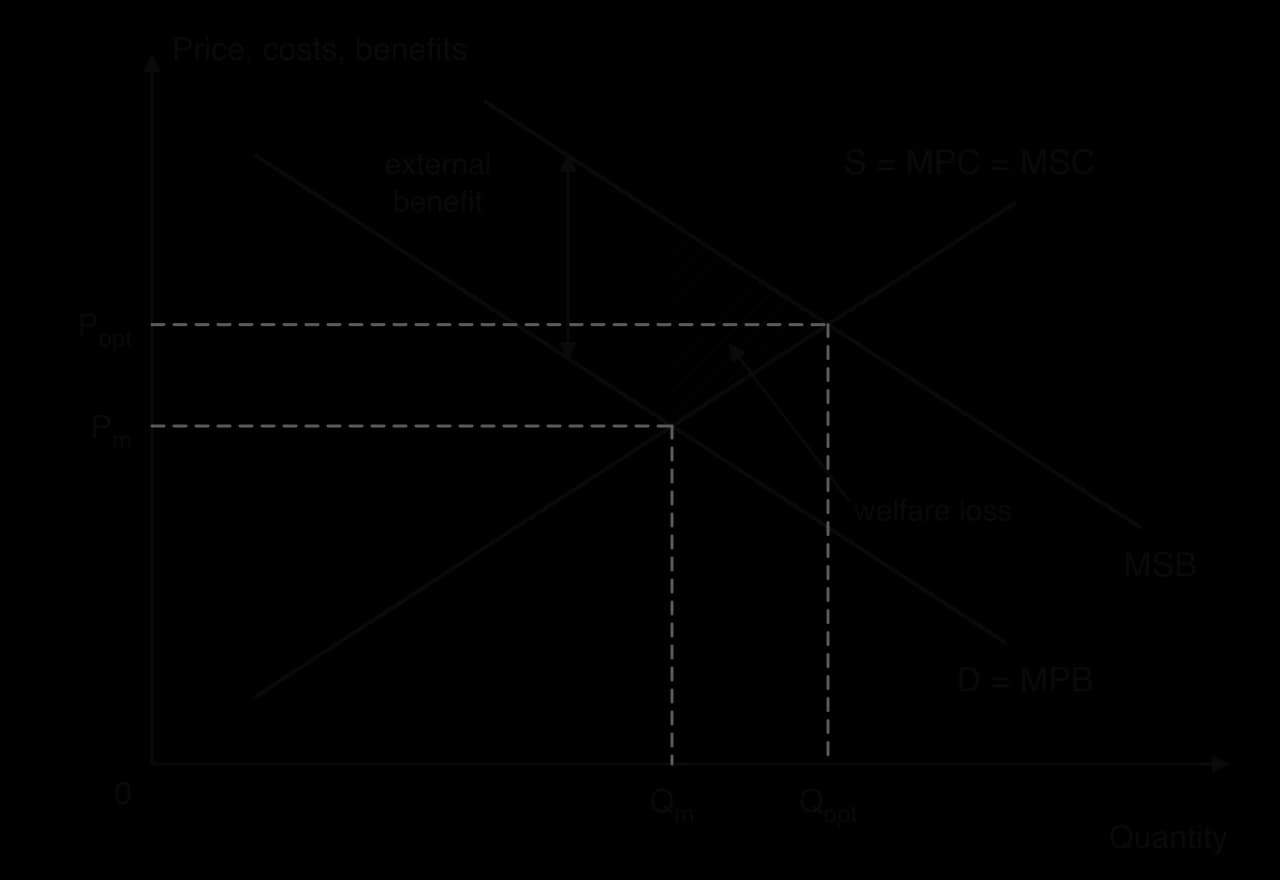
Consumers decide how much to buy from their own benefit, MPB, so the market is at Qm. Society’s benefit, MSB, is higher by the external benefit, and the social optimum Qopt, where MSB = MSC, lies to the right of Qm. The good is underconsumed, and the welfare loss is the triangle between MSB and MSC from Qm to Qopt.
Vaccination shows the size of these benefits. Measles vaccination is estimated to have averted nearly 59 million deaths between 2000 and 2024. Even so, only about 84% of the world’s children received a first dose by their first birthday in 2025, and 77% received both doses; measles killed an estimated 95,000 people in 2024. Where coverage falls, outbreaks return, which is why many governments give vaccines free of charge.
Sources: World Health Organization, Measles fact sheet (2026).
Some goods are better for people than they themselves realise. Education, healthcare, vaccinations, pensions and healthy food are common examples. Economists call these merit goods, and a free market tends to provide too little of them.
The reasons mirror those for demerit goods. Consumers may underestimate the private benefits, because they lack information or give too little weight to the future: a teenager may not appreciate how much an extra year of education raises lifetime income, and a healthy adult may not see the point of a check-up. Merit goods also often have positive consumption externalities, so the diagram of a merit good is the positive consumption externality diagram, with MSB above MPB.
A third reason is equity. If merit goods such as healthcare and education are sold at market prices, households on low incomes consume less of them, even when their need is greatest. Many people regard access to basic healthcare and schooling as a right, so governments provide them for reasons of fairness as well as efficiency.
The four cases follow one pattern. Production externalities move the cost curve (MSC moves away from MPC); consumption externalities move the benefit curve (MSB moves away from MPB). Negative externalities lead to overallocation and positive ones to underallocation.
Type | Example | Curves | Market outcome | Welfare loss |
|---|---|---|---|---|
Negative externality of production | Air pollution from a coal power station | MSC above MPC | Overproduction: Qm > Qopt | Between MSC and MSB, from Qopt to Qm |
Negative externality of consumption | Second-hand smoke; traffic congestion | MSB below MPB | Overconsumption: Qm > Qopt | Between MSC and MSB, from Qopt to Qm |
Positive externality of production | Firm-funded training; research | MSC below MPC | Underproduction: Qm < Qopt | Between MSB and MSC, from Qm to Qopt |
Positive externality of consumption | Vaccination; education | MSB above MPB | Underconsumption: Qm < Qopt | Between MSB and MSC, from Qm to Qopt |
On every externality diagram, the welfare loss is a triangle. Its area is half the base times the height. The base is the horizontal distance between the market output and the optimal output (|Qm − Qopt|). The height is the vertical gap between the MSC and MSB curves at the market output, because that is where the misallocation is largest.
The units of the answer are the units of price multiplied by the units of quantity. If price is in dollars per tonne and quantity in thousands of tonnes, the area is in thousands of dollars.
The diagram shows a market for a chemical whose production pollutes a river, with the values needed for the calculation marked on the axes.
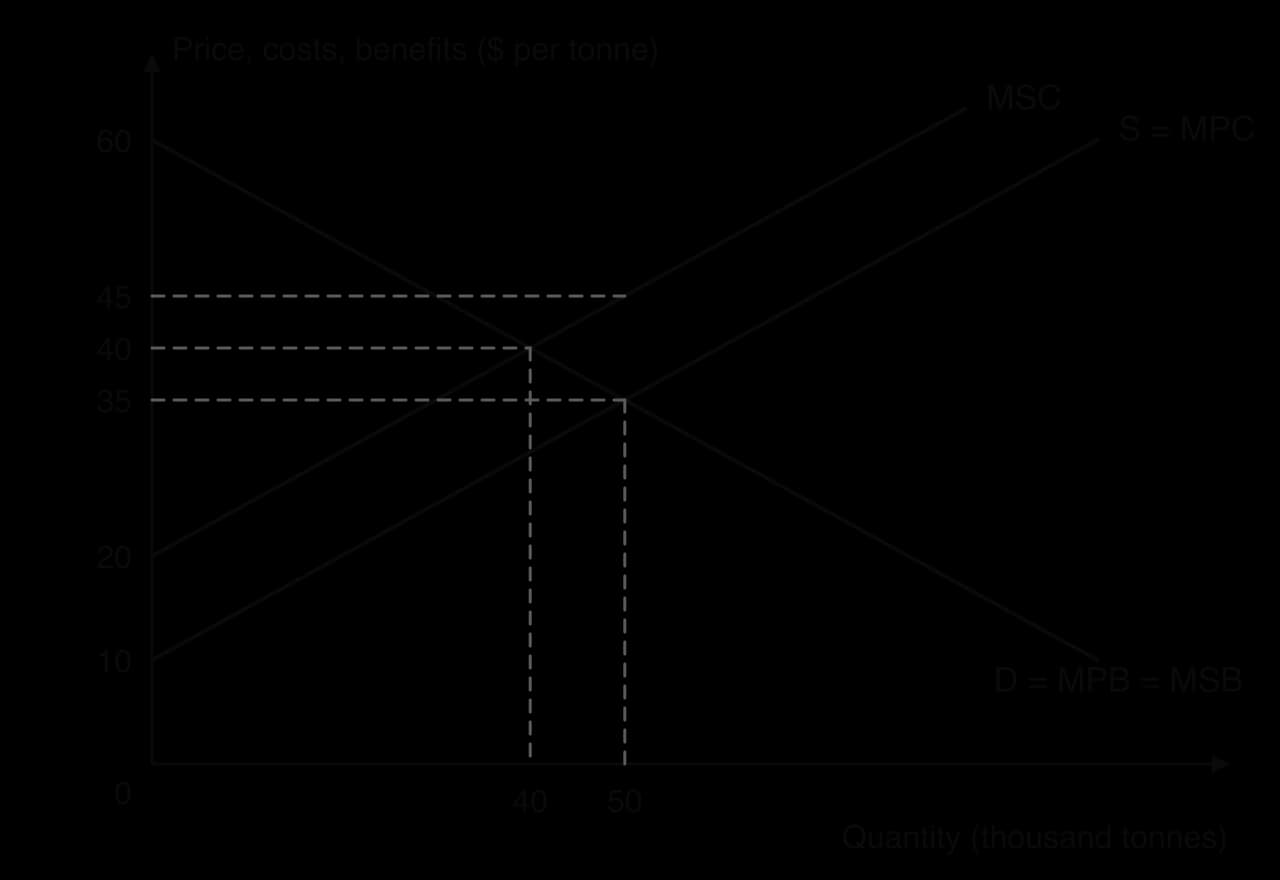
The same method works for positive externalities. The only difference is that the market output is now to the left of the optimum, and at Qm the MSB curve lies above the MSC curve.
Some of the most serious environmental problems involve resources that nobody owns: fish in the open ocean, groundwater, tropical forests, grazing land and the atmosphere’s capacity to absorb pollution. To see why these are overused, economists classify goods by two characteristics.
Most goods are rivalrous: a sandwich eaten by one person cannot be eaten by someone else. Some, such as a street light or a weather forecast, are non-rivalrous: one person’s use does not reduce what is left for others.
Putting the two characteristics together gives four kinds of good. Private goods are rivalrous and excludable; public goods are neither. Common pool resources are the awkward combination in between: they are rivalrous, so they can be used up, but they are non-excludable, so nobody can be stopped from using them.
Excludable | Non-excludable | |
|---|---|---|
Rivalrous | Private goods (a meal, a car) | Common pool resources (ocean fish, groundwater, forests) |
Non-rivalrous | Club goods (a streaming service, a toll road when uncrowded) | Public goods (national defence, street lighting) |
Because no one can be excluded, each user decides how much to take by comparing their own gain with their own cost. A fisher who catches an extra tonne of fish keeps all the revenue from it. The cost of that catch, a smaller stock that grows more slowly and yields smaller catches in future, is shared among everyone who fishes in the same waters. Each fisher therefore has an incentive to catch more, even when all of them would be better off if everyone caught less.
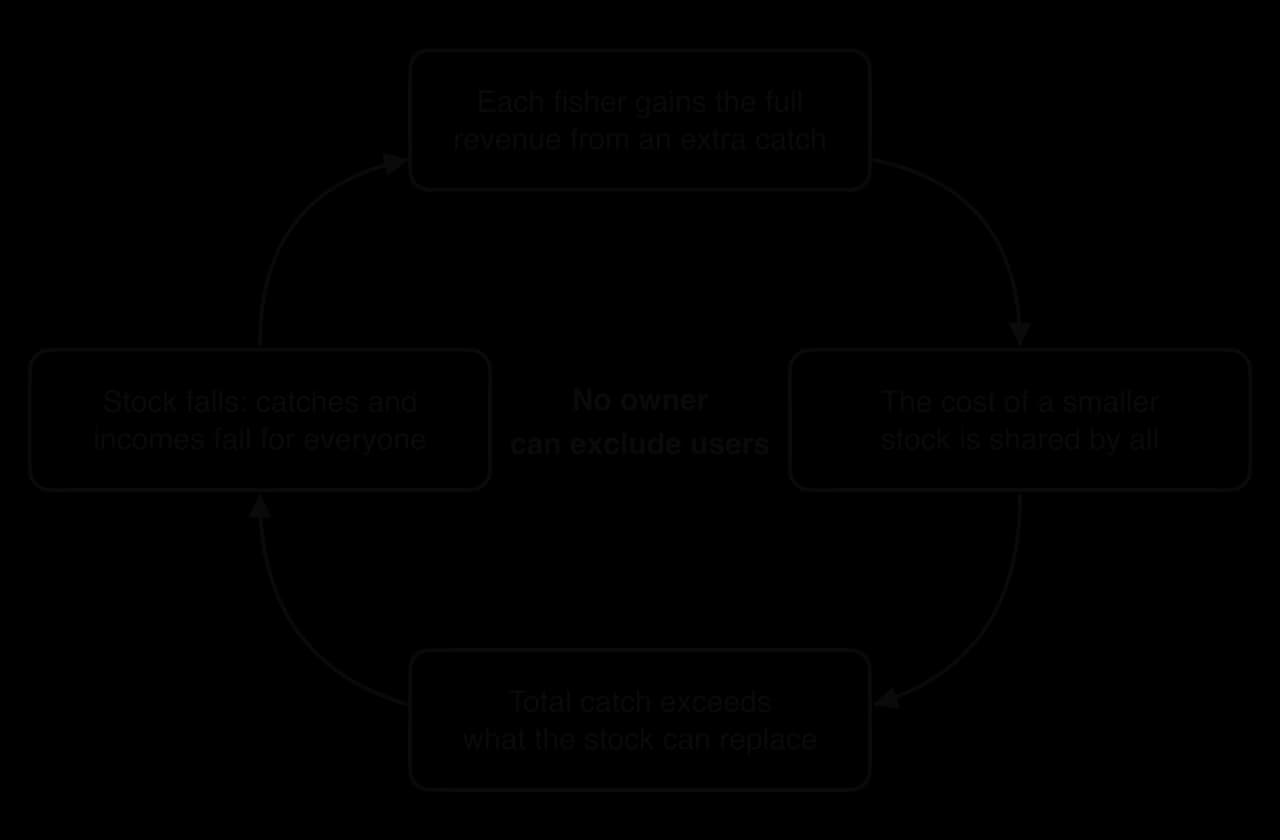
The flow diagram shows the cycle. The problem gets worse as the resource shrinks: when users expect the stock to collapse, each has an incentive to take as much as possible before others do. Self-restraint by one user does not save the resource if others carry on, so choices that make sense for each user lead to overuse by the group as a whole.
The collapse of the northern cod fishery off Newfoundland, Canada, is a well-known case. Larger trawlers and new technology raised catches to a peak of about 810,000 tonnes in 1968. By 1992 the northern cod population had fallen to about 1% of its historic level, and the Canadian government closed the fishery. More than 35,000 fishers and fish-plant workers in over 400 coastal communities lost their jobs. The stock recovered only slowly: commercial fishing was not allowed again until 2024, with a total catch limit of 18,000 tonnes.
Sources: Wikipedia, “Collapse of the Atlantic northwest cod fishery” (2026), citing Fisheries and Oceans Canada and NAFO.
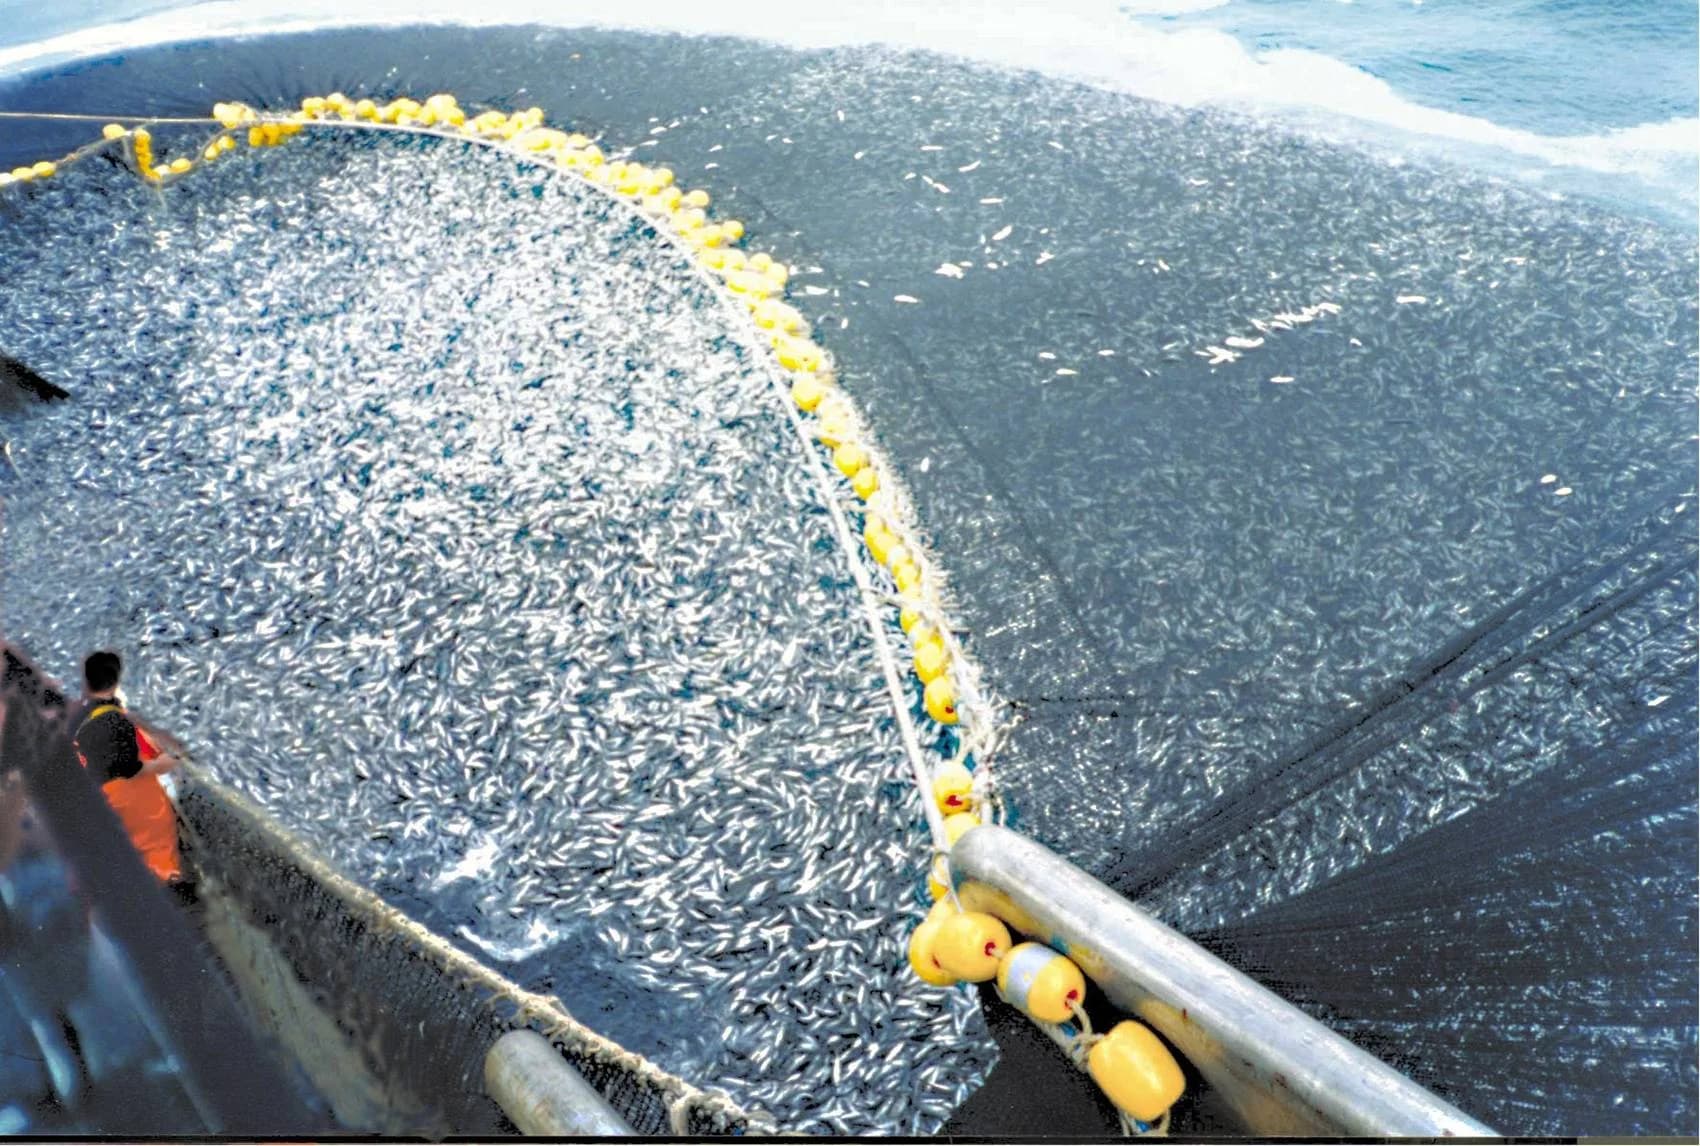
Common pool resources link directly to sustainability: a resource used faster than it can regenerate will not be available to future generations, so overuse also raises a question of equity between generations.
 YouTube
The overuse of a common pool resource is a negative externality. When one firm cuts down a forest or pumps groundwater, it imposes costs on other users and on future generations, who find less of the resource left. These costs do not enter the firm’s decisions, so its marginal private cost is below the marginal social cost of using the resource.
Many unsustainable production methods work in this way. Overfishing raises the cost of fishing for everyone else; clearing rainforest for cattle or palm oil releases carbon and destroys habitats; intensive irrigation drains aquifers and dries up rivers. Each can be drawn as a negative production externality diagram, with output at Qm above the sustainable level Qopt.
The atmosphere is the largest common pool resource of all. No country can be stopped from emitting greenhouse gases, and the damage from each tonne of carbon dioxide (higher temperatures, rising sea levels, more extreme weather) is shared by the whole world. Climate change is therefore both a negative production externality and a global tragedy of the commons.
Every policy towards a negative externality has the same aim: to reduce output from Qm towards Qopt, where MSB = MSC. Some policies change prices so that buyers and sellers face the full social cost (market-based policies); others set limits directly (command and control). Many are based on the polluter pays principle.
An indirect tax is a tax on spending on a good. When a tax is set to correct an externality, it is named after the economist Arthur Pigou, who proposed the idea in 1920.
A per-unit tax on a polluting good raises the firm’s cost of each unit by the amount of the tax. The supply curve shifts upwards by the tax, from MPC to MPC + tax. If the tax equals the external cost, the new supply curve is the MSC curve. The firm now “internalises” the externality: the price it faces reflects the full cost of its production to society.
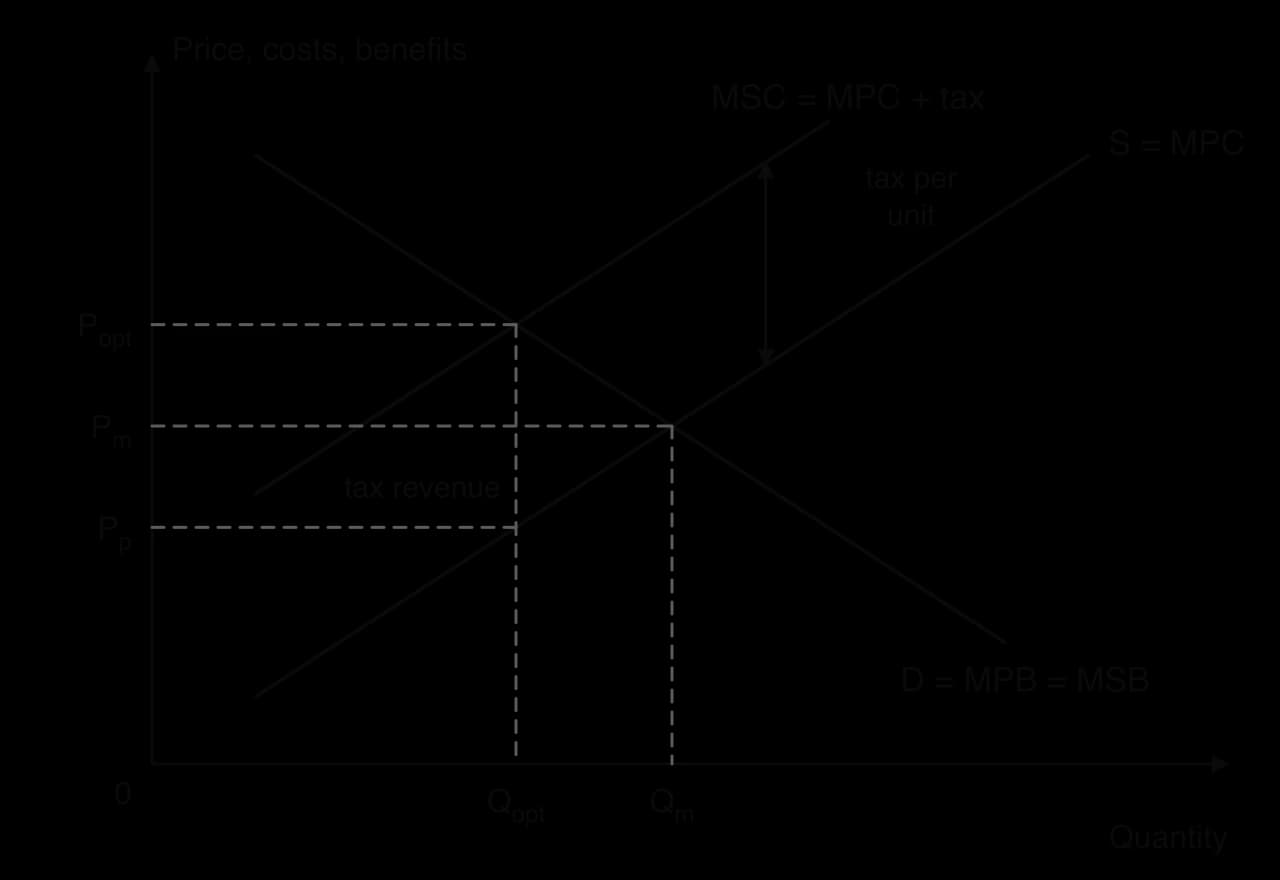
Output falls to Qopt and price rises from Pm to Popt. Consumers pay more, producers receive less (Pp), and the government collects revenue equal to the tax per unit times Qopt, shown by the shaded rectangle. The government can use the revenue to repair the damage, to compensate those harmed, or to cut other taxes.
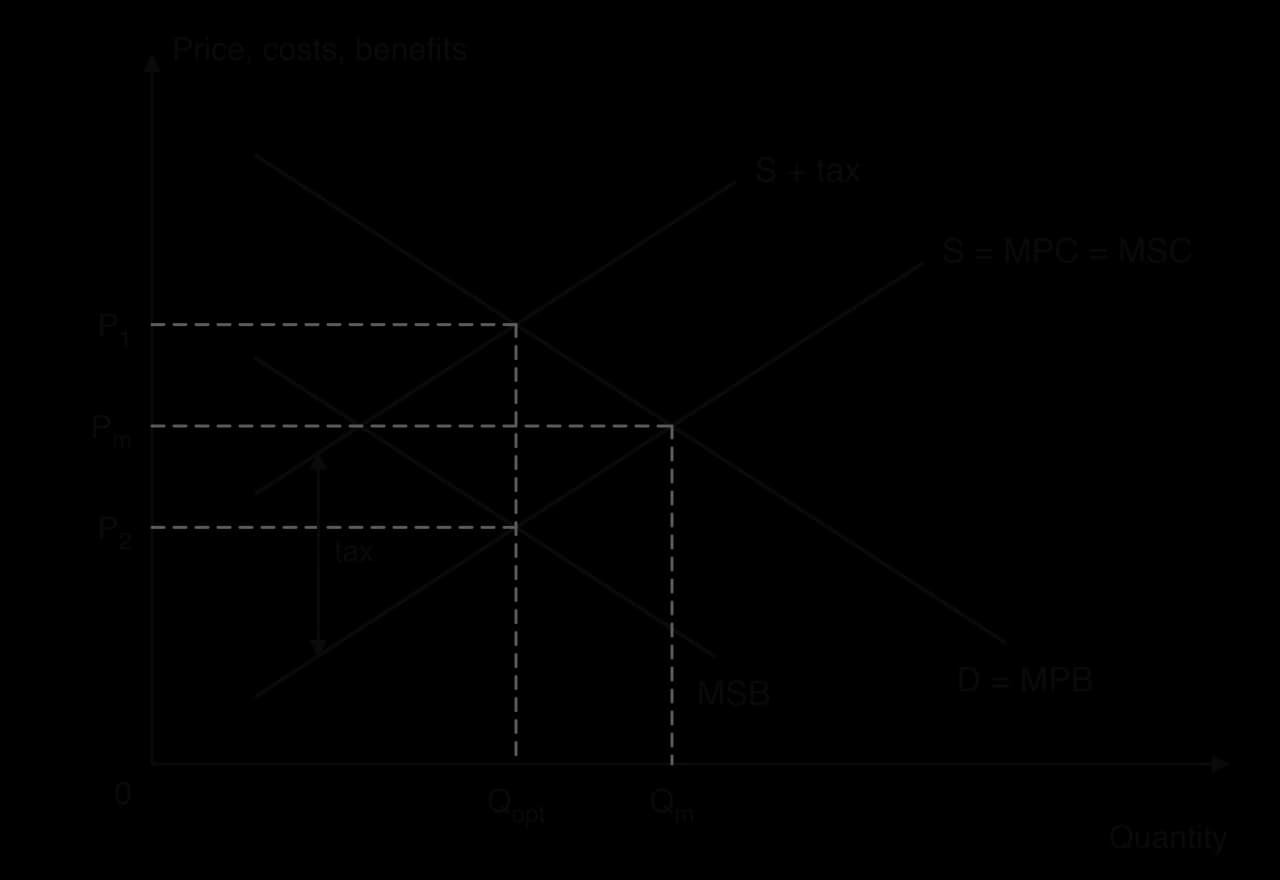
A tax can also correct a negative consumption externality. Taxes on cigarettes, alcohol and sugary drinks are levied on sellers but aim to cut consumption. The tax shifts supply up by the external cost, so that the new supply curve meets MPB at the quantity where MSB = MSC.
Market-based: firms and consumers keep the freedom to choose. Those who can cut pollution cheaply do so; those for whom it is costly pay the tax instead, so the reduction happens at low total cost.
Incentive to innovate: every unit of pollution is taxed, so firms always gain from finding cleaner methods of production.
Revenue: the tax raises money for the government, which can fund clean-up, subsidies for alternatives, or cuts in other taxes.
Polluter pays: the burden falls on those who cause the harm and those who buy their products, which many people regard as fair.
Measuring the external cost is hard. Setting the tax at the right level requires a money value for damage to health, ecosystems or the climate, which is uncertain. A tax set too low leaves part of the welfare loss; a tax set too high cuts output below Qopt.
Price inelastic demand. For goods such as petrol, cigarettes or alcohol, demand is price inelastic, so a tax raises the price but reduces quantity only a little. The tax raises revenue but does little to change behaviour unless it is very high.
Regressive effects. Low-income households spend a larger share of their income on goods such as tobacco, fuel and energy, so taxes on them take a larger share of poorer households’ income: a regressive effect that raises equity concerns.
Avoidance and parallel markets. High taxes encourage smuggling and illegal sales, for example of cigarettes, which reduce revenue and can undermine the policy.
Political resistance. Consumers and producers who pay more oppose the tax, and firms argue that it makes them less competitive internationally.
A carbon tax is a Pigouvian tax on greenhouse gas emissions. It is levied on the carbon content of fossil fuels (coal, oil and gas) or directly on each tonne of carbon dioxide emitted. By raising the price of high-carbon energy relative to low-carbon alternatives such as wind or solar power, it encourages firms and households to switch.
The diagram shows a carbon tax in the market for electricity generated from fossil fuels, one polluting industry. In practice the tax is usually set below the full estimated external cost, often for political reasons, so it reduces output without reaching the social optimum.
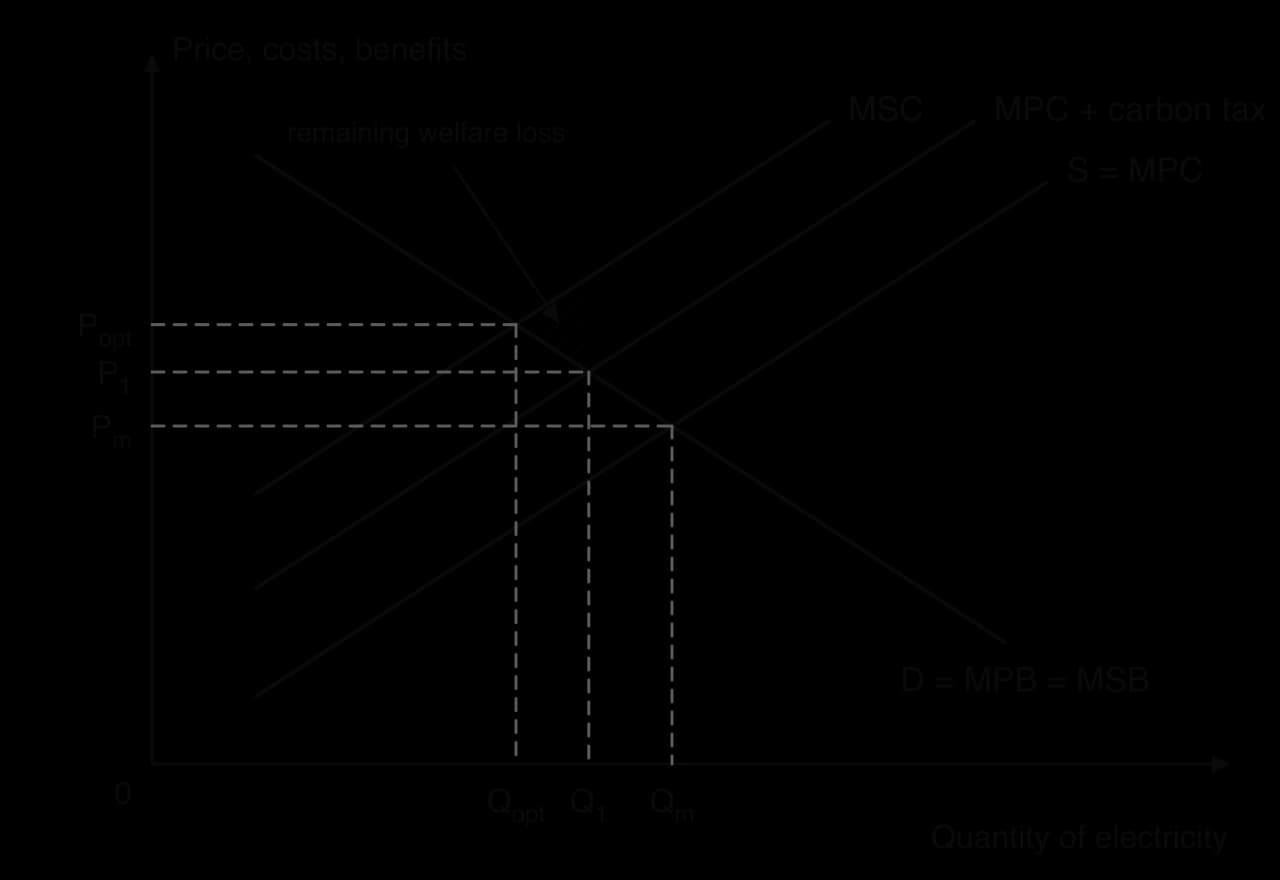
Output of fossil-fuel electricity falls from Qm to Q₁ and its price rises to P₁. Part of the welfare loss is removed; the hatched triangle that remains shows the cost of setting the tax too low. Raising the tax step by step over time moves output closer to Qopt while giving firms and households time to adjust.
British Columbia, in Canada, introduced a carbon tax on 1 July 2008 at C$10 per tonne of carbon dioxide, rising to C$30 by 2012 and later to C$80 in 2024. It was designed to be revenue neutral: income and corporate taxes were cut by the same amount, so that the tax changed prices without raising the total tax burden. A 2013 study found fossil fuel use per person fell by about 17% in the first years, although later studies found smaller effects. The tax was abolished on 1 April 2025, after the federal government removed its own consumer carbon tax, which shows how fragile carbon taxes can be politically.
Sources: Wikipedia, “British Columbia carbon tax” (2026), citing the Government of British Columbia and Sustainable Prosperity (2013).
A carbon tax in one country raises the costs of its energy-intensive industries, such as steel, cement and chemicals, compared with competitors abroad. Production may move to countries with weaker rules. This is called carbon leakage.
Governments can also set rules directly: command and control regulation and legislation. Examples include limits on the emissions of factories and vehicles, bans on harmful substances (such as lead in petrol), minimum ages for buying alcohol and tobacco, bans on smoking in public places, and quotas that limit how many fish each boat may catch.
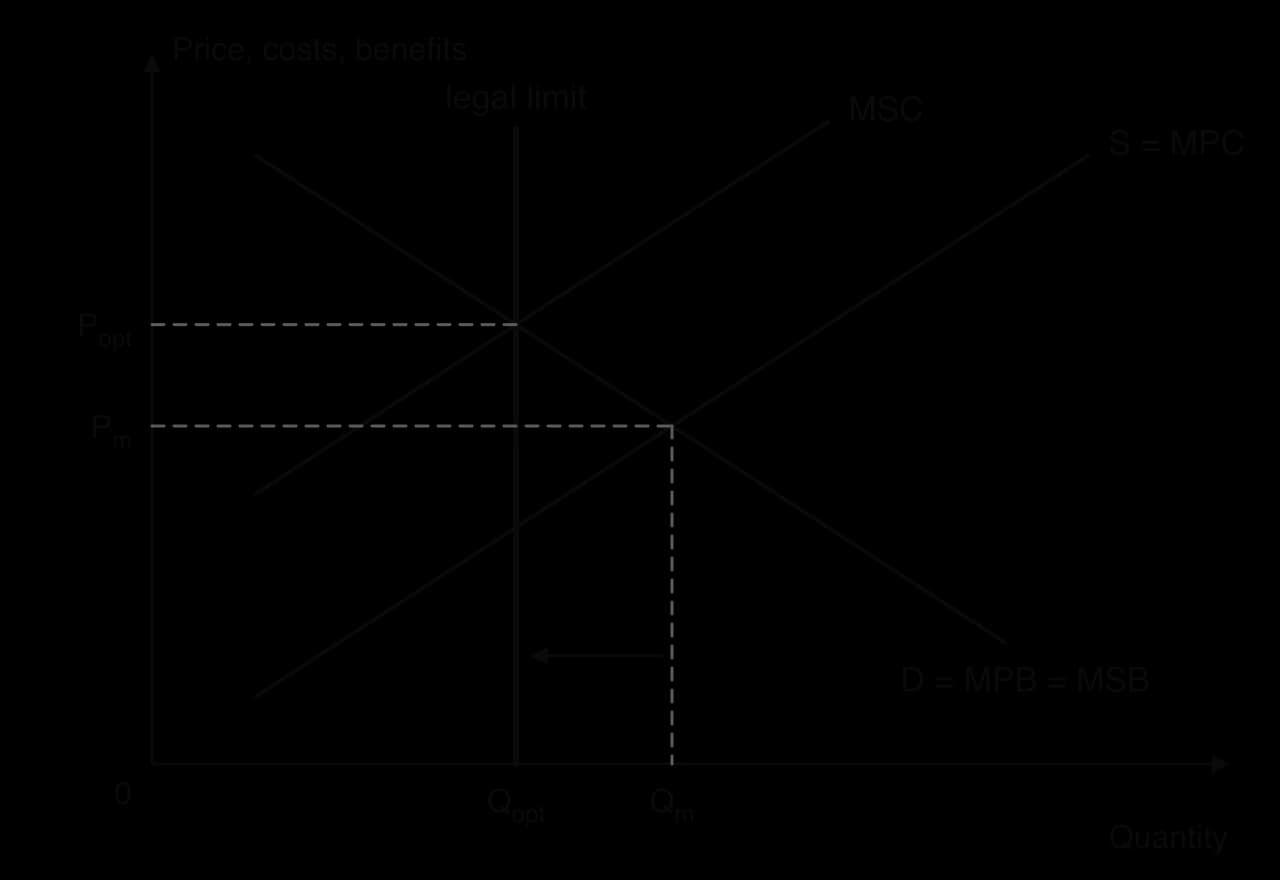
In the diagram, the law limits output to Qopt, so quantity falls from Qm and the price rises to Popt. In practice, regulations rarely cap output directly. More often they require firms to use cleaner technology, which raises their costs and shifts MPC upwards, with an effect similar to a tax.
Regulation is also used for demerit goods. Australia was the first country to require plain packaging for tobacco: from 1 December 2012, every pack sold had to be a standard drab colour with large health warnings and no logos. One evaluation estimated that smoking prevalence between December 2012 and September 2015 was 0.55 percentage points lower than it would otherwise have been. France and the United Kingdom followed in 2017, and dozens of countries have done so since.
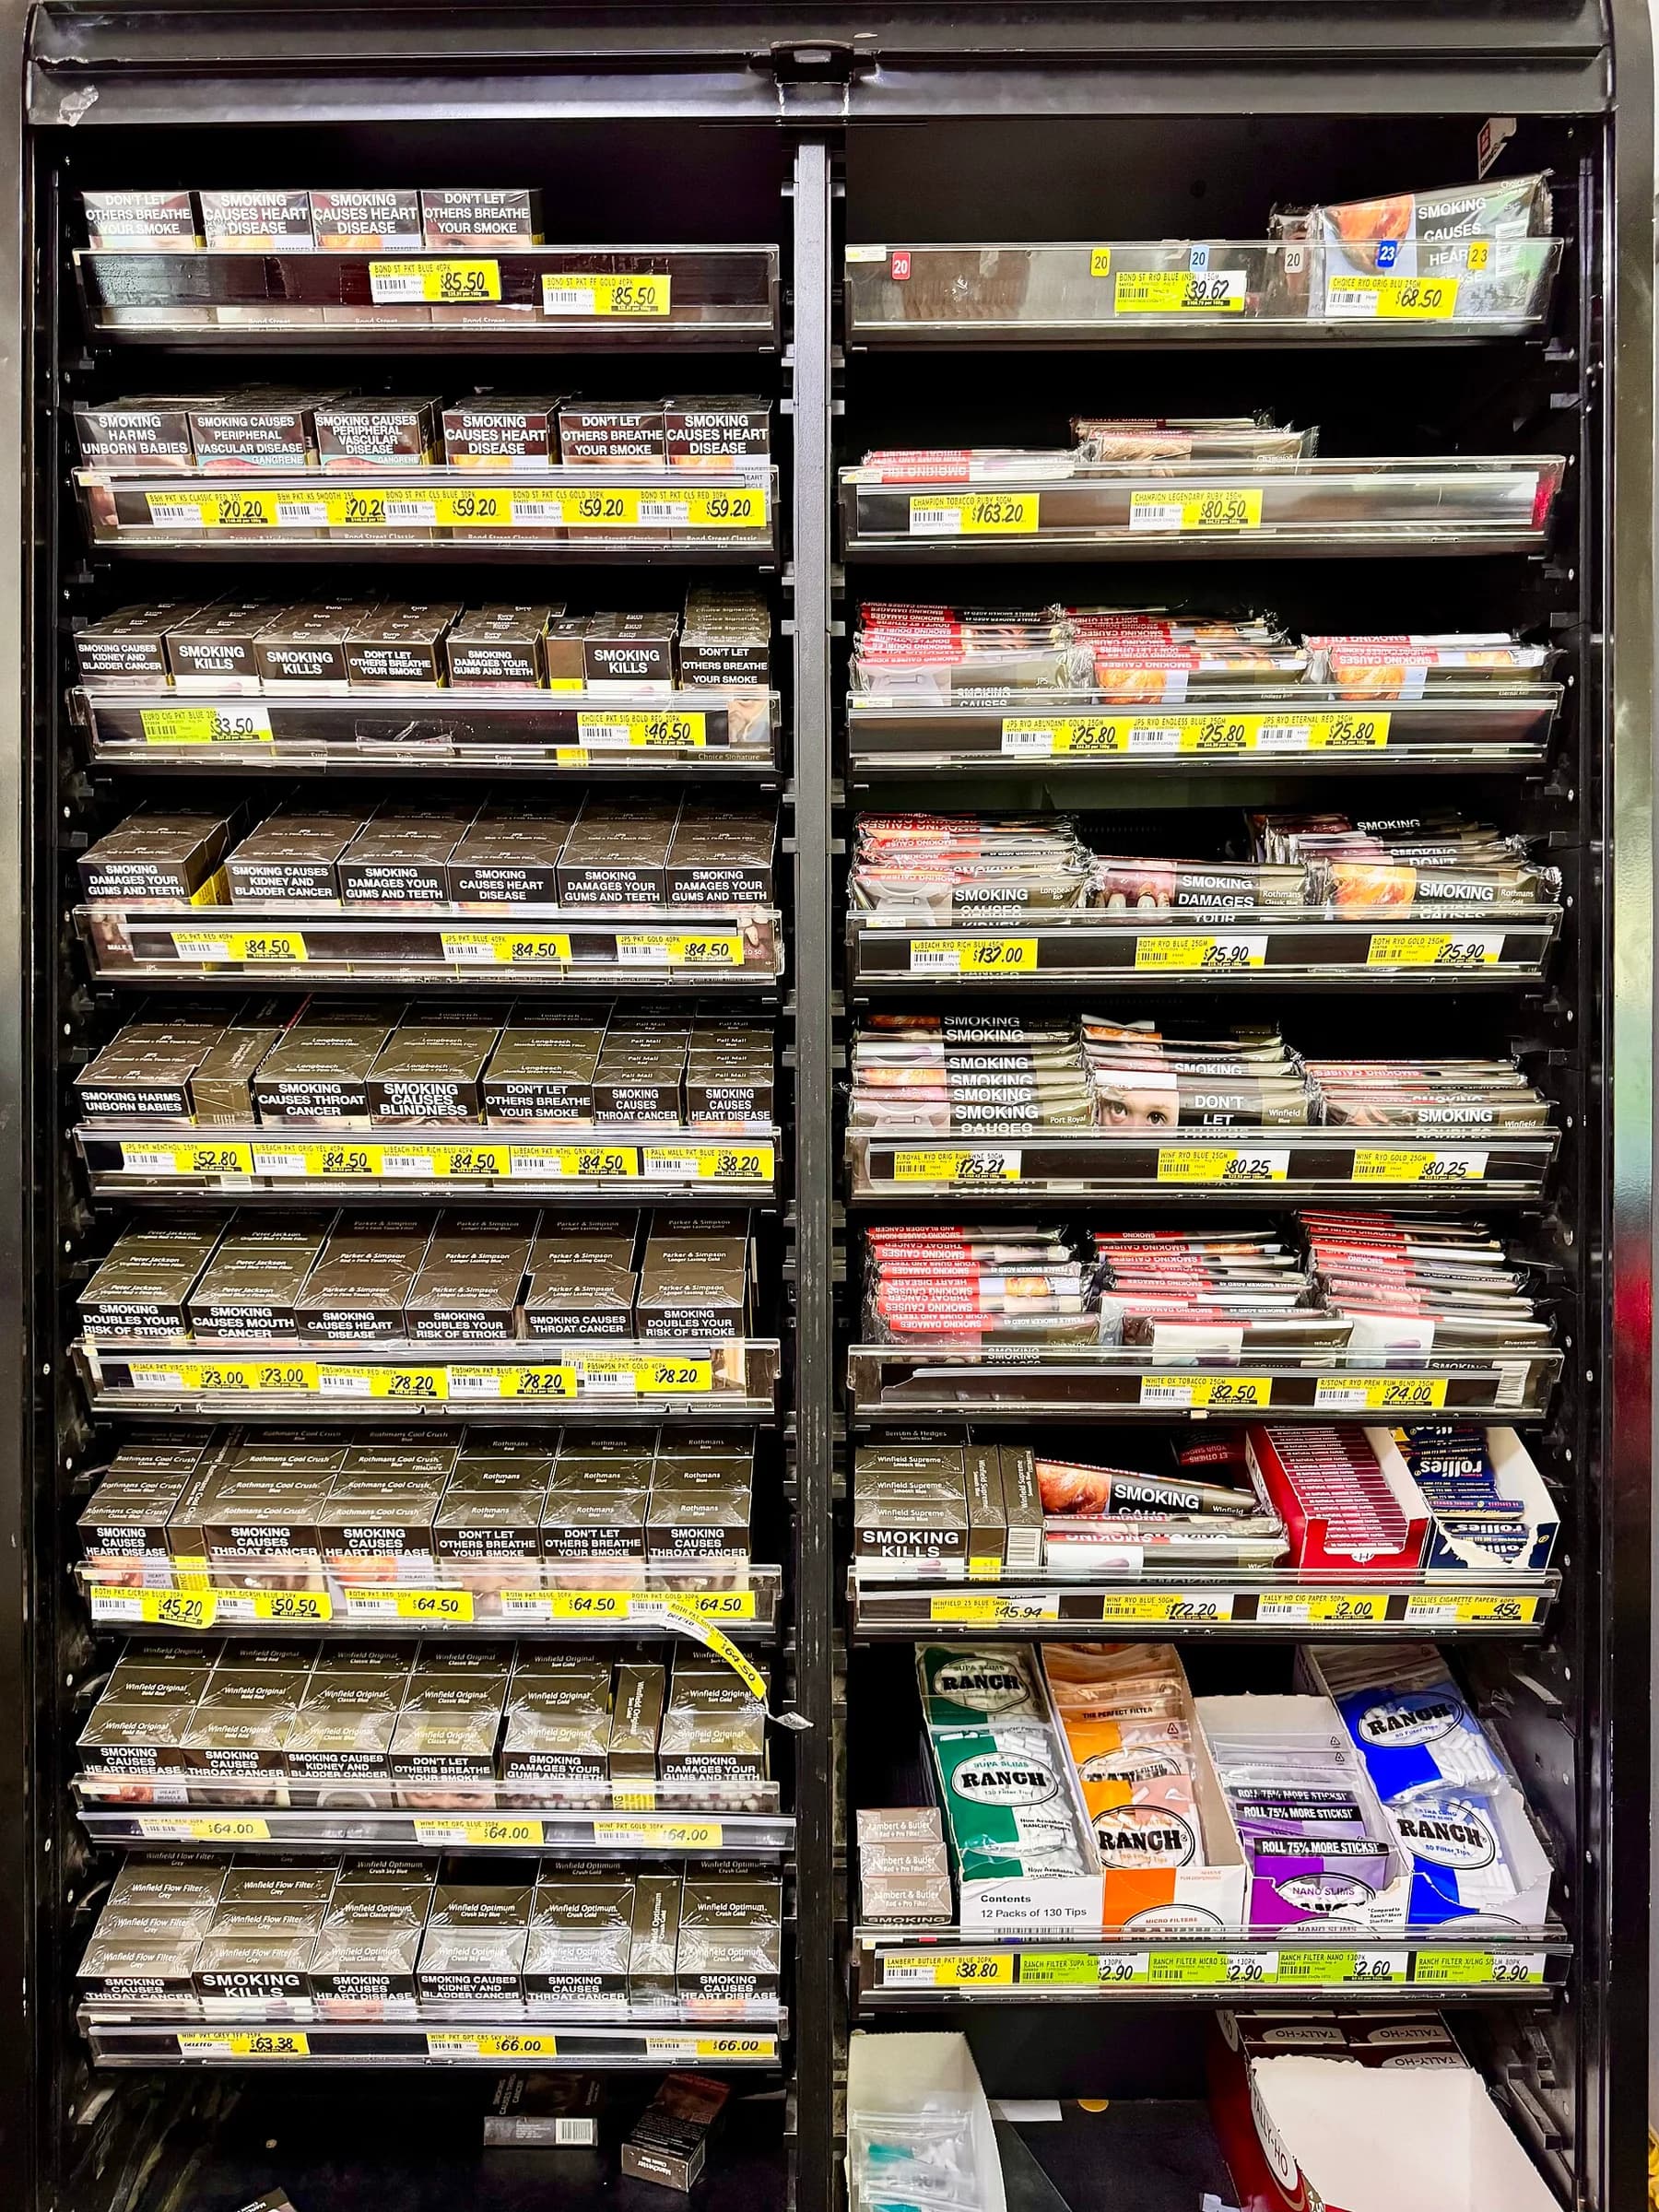
Sources: Wikipedia, “Plain tobacco packaging” (2026), citing the Australian Department of Health (2016).
Strengths | Limitations |
|---|---|
Simple to understand and to announce; the public can see what is allowed. | Firms have no incentive to cut pollution below the legal limit, so there is no reward for doing better. |
Gives certainty about the result: a ban or a limit fixes the outcome, which suits very harmful substances. | The same rule for every firm is costly: firms that could cut pollution cheaply are not asked to cut more than firms for which it is expensive. |
Works even when demand is price inelastic, where a tax would change behaviour little. | Needs monitoring and enforcement, which costs money; weak enforcement or corruption makes rules ineffective. |
Does not raise prices for consumers directly, so it may face less public opposition than a tax. | Raises no revenue, and setting the right limit needs the same hard-to-measure information as a tax. |
Where overconsumption or underconsumption comes from information failure, governments can try to correct the information itself. Campaigns warn of the dangers of smoking, drink-driving or unhealthy diets, or promote the benefits of vaccination, exercise and staying in education.
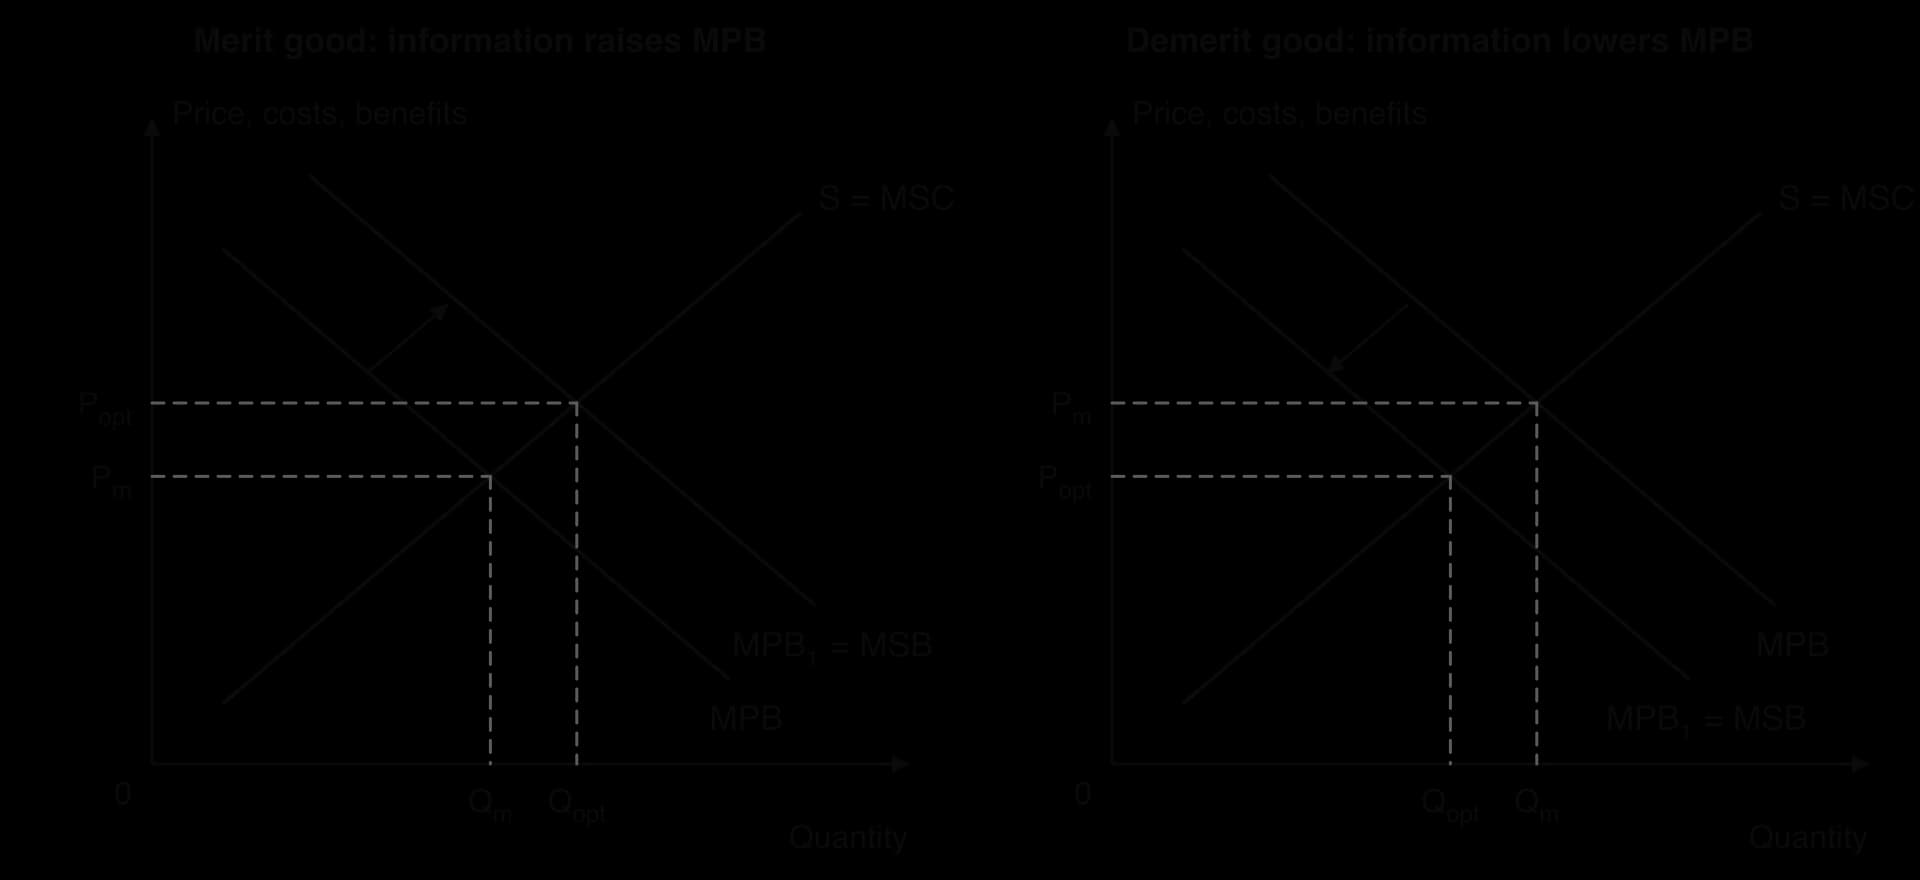
Better information changes what consumers believe they gain from a good, so it shifts the demand (MPB) curve. For a demerit good, demand falls (MPB shifts left towards MSB); for a merit good, demand rises (MPB shifts right towards MSB). If the campaign is fully successful, the new MPB coincides with MSB and the market reaches Qopt without any change in price controls or taxes.
Education campaigns respect consumers’ freedom of choice and tackle the cause of the problem rather than its symptoms. Their limitations are that effects take a long time to appear, are hard to measure, and may be small: many smokers know the risks but continue because of addiction. They also cost money and do nothing about the external cost to third parties, so they are usually combined with taxes or regulation.
Tradable permits, also called cap and trade, combine a fixed limit with the flexibility of a market. The government sets a cap on total emissions in an industry or region and issues permits that together add up to the cap. Each permit allows its owner to emit one unit of pollution, usually one tonne of carbon dioxide. Firms that pollute must hold enough permits to cover their emissions, and they may buy and sell permits among themselves.
Permits are given away free or sold at auction. A firm that can cut its emissions cheaply will do so and sell its spare permits; a firm for which cutting is expensive will buy permits instead. The total amount of pollution is fixed by the cap, but the reductions take place in the firms that can make them at the lowest cost.
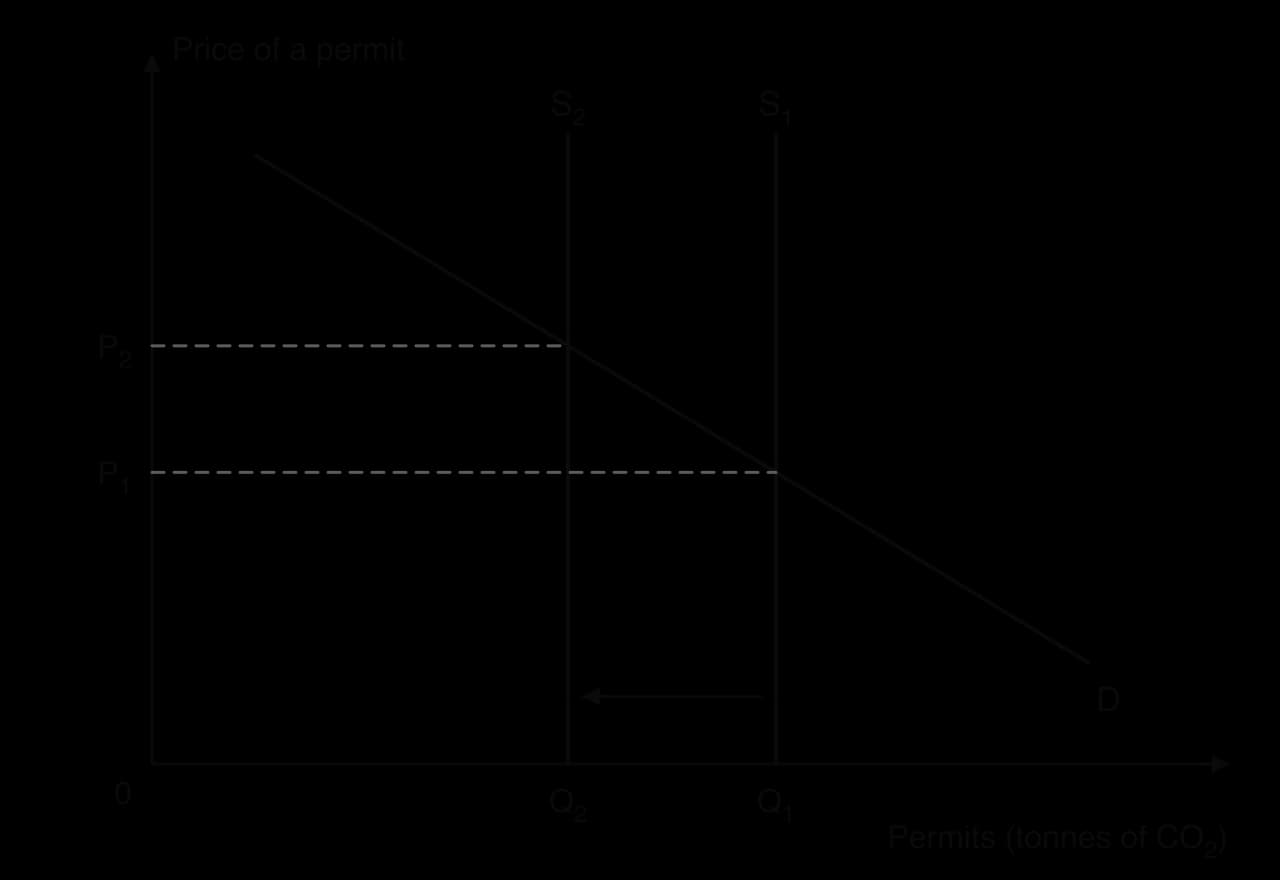
Because the government fixes the number of permits, the supply curve of permits is vertical. Demand for permits comes from polluting firms and depends on how costly it is for them to cut emissions and on how much they produce. The permit price is set by the market. When the government lowers the cap over time, the supply curve shifts left and the price rises, which strengthens the incentive to invest in cleaner technology.
Permits have clear strengths. The cap gives certainty about the quantity of emissions, which a tax does not. Reductions are made where they are cheapest, as the worked example shows. Auctioning permits raises revenue, and lowering the cap over time tightens the limit predictably.
The limitations are also significant. The permit price can be volatile, which makes it hard for firms to plan long-term investment. If the cap is set too high, or too many permits are given away, the price collapses and the scheme does little. Monitoring the emissions of thousands of installations is costly, and giving permits away free can create windfall profits for polluters. Like carbon taxes, permit schemes in one region can cause carbon leakage.
Feature | Carbon tax | Tradable permits (cap and trade) |
|---|---|---|
What the government fixes | The price of emitting | The quantity of emissions (the cap) |
What the market decides | The quantity emitted | The price of a permit |
Certainty | Predictable price, uncertain emissions | Certain emissions, volatile price |
Revenue | Always raises revenue | Only if permits are auctioned |
Ease of setting up | Simple, using existing tax systems | Complex: registries, allocation rules, monitoring |
Main risk | Set too low to change behaviour | Cap too generous, so the price collapses |
For goods with positive externalities, and for merit goods, the aim is the opposite: to raise output from Qm to Qopt. The main tools are subsidies, government provision, regulation that makes consumption compulsory, and the information campaigns already described.
A subsidy is a payment by the government to producers for each unit they produce. It lowers the firm’s cost, so the supply curve shifts down by the subsidy per unit. If the subsidy equals the external benefit at the optimum, the new supply curve meets MPB at Qopt.
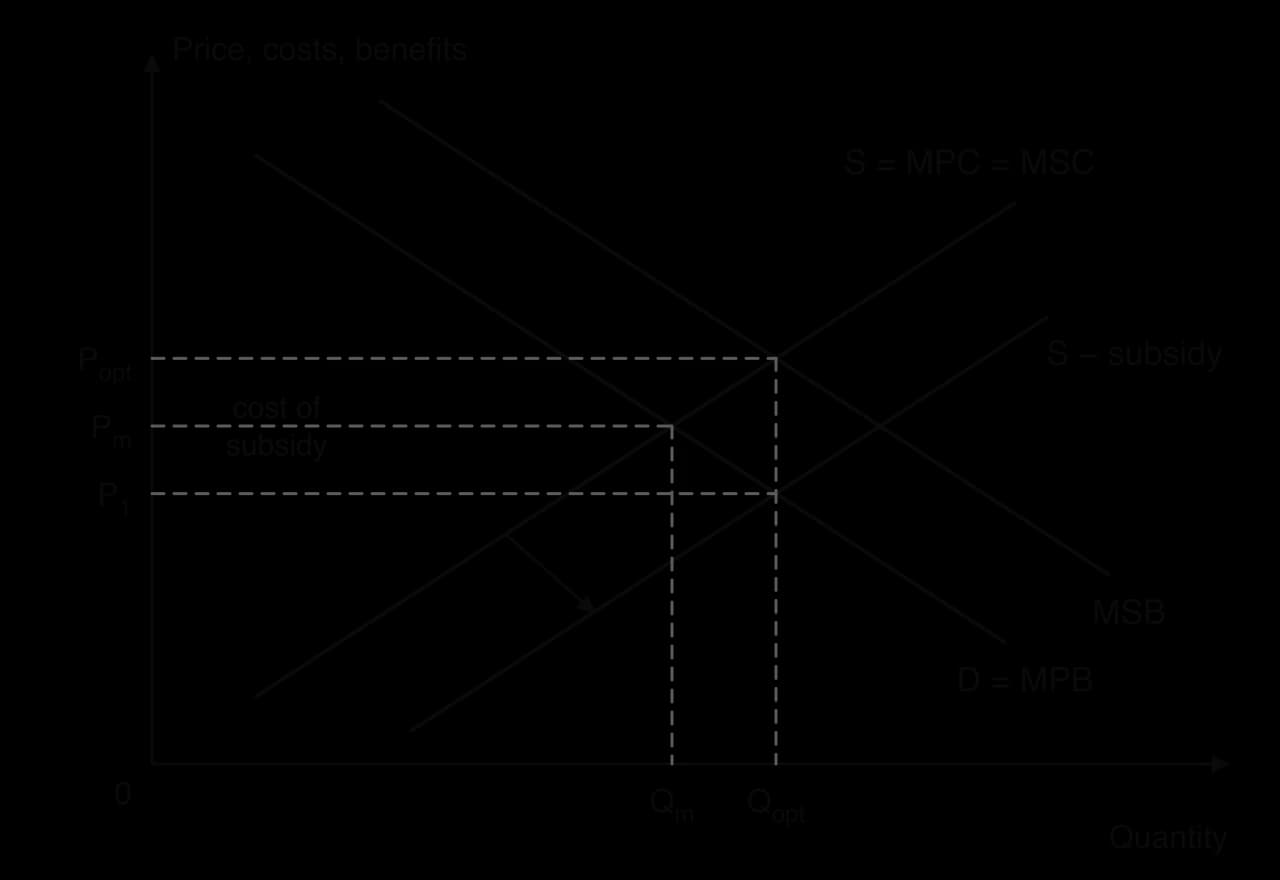
Consumers now pay a lower price (P₁) and buy more, while producers receive a higher price (Popt) and supply more. The welfare loss of underconsumption is removed. The cost to the government is the subsidy per unit times the new quantity, the shaded rectangle.
Subsidies are used for vaccines, public transport, renewable energy, training and research. Their strengths are that they raise consumption of goods society values and make them more affordable for low-income households, which helps equity. Their limitations are the opportunity cost to the government (the money could be spent elsewhere or left with taxpayers), the difficulty of measuring the external benefit, and the risk that firms become dependent on support that is hard to withdraw.
Governments often provide merit goods directly, free of charge or at a low price: state schools, public hospitals and vaccination programmes. This is direct provision. It ensures access for everyone regardless of income, which supports equity, and it can raise consumption to the social optimum or beyond.
When a service is free at the point of use, consumers use it until their marginal private benefit is zero, so the quantity demanded may exceed Qopt. The result can be waiting lists and overcrowding, as in many public health systems. Direct provision also has a large opportunity cost, must be paid for with taxes, and may be less efficient than private provision when public providers face little competition.
Laws can make consumption of a merit good compulsory. Most countries require children to attend school up to a minimum age; some require vaccinations for school entry; many require car drivers to wear seatbelts. Regulation of this kind raises consumption directly, but it can be resisted as an infringement of personal freedom and needs enforcement. Information campaigns, such as those promoting vaccination, shift MPB to the right, as in the left panel of the education diagram.
Common pool resources can be protected by the same tools used for other negative externalities, adapted to the resource: catch quotas and fishing seasons for fisheries, limits on how much water each farm may pump, protected areas where logging is banned, and taxes or fees for each unit extracted. Some fisheries use individual transferable quotas, a form of tradable permit that gives each fisher a share of the total allowed catch, which can be bought and sold.
A different approach is to let the users govern the resource themselves. The political economist Elinor Ostrom studied mountain pastures in Switzerland and Japan, irrigation systems in Spain and the Philippines, and fisheries around the world. She found that many communities had managed shared resources sustainably for centuries without either private ownership or central government control. In 2009 she became the first woman to receive the Nobel Memorial Prize in Economic Sciences, shared with Oliver Williamson.
In Governing the Commons (1990), Ostrom set out the conditions under which self-governance tends to work. They include clearly defined boundaries (who may use the resource and where it ends), rules that suit local conditions, the right of users to take part in changing the rules, monitoring by people accountable to the users, penalties that rise with the seriousness of the offence, cheap and quick ways of settling disputes, and recognition of the community’s right to organise by outside authorities.
Sources: Wikipedia, “Elinor Ostrom” (2026), citing Ostrom (1990) and the Royal Swedish Academy of Sciences (2009).
Self-governance works best for local resources with a stable group of users who know each other and depend on the resource over the long term. It is much harder for resources shared by millions of users or by many countries, such as ocean fisheries or the atmosphere, where users cannot easily monitor each other and the gains from cheating are large.
No policy is best in every case. Which one works depends on the type of externality, on how well it can be measured, on how buyers and sellers respond to price changes, and on the ability of the government to monitor and enforce. Intervention can itself fail: government failure occurs when a policy makes resource allocation worse or creates new problems.
Every diagram assumes the government knows where the MSC and MSB curves lie. In reality, external costs and benefits are hard to measure in money terms. Valuing the harm from air pollution requires estimates of illnesses caused, lives shortened and the value placed on a human life. The damage from carbon dioxide depends on how the climate will change over the next century and how future losses are valued today. Estimates of the external cost can differ several times over.
This uncertainty affects every policy. A tax or subsidy set at the wrong level leaves part of the welfare loss or creates a new one, and a cap or a regulation can be set too loose or too tight. Externalities also fall unevenly: the same tonne of pollution harms more people in a crowded city than in an empty desert, while a single national tax or rule treats them the same.
Effectiveness depends heavily on price elasticity of demand. Taxes on goods with price inelastic demand (cigarettes, petrol) raise revenue but reduce quantity only a little in the short run; they work better in the long run, when people can find alternatives, such as more efficient cars. Regulation can achieve a definite result regardless of elasticity, but at a higher cost to firms.
Enforcement matters too. A regulation that is not enforced achieves nothing, and a tax that can be avoided by smuggling loses much of its effect. Policies that rely on information depend on whether people change their behaviour once they know the facts, which is often slow. Time lags matter: a carbon price may take decades to change the stock of power stations and buildings.
Each policy creates winners and losers among stakeholders. Identifying who gains and who loses is central to judging whether a policy is fair and whether it is likely to survive politically.
Policy | Gains | Loses or bears the cost |
|---|---|---|
Pigouvian or carbon tax | Third parties (less pollution); the government (revenue); producers of clean alternatives | Consumers (higher prices, regressive burden); producers of the taxed good (lower price received, lower output); workers in the industry |
Tradable permits | Third parties; firms that cut emissions cheaply and sell permits; the government if permits are auctioned | Firms that must buy permits; consumers through higher prices |
Regulation and legislation | Third parties; firms making compliant technology | Firms with higher compliance costs; consumers (higher prices, less choice); taxpayers (enforcement) |
Education and awareness | Consumers who make better-informed choices; third parties | Taxpayers (the cost of the campaign); producers of demerit goods |
Subsidies and government provision | Consumers (lower prices, more access); producers of the subsidised good; third parties | Taxpayers; other public services that lose funding (opportunity cost) |
Market-based policies (taxes and permits) tend to achieve a given reduction in pollution at the lowest cost, because they let the firms that can cut cheaply do most of the cutting. Regulation is better where the harm is so severe that only a ban will do, or where demand is too inelastic for a price signal to work. Education is a useful supporting policy but is rarely enough on its own. In practice, governments combine several tools: tobacco is taxed, regulated and the subject of health campaigns at the same time.
Many externalities cross borders. Air pollution from one country falls on its neighbours; overfishing in international waters depletes stocks that many countries share; and greenhouse gases emitted anywhere warm the whole planet. No single government can solve these problems, because it controls only its own share of the cause.
This creates a free rider problem between countries. Each country gains from a stable climate whether or not it cuts its own emissions, so each has an incentive to let others bear the cost of cutting. A country that acts alone pays the full cost of its policy but receives only a small share of the global benefit, and some of its emissions cuts may be undone by carbon leakage.
The Montreal Protocol, agreed on 16 September 1987, phased out the chemicals that were destroying the ozone layer. It has been ratified by 198 parties, every member of the United Nations, and about 98% of the ozone-depleting substances it controls have been phased out. Scientists project that the ozone layer will return to its 1980 condition by around 2040 over most of the world and by 2066 over Antarctica.
Several features explain its success. Substitutes for the harmful chemicals existed, so the cost of compliance was low. A small number of firms made the chemicals, which made monitoring easy. A Multilateral Fund paid for poorer countries to make the switch, which addressed their equity concerns. The Kigali Amendment of 2016 extended the agreement to hydrofluorocarbons, powerful greenhouse gases.
Sources: Wikipedia, “Montreal Protocol” (2026), citing UNEP and the World Meteorological Organization.
The Paris Agreement, adopted on 12 December 2015, commits its parties to hold the rise in global average temperature to well below 2 °C above pre-industrial levels and to pursue efforts to limit it to 1.5 °C. Each country sets its own emissions target, a nationally determined contribution, and updates it about every five years.
The agreement has near-universal membership (194 parties as of January 2026), but the national targets are not legally binding and there is no mechanism to force a country to meet them; the main pressure is public reporting and peer review. The United States left the agreement in 2020, rejoined in 2021, and left again with effect from 27 January 2026, which shows how dependent the agreement is on the politics of individual countries.
Sources: Wikipedia, “Paris Agreement” (2026), citing the UNFCCC.
Free riding: each country benefits from others’ cuts without making its own, so agreements tend to settle on weak targets that all can accept.
Different costs and responsibilities: high-income countries are responsible for a large share of past emissions, while many lower-income countries argue that they need cheap energy to grow and reduce poverty. Agreeing a fair share of the burden is an equity question with no single answer.
Sovereignty: countries are reluctant to accept rules imposed from outside, and governments can change their policies after elections.
Costs now, benefits later: the costs of cutting emissions fall on today’s voters, while most of the benefits go to future generations and to other countries.
Even when countries agree, an agreement works only if behaviour can be checked and broken promises have consequences. Emissions must be measured consistently in every country, which requires technical capacity that some governments lack. There is no world government to impose penalties, so enforcement relies on reputation, trade measures or the threat that others will abandon the agreement. The Montreal Protocol restricted trade in the controlled chemicals with countries outside it; the European Union’s Carbon Border Adjustment Mechanism, which charges importers for the carbon emitted in making some goods, is a newer attempt to use trade to support climate policy.
Externalities and common pool resources draw on most of the key concepts.
Key concept | How it applies to externalities and common pool resources |
|---|---|
Scarcity and choice | Clean air, fish stocks and a stable climate are scarce; using more of them now leaves less for others and for the future. |
Efficiency | Externalities move output away from MSB = MSC, causing a welfare loss; policies aim to restore allocative efficiency. |
Equity | Pollution often harms poorer communities most; corrective taxes can be regressive; who should pay for climate action is disputed. |
Sustainability | Common pool resources are depleted when use exceeds regeneration, harming future generations. |
Intervention | Taxes, permits, regulation, subsidies and provision are all interventions, each with costs and risks of government failure. |
Interdependence | Cross-border pollution and climate change mean countries’ choices affect each other, so cooperation is needed. |
The European Union Emissions Trading System (EU ETS), launched in January 2005, was the world’s first major cap-and-trade scheme for greenhouse gases and is still one of the largest. It covers power stations and energy-intensive industry in the EU, Iceland, Liechtenstein and Norway, flights within Europe and, since 2024, shipping. It covers about 37% of total greenhouse gas emissions in the European Economic Area. Each year, every installation must surrender one allowance (a permit) for each tonne of carbon dioxide equivalent it emitted.
In its first years, most allowances were given away free, and governments based their allocations on firms’ own estimates of future emissions. Too many permits were issued. In 2007, the end of the trial phase, the allowance price fell almost to zero, so the scheme gave firms almost no reason to cut emissions. The same problem recurred after 2008: the recession cut industrial output, and from 2009 to 2012 more allowances were issued each year than installations emitted. About 1.7 billion surplus allowances were carried into the next phase, and the price fell to a record low of €2.81 per tonne in January 2013.
In terms of the permit diagram, the supply of permits (the cap) was far to the right of what firms needed, so the price that cleared the market was very low. A cap-and-trade scheme works only if the cap is tight enough to make permits scarce.
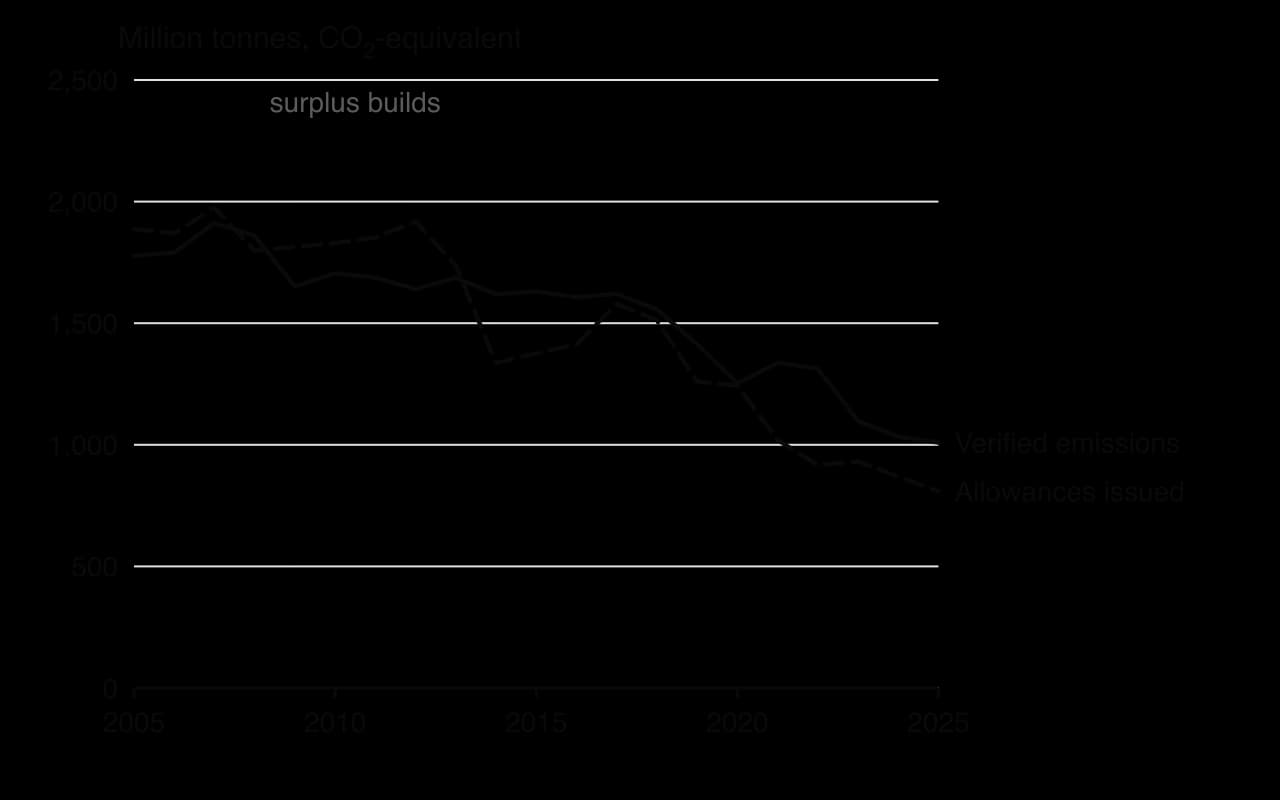
The EU responded by tightening supply. From 2013 a single EU-wide cap replaced national allocations, more permits were sold at auction, and the cap was set to fall each year. In 2019 a Market Stability Reserve began to remove surplus allowances from the market automatically: when the number of allowances in circulation is above about 1.1 billion, 24% of that volume is withheld from auctions. With supply shrinking, the price rose, passing €100 per tonne for the first time in February 2023. In 2025 allowances sold for an average of about €74 per tonne, and auctions raised €43.2 billion.
Emissions fell as the scheme tightened. Emissions from stationary installations covered by the EU ETS fell by 51% between 2005 and 2024, with a fall of 15% between 2022 and 2023 alone, the largest in a single year since the scheme began. The 2030 target is a 62% cut compared with 2005.
Phase | Years | Main features |
|---|---|---|
I (trial) | 2005–2007 | National caps; over 90% of allowances free; price fell almost to zero in 2007 |
II | 2008–2012 | Tighter caps but the recession created a surplus; international offset credits allowed |
III | 2013–2020 | Single EU-wide cap falling each year; more auctioning; Market Stability Reserve from 2019 |
IV | 2021–2030 | Faster fall in the cap; target of −62% by 2030 compared with 2005; shipping added from 2024 |
The scheme illustrates both the strengths and the limits of tradable permits. Once the cap was tight, emissions fell much faster in the covered sectors than elsewhere in the economy, and the cuts happened where they were cheapest, mainly by switching power generation from coal to gas and renewables. The price signal also guides investment, and auctions raise large revenues.
Its early years show the importance of measurement and political design. Allocations based on firms’ own forecasts were too generous, and free permits gave windfall profits to some polluters. Economists also debate how much of the fall in emissions was caused by the ETS itself and how much by cheaper renewable energy, national subsidies and slow economic growth; estimates of the scheme’s own effect vary widely.
Carbon leakage has shaped the scheme throughout. Heavy industries received free allowances to protect their competitiveness, which weakened their incentive to cut emissions. From 2026, the Carbon Border Adjustment Mechanism charges importers of goods such as steel, cement and aluminium for their embedded emissions, and free allowances for these industries are being phased out between 2026 and 2034. A second scheme, ETS2, covering fuel for buildings and road transport, is due to start in 2028; it will raise heating and petrol costs for households, which makes its effect on low-income households a central political question.
Taken together, the evidence suggests that tradable permits can cut emissions substantially when the cap is tight and credible, but that a single region cannot solve a global problem alone: without similar pricing elsewhere, or border measures, some emissions would simply move abroad.
Sources: European Environment Agency, EU ETS data viewer dataset (July 2026) and indicator “Greenhouse gas emissions under the EU ETS” (2026); International Carbon Action Partnership, EU ETS factsheet (2026); European Commission; Reuters (21 February 2023), via Wikipedia, “European Union Emissions Trading System” (2026).
Externalities and common pool resources appear in every paper. Paper 1 questions often ask you to explain a type of externality with a diagram in part (a), then to evaluate a policy in part (b). Paper 2 data sets often describe a pollution problem, a fishery or a public health campaign and ask for definitions, diagrams and an evaluation using the text. HL Paper 3 can ask you to calculate a welfare loss, a tax revenue or a subsidy cost from the values on a diagram.
Part (b) questions on externalities usually ask you to evaluate one policy, or to compare policies, using real-world examples. A strong answer explains how the policy works with a diagram, then weighs its strengths and limitations against the conditions of a real case.
Define the term merit good. [2] A good that is underconsumed in a free market because consumers underestimate its benefit to themselves (information failure), such as education; it often has positive consumption externalities.
Define the term common pool resource. [2] A resource that is rivalrous (one person’s use reduces what is left for others) but non-excludable (no one can be prevented from using it), such as ocean fish.
Using a diagram, explain how a negative consumption externality from car use leads to market failure. [4] Draw D = MPB, MSB below it, S = MPC = MSC; show Qm > Qopt and hatch the welfare loss; explain that drivers ignore the congestion and pollution they cause for others.
Using a diagram, explain how a subsidy on vaccines could achieve the socially optimal level of vaccination. [4] Draw the positive consumption externality diagram with S − subsidy meeting MPB at Qopt; explain the lower price for consumers and the cost to the government.
A Paper 2 part (g) question might ask you to evaluate a government’s carbon tax using the text. Plan it in the same way as a Paper 1 part (b) answer, but build the evaluation from the figures and stakeholders in the text, such as the tax rate, the share of revenue returned to households and the industries affected, rather than from outside examples.
Paper 3 part (b) may then ask you to recommend a policy, for example to reduce fertiliser run-off. Choose one policy (a tax, regulation of how much fertiliser can be applied, or subsidies for alternatives), explain it with theory, use the figures you calculated, weigh its costs and its effect on farmers and consumers, and end with a clear recommendation.
Allocative efficiency and the social optimum occur where MSB = MSC; the free market produces where MPB = MPC, which differs when there are externalities.
Negative externalities (MSC > MPC, or MSB < MPB) cause overallocation; positive externalities (MSC < MPC, or MSB > MPB) cause underallocation. The welfare loss lies between MSB and MSC, from Qm to Qopt.
Demerit goods are overconsumed and merit goods underconsumed, because of information failure, externalities and, for merit goods, equity concerns.
Common pool resources are rivalrous but non-excludable, so each user overuses them: the tragedy of the commons, an unsustainable negative externality.
Responses to negative externalities include Pigouvian and carbon taxes, regulation, education, tradable permits and collective self-governance; responses to positive externalities include subsidies, government provision, regulation and information.
Evaluating any policy depends on how well the externality can be measured, price elasticity, enforcement, time lags and the effect on stakeholders; intervention can itself fail.
Global problems such as climate change need international agreements, which face free riding, disputes over fair shares, and weak monitoring and enforcement.
I can explain why the socially optimal output is where MSB = MSC and draw the allocative efficiency diagram.
I can draw all four externality diagrams from memory, with curves, Qm, Qopt and the welfare loss labelled correctly.
I can distinguish merit and demerit goods from externalities and explain why each is misallocated.
I can explain why common pool resources are overused and link the tragedy of the commons to sustainability.
I can draw and explain the diagrams for Pigouvian and carbon taxes, regulation, education and subsidies.
I can explain how tradable permits, government provision, collective self-governance and international agreements work.
I can calculate the welfare loss caused by an externality from the values on a diagram (HL).
I can evaluate each policy, including the difficulty of measuring externalities and its effects on stakeholders, and reach a judgment.
I can discuss why international cooperation is needed for global sustainability problems and why it is difficult, using real examples.
Level | Marks | Descriptor |
|---|---|---|
0 | 0 | The work does not reach a standard described by the descriptors below. |
1 | 1–2 | Little understanding of the specific demands of the question. Relevant economic theory is stated but not relevant. Economic terms are stated but not relevant. |
2 | 3–4 | Some understanding of the specific demands of the question. Relevant economic theory is described. Some relevant economic terms are included. |
3 | 5–6 | The specific demands of the question are understood but only partially addressed. Relevant economic theory is partly explained. Some relevant terms are used appropriately. Where appropriate, relevant diagram(s) are included. |
4 | 7–8 | The specific demands of the question are understood and addressed. Relevant economic theory is explained. Relevant terms are used mostly appropriately. Where appropriate, relevant diagram(s) are included and explained. |
5 | 9–10 | The specific demands of the question are understood and addressed. Relevant economic theory is fully explained. Relevant terms are used appropriately throughout. Where appropriate, relevant diagram(s) are included and fully explained. |
Using real-world examples, discuss the view that government intervention in markets does more harm than good.
15 marks
Answers may include:
Terminology: government intervention, market failure, government failure, price controls, indirect taxes, subsidies, regulation, allocative efficiency, welfare loss, equity.
Explanation: arguments that intervention harms: price ceilings and floors create shortages, surpluses and welfare losses; subsidies and taxes in markets without externalities misallocate resources; regulation raises costs and may be captured by interest groups; governments lack information. Arguments that intervention helps: correcting negative and positive externalities moves output towards the social optimum (MSB = MSC); provision of public goods that markets would not supply; redistribution to promote equity.
Diagram(s): price ceiling or price floor showing a shortage or surplus and welfare loss; externalities diagram showing a Pigouvian tax moving output from the market quantity to the socially optimal quantity.
Synthesis/evaluation: depends on the type of intervention and whether there is genuine market failure; measurement problems (the size of an externality is hard to estimate); design and enforcement matter; short-run versus long-run effects; stakeholders (consumers, producers, workers, taxpayers) are affected differently; equity objectives may justify some efficiency loss; a reasoned conclusion that some forms of intervention do more harm than good while others correct significant failures.
Examples: the UK Soft Drinks Industry Levy (2018), which led manufacturers to reduce sugar content; rent controls in Berlin (2020–2021) and the fall in advertised rental supply; the EU's Common Agricultural Policy intervention buying in the 1980s and the resulting 'butter mountains'; the Montreal Protocol (1987), which successfully phased out ozone-depleting substances.
A maximum of [9] should be awarded if only the harms or only the benefits of intervention are discussed.
N.B. Terminology, theory, diagrams and examples given in part (a) and referred to in part (b) should be rewarded.
Examiners should be aware that candidates may take a different approach which, if appropriate, should be rewarded.
Markbands (best fit)
Level | Marks | Descriptor |
|---|---|---|
0 | 0 | The work does not reach a standard described by the descriptors below. |
1 | 1–3 | Little understanding of the specific demands of the question. Theory is stated but not relevant. Terms are not relevant. No synthesis or evaluation. Real-world examples are identified but not relevant. |
2 | 4–6 | Some understanding of the demands. Relevant theory is described. Some relevant terms are included. Synthesis or evaluation is superficial. A relevant real-world example is identified. |
3 | 7–9 | The demands are understood but only partially addressed. Theory is partly explained. Some terms are used appropriately. Relevant diagram(s) are included where appropriate. Synthesis or evaluation is appropriate but lacks balance. Example(s) are identified and partly developed in context. |
4 | 10–12 | The demands are understood and addressed. Theory is explained. Terms are used mostly appropriately. Diagram(s) are included and explained. Synthesis or evaluation is appropriate and mostly balanced. Example(s) are identified and developed in the context of the question. |
5 | 13–15 | The demands are understood and addressed. Theory is fully explained. Terms are used appropriately throughout. Diagram(s) are included and fully explained. Synthesis or evaluation is effective and balanced. Example(s) are identified and fully developed to support the argument. |
The atmosphere's capacity to absorb greenhouse gases has long been treated as if it were unlimited.
Explain why the atmosphere may once have been regarded as a free good and why its use now involves an opportunity cost.
10 marks
Using real-world examples, evaluate the view that carbon taxes are the most effective way to reduce greenhouse gas emissions.
15 marks
Governments must decide how much of a country's resources to devote to healthcare rather than to other goods and services.
Using a production possibilities curve (PPC), explain why the opportunity cost of producing additional healthcare is likely to increase as more healthcare is produced.
10 marks
Using real-world examples, evaluate the consequences for stakeholders of the direct provision of healthcare by the government.
15 marks