
Explain the law of demand, draw demand curves for individuals and markets, analyse how non-price determinants shift demand, and tell a movement along the curve from a shift of it.
Each is in the Economics glossary, with every other term in the subject.
Goods that are used together, so that a rise in the price of one reduces the demand for the other.
The quantities of a good or service that consumers are willing and able to buy at each possible price during a given time period, ceteris paribus.
A graph showing the quantity demanded of a good at each possible price, ceteris paribus; it normally slopes downwards from left to right.
A table listing the quantity of a good demanded at each of a range of prices, for one consumer or for the whole market, ceteris paribus.
Consumers’ or producers’ beliefs about what the price of a good will be in the future, which affect how much they buy or sell today.
A rare type of inferior good, usually a staple food for very poor households, for which a rise in price leads to a rise in quantity demanded because the income effect outweighs the substitution effect.
The change in quantity demanded that results from a change in consumers’ real income (purchasing power) when the price of a good changes.
A good for which demand falls when consumers’ incomes rise and rises when incomes fall, ceteris paribus, usually because buyers switch to better-quality alternatives.
The principle that, ceteris paribus, as the price of a good rises the quantity demanded falls, and as the price falls the quantity demanded rises: an inverse relationship.
The principle that, as a consumer consumes more units of a good in a given period, the additional satisfaction gained from each extra unit eventually falls.
The additional satisfaction (utility) a consumer gains from consuming one more unit of a good or service.
The total quantity of a good demanded by all consumers in a market at each price, found by adding the quantities that individual consumers demand at that price.
A change in the quantity demanded caused only by a change in the good’s own price, shown as a move from one point to another on the same demand curve.
The factors other than the good’s own price that affect how much consumers want to buy, such as income, tastes, expectations, the prices of related goods and the number of consumers; a change in one shifts the demand curve.
A good for which demand rises when consumers’ incomes rise and falls when incomes fall, ceteris paribus.
The amount of a good or service that consumers are willing and able to buy at one particular price during a given time period.
A change in the quantity demanded at every price, caused by a change in a non-price determinant of demand; an increase shifts the curve right and a decrease shifts it left.
Goods that can be used in place of each other, so that a rise in the price of one increases the demand for the other.
The change in quantity demanded that results from a good becoming relatively cheaper or dearer than its substitutes when its price changes.
The total satisfaction a consumer gains from consuming a given quantity of a good or service in a period.
A luxury good bought partly to display wealth or status, for which a higher price can make the good more desirable to some buyers.
Define demand and explain the law of demand, including the role of ceteris paribus.
Draw a downward-sloping demand curve from a demand schedule and label it fully.
Explain how market demand is found from the demand of individual consumers.
Explain how each non-price determinant of demand (income, tastes and preferences, future price expectations, the prices of substitutes and complements, the number of consumers) shifts the demand curve.
Distinguish between a movement along the demand curve and a shift of the demand curve, using diagrams.
Explain the income effect and the substitution effect of a price change (HL).
Explain how the law of diminishing marginal utility underlies the downward slope of the demand curve (HL).
Demand describes how much of a good or service consumers want to buy, and are able to pay for, at different prices. It is one half of every market: together with supply, it decides the prices people pay and the quantities that are produced, from coffee and smartphones to rented flats and electricity.
Demand is where the key concepts of scarcity and choice first meet a market. Consumers have limited incomes and unlimited wants, so every purchase has an opportunity cost: money spent on one good cannot be spent on another. Demand theory explains how these choices respond when prices, incomes and circumstances change.
103 exam-style questions on this subtopic, written in the style of the IB papers. The first has its markscheme open. Counted on
Classical economists assumed that consumers and firms act rationally in pursuit of their own interests.
Explain how classical microeconomics used the concept of utility to explain consumer choice and the law of demand.
10 marks
Answers may include:
Terminology: utility (the satisfaction gained from consuming a good or service), total utility, marginal utility, the law of diminishing marginal utility, the margin, rational consumer, law of demand.
Explanation: 19th-century economists treated consumers as rational individuals who allocate their limited income to maximize total utility; the key decision is made at the margin: whether the extra (marginal) utility from one more unit is worth its price; as more of a good is consumed, each additional unit gives less satisfaction (diminishing marginal utility), so the consumer is willing to pay less for further units; a consumer will therefore buy more only if the price falls, which explains the downward-sloping demand curve and the law of demand; this marginal approach replaced earlier ideas that value depended only on the cost of production (the paradox of value: water is useful but cheap because its marginal utility is low).
Diagram: a demand curve derived from diminishing marginal utility (price on the vertical axis, quantity on the horizontal axis), or a marginal utility curve sloping downwards; or any other relevant diagram.
A maximum of [6] should be awarded if utility is explained without linking it to the law of demand.
Markbands (best fit)
One of 57 short multiple-choice questions on 2.1. Pick an answer to see why it's right or wrong.
A market for cinema snacks has three consumers. At a price of $3, Lena buys 4 snacks, Omar buys 7 and Pia buys 0. What is the market quantity demanded at $3?
The official deck for this part of the syllabus.
What is demand?
Which term describes: the quantities of a good or service that consumers are willing and able to buy at each possible price during a given time period, ceteris paribus?
With a free account, Augment remembers where you stopped and what you have practiced.
In everyday speech, “demand” often means simply wanting something. In economics, a want only counts as demand when it is backed by the ability to pay. A student who would like a new laptop but has no money to buy one does not add to the demand for laptops; a student who has saved enough and is willing to spend it does.
Three parts of this definition matter. “Willing and able” separates demand from desire. “At each possible price” means demand is a whole relationship between price and quantity, not a single number. “During a given time period” matters because 10 cups of coffee a week and 10 cups a year describe very different consumers.
The amount bought at one particular price has its own name, the quantity demanded. Economists keep the two terms apart because they change for different reasons, and confusing them is the source of many errors in analysis.
Demand theory also relies on the assumption of ceteris paribus, Latin for “other things being equal”. To isolate the effect of price on the quantity bought, economists hold everything else that could affect buying decisions constant: consumers’ incomes, their tastes, the prices of other goods, and so on. In reality these things change all the time, which is why demand is analysed one cause at a time.
Across almost every market, a pattern holds, known as the law of demand: when the price of a good rises, people buy less of it, and when the price falls, they buy more. Shops hold sales because lower prices raise the quantity sold; airlines cut fares on unpopular flights for the same reason.
The law describes a relationship between a good’s own price and its quantity demanded, with everything else held constant. It says nothing about what happens when incomes or tastes change at the same time as price; those effects are separated out as shifts of demand.
There are two intuitive reasons for the law. First, when a good becomes cheaper, consumers can afford more of it with the same income. Second, a cheaper good becomes better value compared with the alternatives, so some consumers switch to it from other goods. Economists call these two reasons the income effect and the substitution effect.
The photograph shows a familiar use of the law. A clothing shop with unsold stock at the end of a season lowers its prices; at the lower prices, consumers are willing and able to buy a larger quantity. The shop has not changed what consumers want; it has moved them to a different point on the same demand relationship.
Demand can be shown as a table or as a graph. A table, the demand schedule, lists the quantity demanded at several prices, and it can describe one consumer or the whole market.
Price ($ per cup) | Quantity demanded (cups per week) |
|---|---|
5 | 10 |
4 | 20 |
3 | 30 |
2 | 40 |
1 | 50 |
The hypothetical schedule for coffee in a small town shows the law of demand at work: each $1 fall in price raises the quantity demanded by 10 cups a week. Plotting each pair of values and joining the points gives the demand curve.
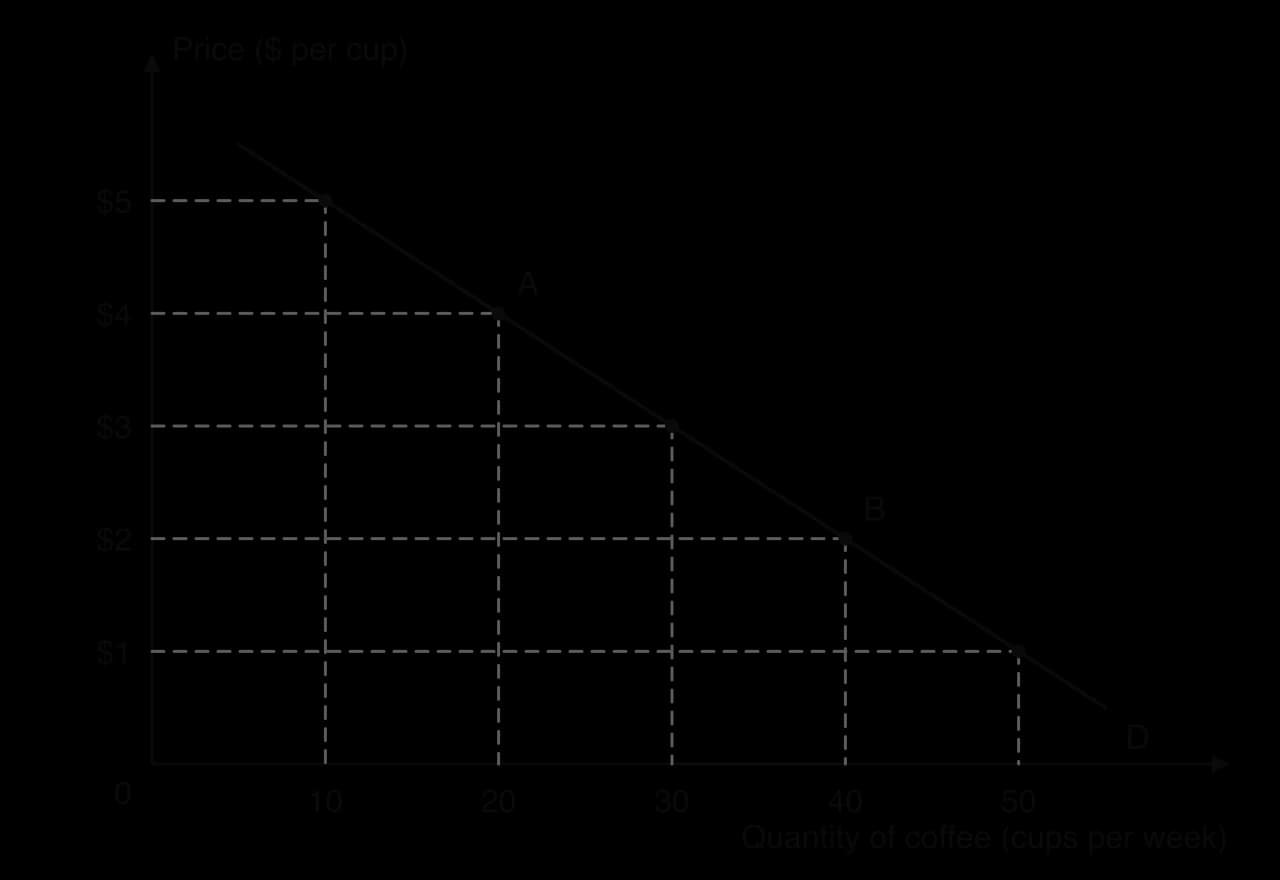
The diagram uses the conventions every demand diagram follows. Price goes on the vertical axis and quantity on the horizontal axis, each axis is labelled, and the curve is labelled D at its end. Moving from point A to point B along D shows the law of demand: the lower price is matched by a larger quantity demanded.
Economists usually draw demand curves as straight lines for simplicity, even though real demand curves are often curved. The shape matters for some questions, such as how strongly quantity responds to price, which is measured by price elasticity of demand. For most analysis, what matters is the direction of the slope and the position of the curve.
 YouTube
Each consumer has a demand curve of their own, showing how much they would buy at each price. Firms and governments, however, are usually interested in the demand of everyone in the market. Market demand is found by adding up individual demands.
The addition is done horizontally: at each price, the quantities are added together. If Ana buys 6 units at $4 and Ben buys 8 units at $4, the market quantity demanded at $4 is 6 + 8 = 14 units. Repeating this at every price traces out the market demand curve.
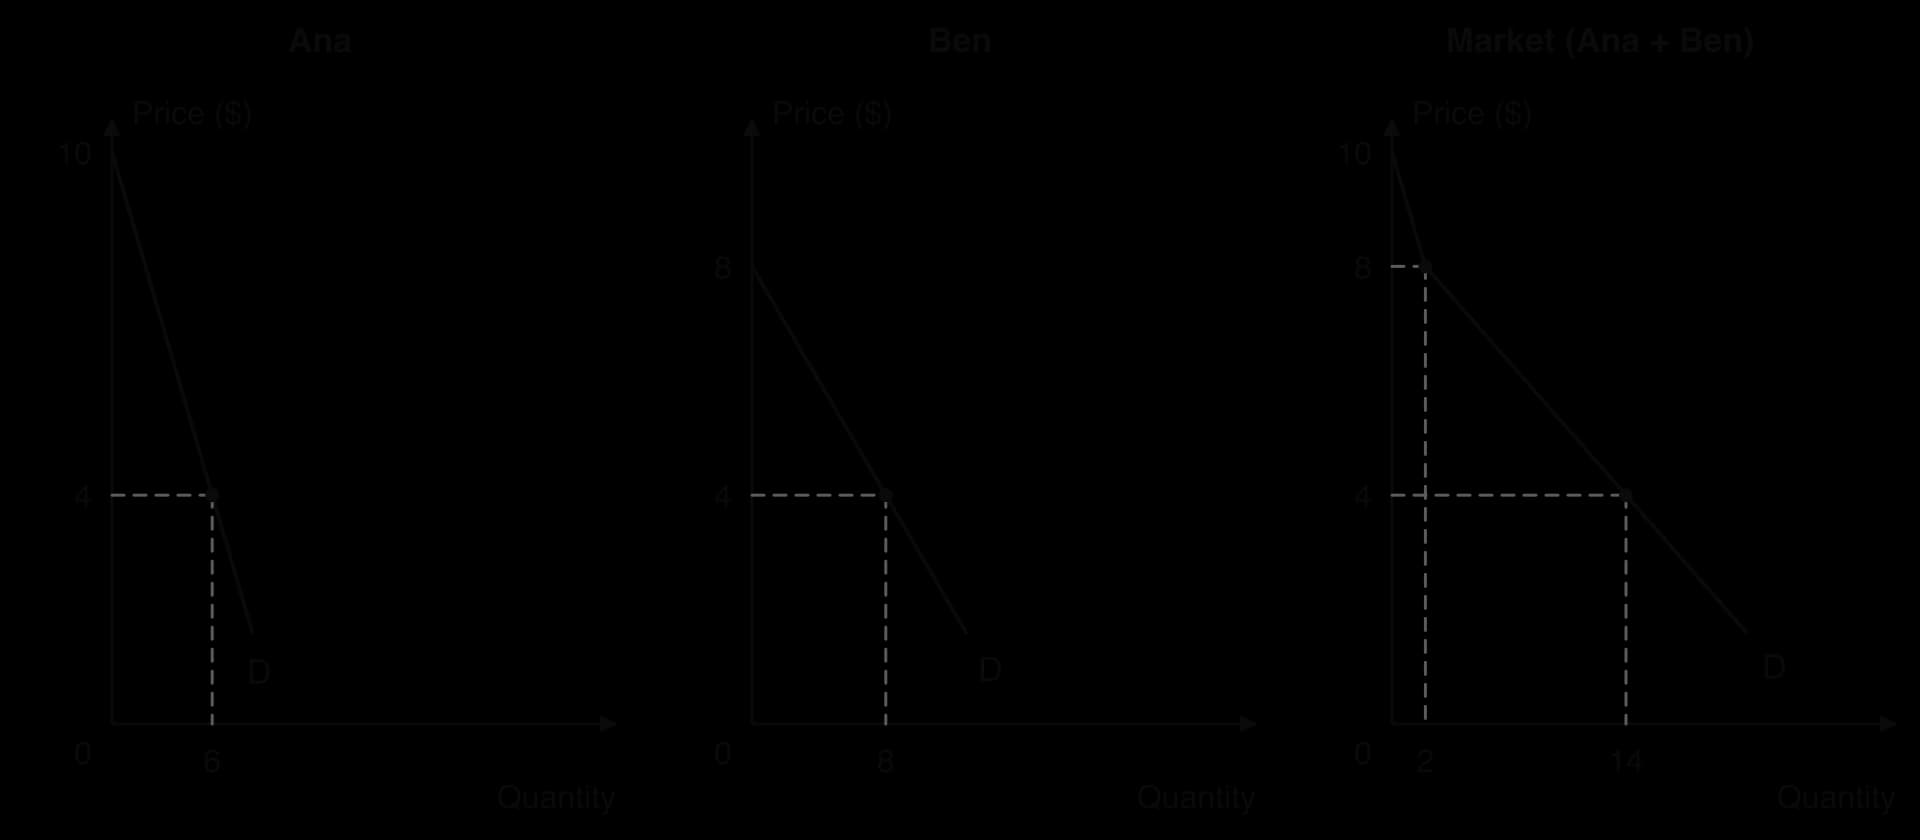
The diagram shows two features of market demand. The market curve lies further to the right than either individual curve, because it adds their quantities. It also has a kink: above $8 Ben buys nothing, so market demand above $8 is Ana’s demand alone. In a real market with millions of consumers, each with a different maximum price, these kinks smooth out into a continuous curve.
This link between individual and market demand explains one of the non-price determinants. When more consumers enter a market, there are more individual demand curves to add together, so the market demand curve moves to the right at every price.
The law of demand is an observation about how consumers behave. Economic theory offers two complementary explanations of why it holds. The first splits the effect of a price change into an income effect and a substitution effect. The second starts from the satisfaction consumers get from each extra unit of a good.
A fall in the price of a good does two things at once. It makes consumers better off, because their money income now buys more than before; and it makes the good cheaper compared with its alternatives. Each of these changes affects how much consumers buy.
Suppose a student spends $20 a week on lunches at $4 each, buying 5 lunches. If the price falls to $2.50, the same 5 lunches cost only $12.50, leaving $7.50 that can be spent on more lunches or on other things. The student’s money income has not changed, but their real income has risen. For a normal good, higher real income leads to more of the good being bought.
When lunches in the canteen become cheaper, they become better value relative to substitutes such as sandwiches from a nearby café or home-made food. Some consumers switch towards the good that is now relatively cheaper. The substitution effect always works in the opposite direction to the price change: a lower price raises quantity demanded and a higher price reduces it.
Effect of a price fall | What changes | Effect on quantity demanded (normal good) |
|---|---|---|
Income effect | Real income (purchasing power) rises | Rises |
Substitution effect | The good becomes cheaper relative to substitutes | Rises |
Total effect | Both together | Rises: the demand curve slopes downwards |
For a normal good, both effects push quantity demanded in the same direction, so a price fall clearly raises it. A price rise works the other way: real income falls and the good becomes relatively dearer, so both effects reduce the quantity demanded.
For an inferior good, the income effect works in the opposite direction, because higher real income leads consumers to buy less of it. In almost all cases the substitution effect is larger than this opposite income effect, so the demand curve for inferior goods still slopes downwards. Only in an extreme case, the Giffen good, can the income effect outweigh the substitution effect.
 YouTube
Economists call the satisfaction or benefit a consumer gains from consuming a good utility. Utility cannot be observed directly, but it can be described with hypothetical units called “utils” to show how satisfaction changes as consumption rises. Two measures are used: total utility, the total satisfaction from all the units consumed, and the extra satisfaction from the last unit.
The extra satisfaction from one more unit, marginal utility, is the more useful idea, because consumers decide at the margin: whether to buy one more unit, not whether to buy all or nothing. This kind of marginal analysis is used throughout economics.
Experience suggests that marginal utility falls as consumption rises, a pattern known as the law of diminishing marginal utility. The first glass of water after a long run is extremely satisfying; the second is welcome; by the fifth, the extra satisfaction is small. The same pattern holds for slices of pizza, hours of a video game, or visits to the same museum in one month.

The diagram shows the link between the two measures for a hypothetical consumer eating pizza. Marginal utility falls from 10 utils for the first slice to 0 for the sixth. Total utility is the sum of the marginal utilities, so it rises steeply at first, then more slowly, and reaches its maximum of 30 utils when marginal utility is zero. A seventh slice would have negative marginal utility and would reduce total utility.
A consumer will buy one more unit of a good only if the satisfaction it adds is worth at least the price paid. Because marginal utility falls as more units are bought, each extra unit is worth less to the consumer than the one before. The consumer is therefore willing to pay a lower price for each additional unit.
This turns the law of diminishing marginal utility into the law of demand. At a high price, only the first few units, which give high marginal utility, are worth buying. As the price falls, units with lower marginal utility also become worth buying, so the quantity demanded rises. The demand curve can therefore be read as a curve of marginal benefit: its height at any quantity shows how much consumers value the last unit.
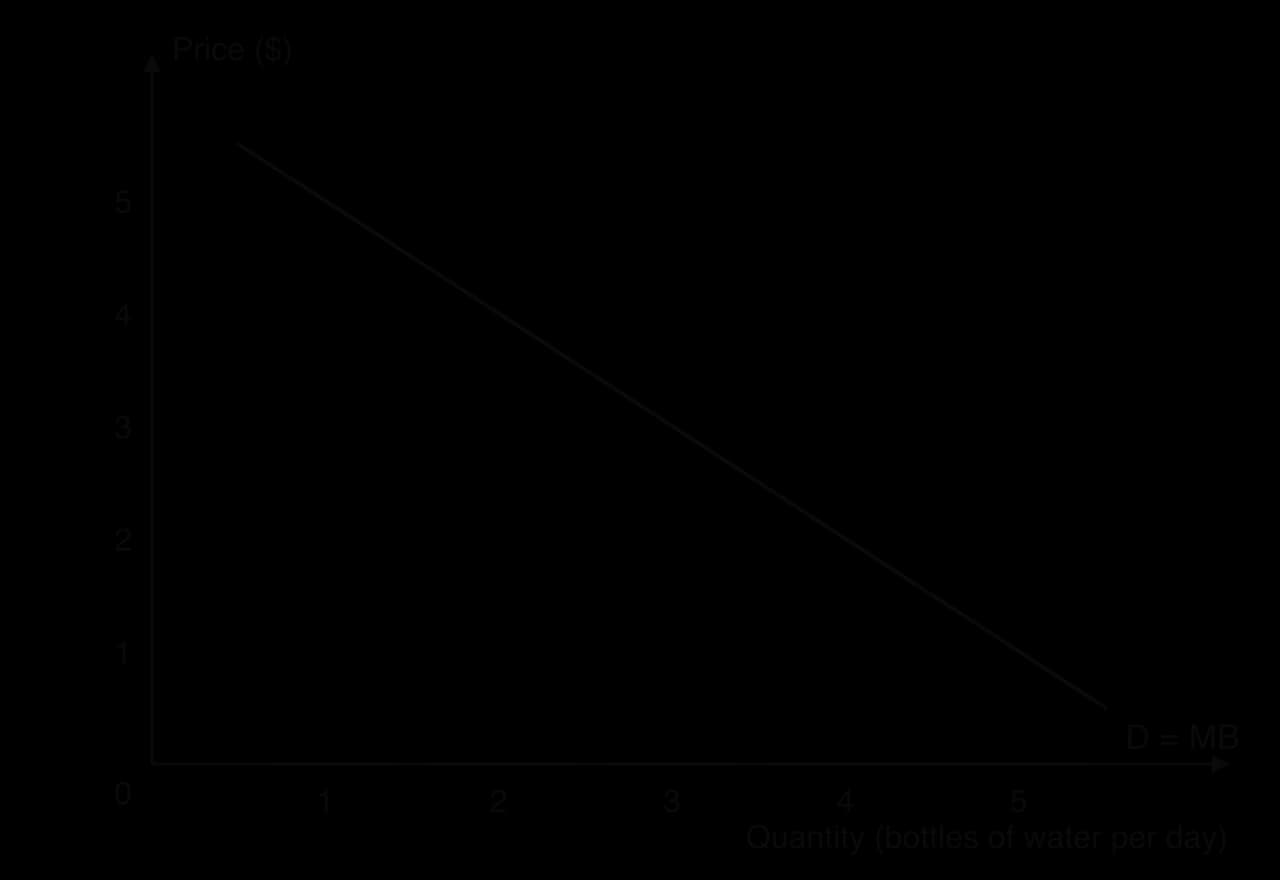
The diagram links the bars of falling marginal utility, measured in dollars of willingness to pay, to a downward-sloping demand curve labelled D = MB. Interpreting demand as marginal benefit becomes central later in the course, when the benefits of consumption are compared with the costs of production to judge whether a market allocates resources efficiently.
Utility theory is a model, and its assumptions can be questioned. Satisfaction cannot be measured in units, and it differs between people, so utils are a teaching device rather than data. The theory also assumes consumers know their own preferences and choose carefully at the margin. Behavioural economics shows that real consumers use rules of thumb, are influenced by how choices are presented and sometimes buy on impulse.
These limits do not overturn the law of demand, which is supported by a great deal of evidence from real markets. They do mean that the law describes how consumers behave on average and in most markets, not a precise rule that every individual follows in every situation.
The price of a good is not the only thing that affects how much of it consumers buy. Many other factors matter too. These are the non-price determinants of demand: when any of them changes, consumers want to buy a different quantity at every price. The whole demand curve then moves.
A rightward shift is called an increase in demand: at each price, consumers want to buy more than before. A leftward shift is a decrease in demand: at each price, they want to buy less. Each determinant shifts the curve in a predictable direction.
For most goods, higher incomes lead consumers to buy more. Rising incomes in a growing economy raise demand for restaurant meals, cars, holidays and new clothes. Goods that behave in this way are called normal goods.
Some goods behave in the opposite way. As incomes rise, consumers switch away from cheaper, lower-quality options to ones they prefer. Demand for long-distance bus travel may fall as people can afford to fly or drive, and demand for the cheapest supermarket own-brand products may fall as households trade up. These are inferior goods.
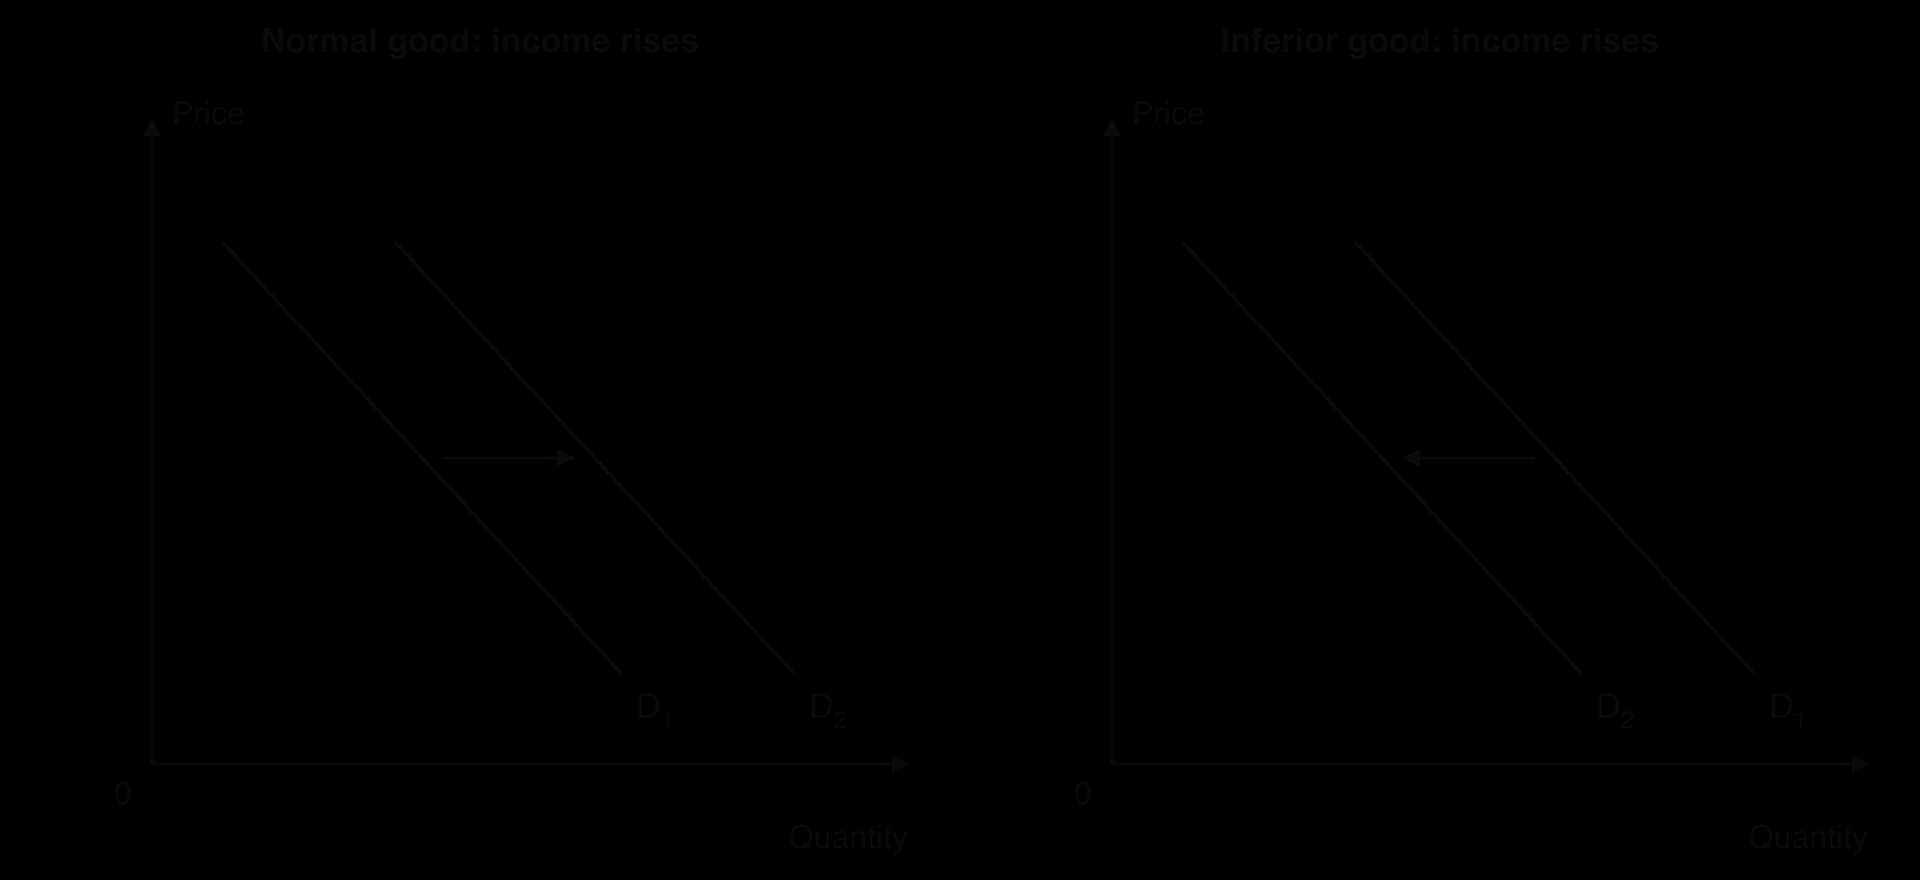
The diagram shows the two cases. In each panel the rise in income is the same; what differs is how consumers respond to it. Whether a good is normal or inferior depends on the consumers and their circumstances rather than on the good itself: the same product can be normal for a low-income household and inferior for a high-income one.
Two recent examples show income at work. In India, rising household incomes have increased demand for motorcycles and scooters, a normal good for millions of families, and later for cars as families move up from two wheels to four. In the United Kingdom during the cost-of-living squeeze of 2022–23, the discount supermarkets Aldi and Lidl gained market share as falling real incomes led many households to switch from more expensive supermarkets: for these shoppers, the discounters behaved like an inferior good.
Consumers’ tastes and preferences change over time, influenced by fashion, advertising, social media, health information and culture. When a good becomes more popular, demand for it increases at every price; when it falls out of favour, demand decreases.
Health information is a powerful influence. Growing awareness of the effects of sugar has reduced demand for sugary soft drinks in many countries, while demand for plant-based milk has grown. The spread of GLP-1 weight-loss medicines such as Ozempic and Wegovy since 2022 has led food companies to expect lower demand for snacks and large portions among users of the drugs, because the medicines reduce appetite.
Firms spend large sums on advertising and branding precisely to shift demand curves to the right. A successful campaign makes consumers want more of a product at the same price, or keep buying it after a price rise.
Consumers decide not only what to buy but when to buy it. If they expect the price of a good to rise soon, they may buy more now, before the rise; if they expect it to fall, they may delay purchases. These future price expectations shift demand.
The panic buying of March 2020, at the start of the COVID-19 pandemic, shows expectations shifting demand. Expecting shortages and higher prices, households in many countries bought far more toilet paper, pasta and tinned food than usual, so shelves emptied even though nothing had changed in their prices. Expectations also matter for housing: when buyers expect house prices to keep rising, demand for houses increases today.
The demand for a good also depends on the prices of other goods that are related to it in consumption. There are two kinds of relationship: substitutes and complements.
When coffee becomes more expensive, some coffee drinkers switch to tea, so demand for tea rises at every price of tea. The closer the substitutes, the stronger this effect: two brands of bottled water are close substitutes, while tea and coffee are less close.
When printers become cheaper, more people buy them and then need ink, so demand for ink cartridges rises. Firms sometimes use this link deliberately, selling printers or games consoles at low prices and earning profit on the complementary ink or games.
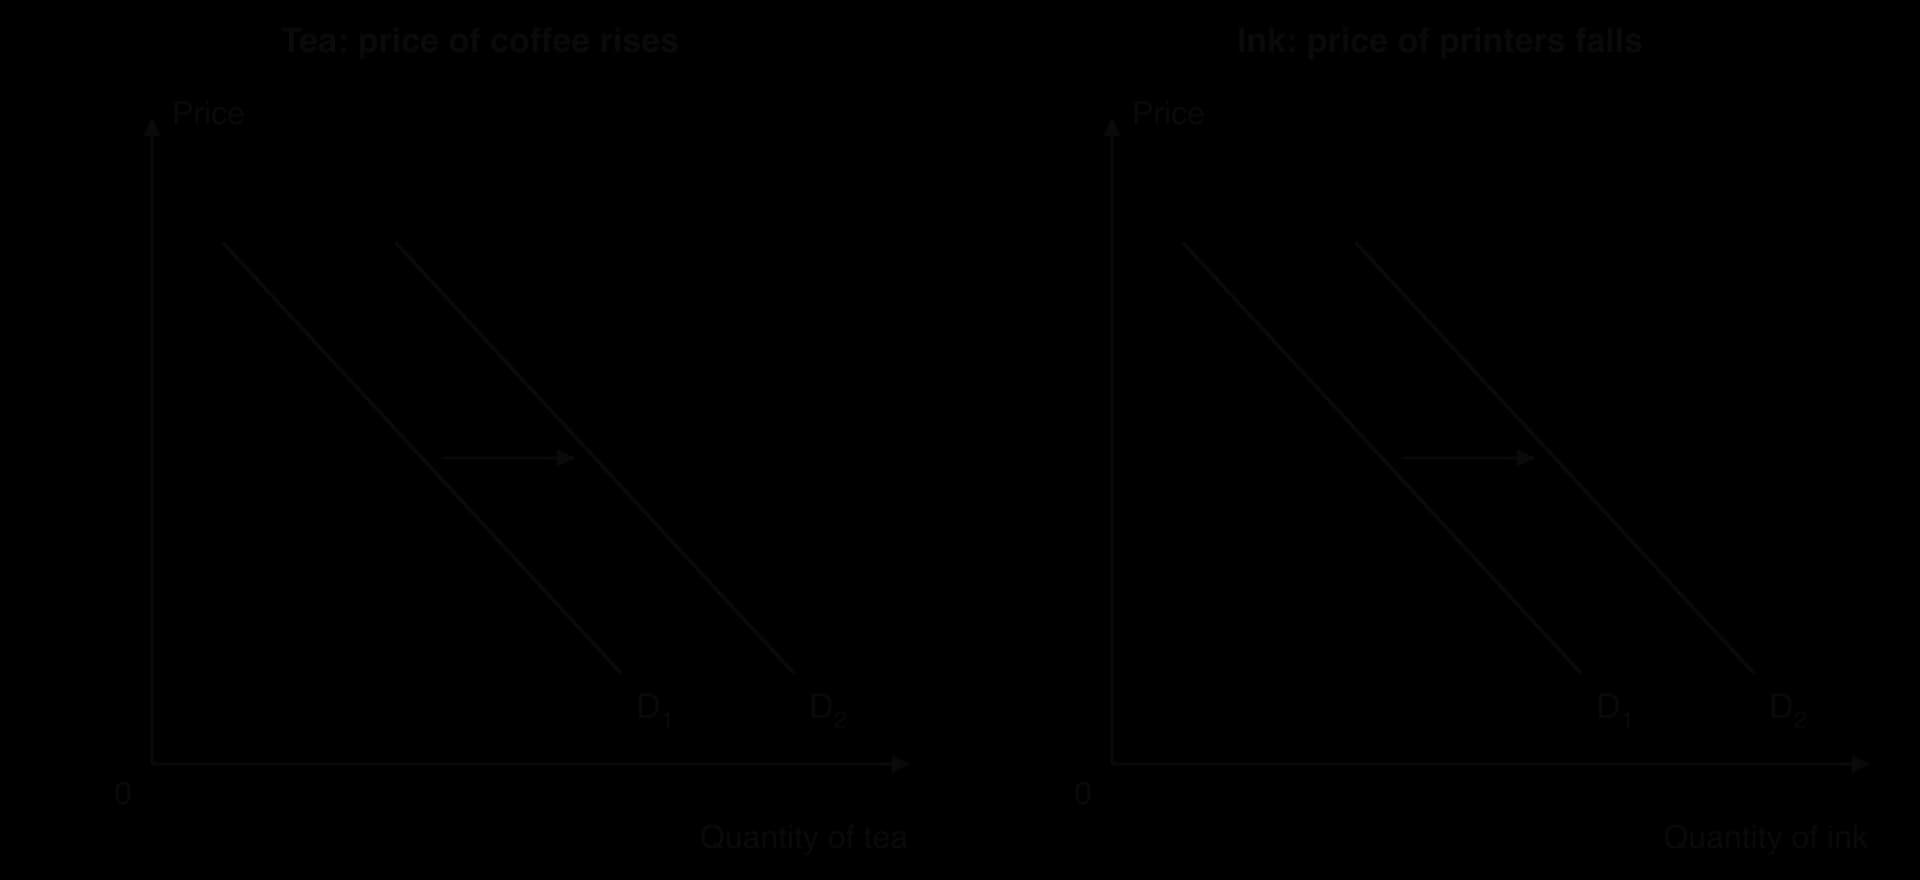
The diagram shows both relationships. In each panel the price of the good itself (tea, ink) has not changed; what has changed is the price of another good, so the result is a shift of demand rather than a movement along it. For unrelated goods, such as tea and car tyres, a change in the price of one has no effect on the demand for the other.
Market demand is the sum of individual demands, so more consumers means more demand. The number of consumers in a market rises with population growth, migration, and the opening of new markets, for example when exports begin to a country that previously did not buy a product. It falls when the population shrinks or a group of consumers leaves the market.
The age structure of the population matters as much as its size. An ageing population increases demand for health care, care homes and retirement housing, and reduces demand for school places, toys and baby products. These demographic changes are slow but powerful, and Japan, where the population is ageing faster than almost anywhere else, shows them clearly.
Non-price determinant | Change | Effect on demand for good X | Shift |
|---|---|---|---|
Income | Income rises (X is a normal good) | Increases | Right |
Income | Income rises (X is an inferior good) | Decreases | Left |
Tastes and preferences | X becomes more fashionable or seen as healthier | Increases | Right |
Future price expectations | Consumers expect the price of X to rise | Increases now | Right |
Price of a substitute | The substitute’s price rises | Increases | Right |
Price of a complement | The complement’s price rises | Decreases | Left |
Number of consumers | More consumers enter the market | Increases | Right |
Other factors can also shift demand in particular markets: the weather (umbrellas, ice cream), the availability of credit (cars, houses), and government policy, such as a campaign that discourages smoking. Each can be analysed in the same way as the determinants in the table.
Every change in buying behaviour can be shown on a demand diagram in one of two ways, and the cause decides which. A change in the good’s own price is shown as a movement along the demand curve. A change in anything else that affects demand is shown as a shift of the demand curve.
A shift is a different kind of change, because the quantity demanded changes even though the price has not.

In the left-hand panel, the price falls from P₁ to P₂ and the quantity demanded rises from Q₁ to Q₂. Consumers are responding to price along their existing demand relationship. In the right-hand panel, the price stays at P₁, yet the quantity demanded changes: it rises to Q₂ if demand increases to D₂, and falls to Q₃ if demand decreases to D₃. Only a non-price cause can change the quantity bought at an unchanged price.
The distinction matters for analysis because a shift of demand changes the market outcome, while a movement along it is the result of a change somewhere else. When demand for a good increases, its price usually rises as a result; that price rise then causes a movement along the supply curve. Mixing up the two leads to circular reasoning, such as claiming that a higher price causes demand to fall, which causes the price to fall again.
The law of demand is one of the most reliable relationships in economics, but it rests on assumptions. Examining where it might fail clarifies what it does and does not claim.
Goods bought for status. For some luxury goods, such as designer handbags or expensive watches, part of the appeal is that they are known to be expensive. A higher price may make them more desirable to some buyers, because owning them signals wealth. Such goods are called Veblen goods, after the economist Thorstein Veblen, who wrote about “conspicuous consumption” in 1899. Even here, at a high enough price most buyers stop buying, so market demand still slopes down over most of its range.
Staple foods for the very poor. A Giffen good is an extreme case of an inferior good. If a very poor household spends most of its income on a staple such as rice, a rise in the price of rice makes it so much poorer that it can no longer afford more expensive foods such as meat. To get enough calories it buys more rice, the cheapest source available. The income effect then outweighs the substitution effect. Field experiments with poor households in Hunan province, China, found evidence of this behaviour for rice, but such cases are rare.
Sources: Veblen, _The Theory of the Leisure Class (1899); Jensen and Miller, American Economic Review (2008)._
Demand theory connects to several of the course’s key concepts. The table summarises the links that matter most.
Key concept | How it applies to demand |
|---|---|
Scarcity and choice | Limited incomes force consumers to choose; the law of demand describes how those choices respond to price. |
Change | Demand curves shift constantly as incomes, tastes, expectations, related prices and populations change. |
Interdependence | The demand for one good depends on the prices of others (substitutes and complements), and market demand depends on many consumers together. |
Economic well-being | Rising incomes increase demand for normal goods that raise living standards; falling real incomes push households towards inferior goods. |
Sustainability | Changing preferences, such as demand for plant-based food or electric vehicles, can reduce environmental damage. |
Japan has one of the oldest populations in the world. In 1990, about 12% of Japanese people were aged 65 or over and 18% were children under 15. By 2025 the shares had swapped places and widened: about 30% were 65 or over and only 11% were under 15. The number of births reached a record low of 758,631 in 2023, 5.1% fewer than the year before, and the total population has been falling since about 2010.
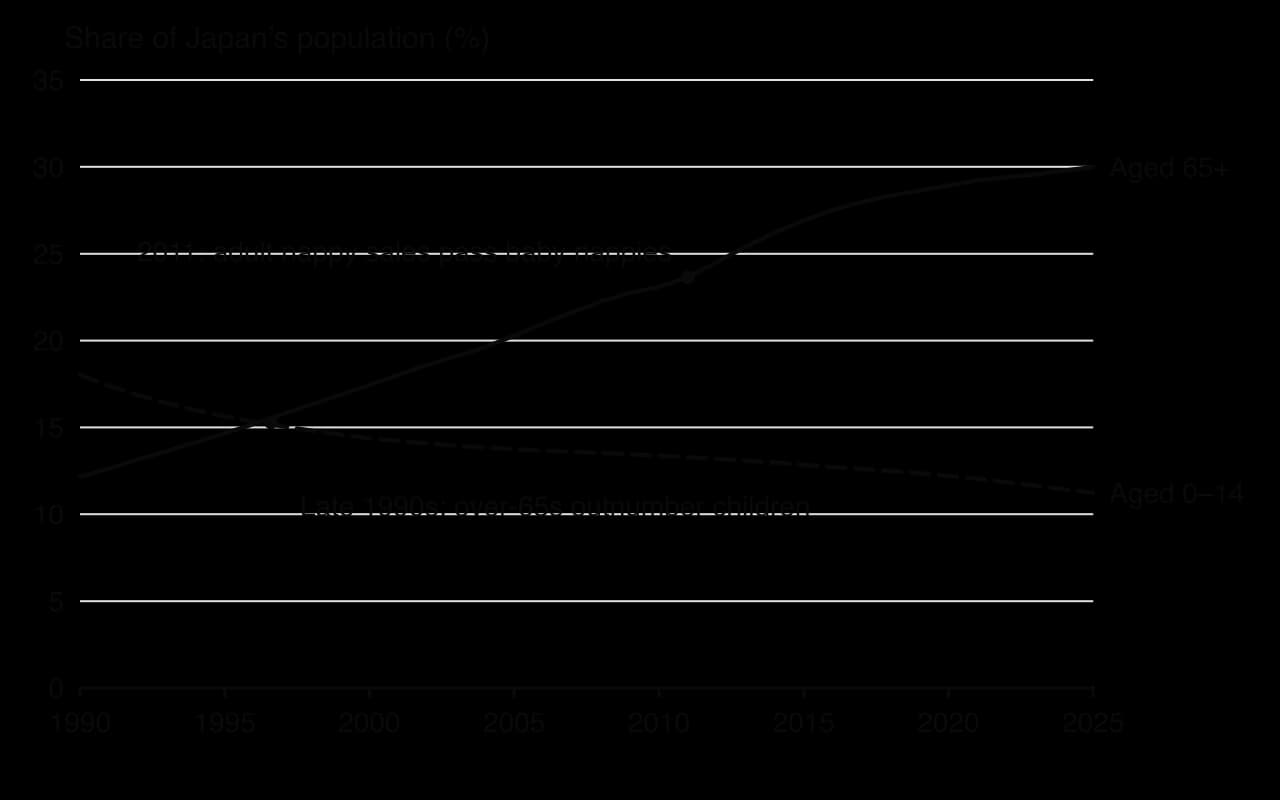
Demand theory treats this as a change in the number and type of consumers, a non-price determinant of demand. More older consumers means more individual demand curves for the goods they buy; fewer children means fewer demand curves for the goods bought for them. The result is a shift of whole market demand curves, at every price, in opposite directions for different goods.
The market for disposable nappies shows this clearly. In Japan, the market for adult nappies is growing while the market for baby nappies shrinks. Oji Holdings, one of the main producers, stopped making baby nappies in Japan in September 2024; its output had fallen from a peak of about 700 million nappies a year in 2001 to 400 million. The company said it would focus on adult nappies instead.
Other producers are moving the same way. Another maker, Daio Paper, earns twice as much revenue from adult nappies as from baby nappies, and the research firm Fuji Keizai forecast in 2024 that Japan’s adult nappy market would grow by 16% over the five years to 2027 while the baby nappy market shrank by 8%.
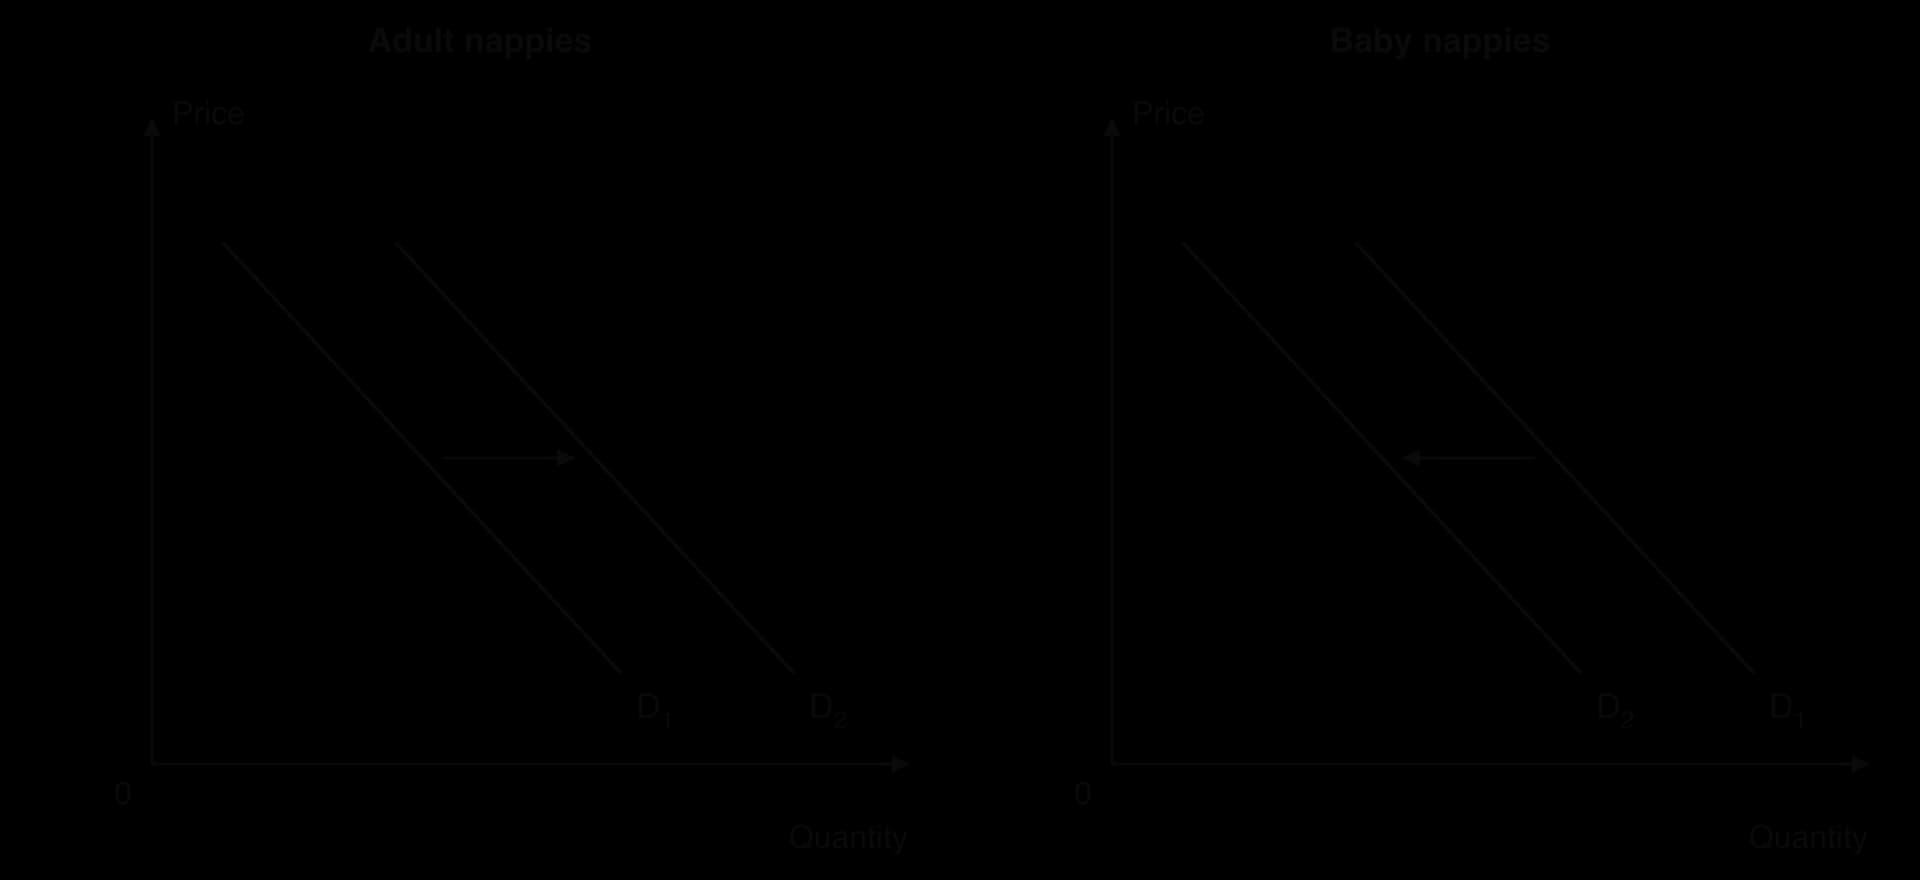
The diagram shows the two shifts. In the adult nappy market, demand increases from D₁ to D₂; in the baby nappy market, it decreases from D₁ to D₂. Neither shift is caused by a change in the price of nappies, so neither is a movement along a curve. Firms respond by moving factors of production, such as factory lines, workers and capital, from the shrinking market to the growing one, which is how changes in demand reallocate scarce resources.
The same logic applies across the economy. Demand for care services, medical equipment, accessible housing and single-portion food has grown, while demand for school places, toys and maternity services has fallen. The case also shows the limits of a simple demand diagram. An ageing population changes more than the number of buyers: older consumers have different incomes (often pensions), different tastes and different expectations, so several determinants shift at once. Demographic change is also slow and predictable, which gives firms years to adjust, unlike sudden shifts such as panic buying.
Sources: World Bank, World Development Indicators (2026); AFP (26 March 2024); Reuters (12 July 2024).
Questions on demand usually test definitions, diagrams and short explanations. In Paper 2, definitions of terms such as normal good, substitutes or market demand are worth 2 marks each, and “Using an appropriate diagram, explain…” questions on a change in demand are worth 4 marks. In Paper 1, demand usually appears inside a wider question on markets, for example as the first step in explaining a change in market equilibrium. HL Paper 3 can ask for the income and substitution effects or diminishing marginal utility to be explained, alongside short calculations that read values from a demand schedule.
Diagrams carry many of the marks in questions on demand, so they need to be complete and used in the explanation.
Short Paper 2-style items for practice:
Define the term inferior good. [2]
Define the term complements. [2]
Using a demand diagram, explain the likely effect of a rise in the price of rail tickets on the demand for long-distance coach travel. [4]
Using a demand diagram, explain how panic buying before an expected shortage affects the demand for bottled water. [4]
A Paper 2 part (g)-style question for practice: “Using information from the text and your knowledge of economics, evaluate the likely effects of an ageing population on firms in Japan [15].” A strong answer uses demand diagrams for growing and shrinking markets, uses figures from the text (shares of over-65s, nappy output), and evaluates: which firms gain and which lose, how quickly resources can be moved between markets, whether exports can replace falling home demand, and the effect of older consumers’ incomes and pensions.
Demand is the quantities consumers are willing and able to buy at each price in a period, ceteris paribus; quantity demanded is the amount at one price.
The law of demand: price and quantity demanded are inversely related, ceteris paribus, so the demand curve slopes downwards.
Market demand is the horizontal sum of individual demands at each price.
HL: the income and substitution effects, and diminishing marginal utility, explain why the demand curve slopes downwards.
Non-price determinants (income, tastes and preferences, future price expectations, prices of substitutes and complements, number of consumers) shift the demand curve.
A change in the good’s own price causes a movement along the curve (a change in quantity demanded); a change in a non-price determinant causes a shift (a change in demand).
I can define demand and state the law of demand, including ceteris paribus.
I can draw and label a demand curve from a demand schedule.
I can find market demand by adding individual demands horizontally.
I can explain how each non-price determinant shifts demand, with a real example.
I can distinguish a normal good from an inferior good, and substitutes from complements.
I can show the difference between a movement along and a shift of the demand curve on a diagram.
I can explain the income and substitution effects of a price change (HL).
I can explain how diminishing marginal utility leads to a downward-sloping demand curve (HL).
Level | Marks | Descriptor |
|---|---|---|
0 | 0 | The work does not reach a standard described by the descriptors below. |
1 | 1–2 | Little understanding of the specific demands of the question. Relevant economic theory is stated but not relevant. Economic terms are stated but not relevant. |
2 | 3–4 | Some understanding of the specific demands of the question. Relevant economic theory is described. Some relevant economic terms are included. |
3 | 5–6 | The specific demands of the question are understood but only partially addressed. Relevant economic theory is partly explained. Some relevant terms are used appropriately. Where appropriate, relevant diagram(s) are included. |
4 | 7–8 | The specific demands of the question are understood and addressed. Relevant economic theory is explained. Relevant terms are used mostly appropriately. Where appropriate, relevant diagram(s) are included and explained. |
5 | 9–10 | The specific demands of the question are understood and addressed. Relevant economic theory is fully explained. Relevant terms are used appropriately throughout. Where appropriate, relevant diagram(s) are included and fully explained. |
Using real-world examples, discuss whether corporate social responsibility (CSR) is consistent with the assumption that firms aim to maximize profits.
15 marks
Answers may include:
Terminology: profit maximization (MC = MR), corporate social responsibility (CSR), alternative business objectives, satisficing, market share, growth, stakeholders, brand loyalty.
Explanation/theory: the classical assumption is that firms choose output where marginal cost equals marginal revenue to maximize profit; CSR (ethical sourcing, environmental standards, community projects) raises costs and may reduce short-run profit, which appears to contradict profit maximization; however, CSR may be a long-run profit-maximizing strategy if it builds reputation and brand loyalty, makes demand less price elastic, attracts and retains workers, avoids regulation and fines, and appeals to investors.
Diagram(s): no diagram is required; candidates may show a firm's demand curve becoming less elastic or shifting right as a result of CSR.
Synthesis/evaluation: whether CSR is genuine or "greenwashing" for marketing; the separation of ownership and control means managers may pursue goals other than profit; some firms are owned by foundations or trusts with explicit social aims; it is difficult to test whether CSR maximizes long-run profit, as other things are not held constant; the answer depends on the time period and the market; a reasoned conclusion.
Examples: Patagonia's transfer of its ownership to a trust and a non-profit organization in 2022 so that profits fund environmental causes; Unilever's Sustainable Living Plan (2010) and later investor pressure over profitability; the Volkswagen emissions scandal (2015), in which claimed environmental credentials hid cost-cutting behaviour; Fairtrade sourcing by chocolate and coffee firms.
A maximum of [9] should be awarded if only arguments that CSR is consistent or only arguments that it is inconsistent with profit maximization are presented.
N.B. Terminology, theory, diagrams and examples given in part (a) and referred to in part (b) should be rewarded.
Examiners should be aware that candidates may take a different approach which, if appropriate, should be rewarded.
Markbands (best fit)
Level | Marks | Descriptor |
|---|---|---|
0 | 0 | The work does not reach a standard described by the descriptors below. |
1 | 1–3 | Little understanding of the specific demands of the question. Theory is stated but not relevant. Terms are not relevant. No synthesis or evaluation. Real-world examples are identified but not relevant. |
2 | 4–6 | Some understanding of the demands. Relevant theory is described. Some relevant terms are included. Synthesis or evaluation is superficial. A relevant real-world example is identified. |
3 | 7–9 | The demands are understood but only partially addressed. Theory is partly explained. Some terms are used appropriately. Relevant diagram(s) are included where appropriate. Synthesis or evaluation is appropriate but lacks balance. Example(s) are identified and partly developed in context. |
4 | 10–12 | The demands are understood and addressed. Theory is explained. Terms are used mostly appropriately. Diagram(s) are included and explained. Synthesis or evaluation is appropriate and mostly balanced. Example(s) are identified and developed in the context of the question. |
5 | 13–15 | The demands are understood and addressed. Theory is fully explained. Terms are used appropriately throughout. Diagram(s) are included and fully explained. Synthesis or evaluation is effective and balanced. Example(s) are identified and fully developed to support the argument. |
The agriculture ministry of Nolvenia predicts that a 10 % rise in the retail price of rice will reduce the quantity of rice demanded by 3 %, ceteris paribus.
Define the term ceteris paribus indicated in bold.
2 marks
In 2024 frost destroyed part of Country X's coffee harvest. Over the same period, rising incomes in Country X's main export markets increased demand for its coffee. The price of coffee rose by 40 % while the quantity traded was almost unchanged. A newspaper headline claimed that "the frost raised coffee prices by 40 %".
Using a demand and supply diagram, explain why economists would use the ceteris paribus assumption to identify the effect of the frost on the market for coffee.
4 marks