Explain how central banks use interest rates and the money supply to manage aggregate demand, draw the AD/AS and money market diagrams, calculate real interest rates and evaluate how effective monetary policy is.
Each is in the Economics glossary, with every other term in the subject.
The cash that commercial banks hold and the deposits they keep at the central bank, which they use to settle payments with each other and to meet withdrawals.
The institution that manages a country’s (or currency area’s) money supply and interest rates, issues its currency, acts as banker to the government and to commercial banks, and conducts monetary policy.
The situation where a central bank sets monetary policy free from day-to-day control by the government, so that decisions are not driven by short-term political goals.
The interest rate at which the central bank lends to commercial banks, which sets the level of short-term interest rates in the economy; also called the base rate, policy rate, discount rate or refinancing rate.
A private financial institution that accepts deposits from households and firms and makes loans to them, earning profit from the difference between the interest it charges and the interest it pays.
Monetary policy that raises interest rates or reduces the money supply to lower aggregate demand, used to close an inflationary gap and reduce inflation.
The quantity of money (cash and bank deposits) that households and firms wish to hold at each interest rate; it is higher at lower interest rates because the opportunity cost of holding money is lower.
Define monetary policy and describe the roles of the central bank and commercial banks.
Explain the goals of monetary policy, including inflation targeting.
Explain how a change in interest rates affects aggregate demand through the monetary transmission mechanism.
Distinguish between real and nominal interest rates, and calculate the real interest rate from data.
Draw AD/AS diagrams to explain how expansionary and contractionary monetary policy close deflationary and inflationary gaps.
Explain how commercial banks create money, and calculate the effect of a new deposit with a given reserve requirement (HL).
Explain the tools of monetary policy: open market operations, minimum reserve requirements, the minimum lending rate and quantitative easing (HL).
Draw a money market diagram and use it to explain how the equilibrium interest rate is determined (HL).
Evaluate the effectiveness of monetary policy in achieving growth, low unemployment and low and stable inflation.
Monetary policy is the use of interest rates and the supply of money by a country’s central bank to influence the total level of spending in the economy. It is the main way most governments keep inflation low and stable, and in recessions it is often the first policy used to support output and jobs, as when central banks around the world cut interest rates close to zero in March 2020.
Monetary policy is one of the two demand-side policies, together with fiscal policy. Both are a form of intervention in the macroeconomy, and both work by shifting aggregate demand (AD). Because interest rates change the reward for saving and the cost of borrowing, monetary policy also shifts income between savers and borrowers, which raises questions of
147 exam-style questions on this subtopic, written in the style of the IB papers. The first has its markscheme open. Counted on
Inflation in an economy has risen to 7%, well above the central bank’s target of 2%.
Explain how a central bank can use contractionary monetary policy to reduce inflation.
10 marks
Responses may include:
an accurate AD/AS diagram showing AD shifting left
higher interest rates raising the cost of borrowing
lower consumption and investment, reducing AD
a stronger currency reducing net exports
Level 4 (9–10 marks): a clear explanation with a fully labelled diagram.
Using real-world examples, evaluate the effectiveness of monetary policy in reducing inflation.
15 marks
Evaluation may consider:
time lags between a rate change and its effect
whether inflation is demand-pull or cost-push
the effect on growth and unemployment
the credibility and independence of the central bank
Level 5 (13–15 marks): balanced evaluation supported by relevant real-world examples.
One of 56 short multiple-choice questions on 3.5. Pick an answer to see why it's right or wrong.
To bring inflation down, what would a central bank usually do?
The official deck for this part of the syllabus.
State the two demand-side policies.
Explain why monetary policy is an equity issue as well as a stability issue.
With a free account, Augment remembers where you stopped and what you have practiced.
The interest rate at which the quantity of money demanded equals the money supply set by the central bank, shown where the money demand and money supply curves intersect.
Monetary policy that lowers interest rates or increases the money supply to raise aggregate demand, used to close a deflationary gap and reduce unemployment.
Communication by a central bank about the likely future path of its policy rate, used to shape expectations and longer-term interest rates.
A financial asset issued by a government to borrow money, which pays the holder interest and repays the amount borrowed on a set date.
A monetary policy framework in which the central bank publicly commits to keeping inflation at, or within a range around, a stated rate, usually about 2% a year, over the medium term.
The minimum proportion of deposits that commercial banks must legally hold as reserves (cash or deposits at the central bank) rather than lend out.
A demand-side policy in which the central bank changes interest rates, the money supply or credit conditions to influence aggregate demand and reach goals such as low and stable inflation.
The chain of effects by which a change in the central bank’s policy rate spreads through other interest rates, asset prices, the exchange rate and expectations to aggregate demand, output and inflation.
Anything generally accepted as payment for goods and services; it serves as a medium of exchange, a unit of account, a store of value and a standard of deferred payment.
The process by which commercial banks increase the money supply by making loans, since each new loan creates a new deposit; also called credit creation.
The maximum increase in total bank deposits that can result from an initial new deposit, equal to one divided by the reserve requirement ratio.
The total quantity of money in an economy at a point in time, made up of notes and coins held by the public plus deposits in commercial banks.
The interest rate expressed in money terms, as quoted by a bank or lender, with no adjustment for inflation.
The buying and selling of government bonds by the central bank in the open market to change the reserves of commercial banks, the money supply and short-term interest rates.
An expansionary monetary policy in which the central bank creates new reserves to buy large quantities of financial assets, mainly government bonds, to lower long-term interest rates and raise the money supply.
The reversal of quantitative easing, in which the central bank reduces its holdings of bonds by selling them or not replacing them when they mature, shrinking bank reserves.
The nominal interest rate adjusted for inflation, approximately the nominal interest rate minus the rate of inflation; it measures the true cost of borrowing and the true return to saving.
The situation where the central bank’s policy rate is at or close to zero, so it has little or no room to cut interest rates further to stimulate aggregate demand.
To understand monetary policy, three ideas are needed first: what money is, which institutions create it, and what an interest rate measures.
Money is anything that people generally accept as payment. It acts as a medium of exchange (it is used to buy goods and services), a unit of account (prices are measured in it), a store of value (it can be kept and spent later) and a standard of deferred payment (debts are written in it).
Most money today is not notes and coins. It is the balance in bank accounts, which people spend by card or transfer. The total quantity of this money in the economy is the money supply.
An interest rate is the price of borrowing money, or the reward for lending it, expressed as a percentage of the amount borrowed per year. A household that borrows $10,000 at 6% a year pays $600 a year in interest. A saver who deposits $10,000 at 4% a year earns $400.
Two kinds of bank matter for monetary policy. Commercial banks are the private banks that households and firms use every day: they take deposits, make loans and earn a profit on the difference between the interest rate they charge borrowers and the rate they pay savers. The central bank stands above them.
Examples are the Federal Reserve (the Fed) in the United States, the Bank of England, the European Central Bank (ECB), which sets policy for all the countries that use the euro, the People’s Bank of China and the Central Bank of the Republic of Türkiye. Each one does the same core jobs.
Function of the central bank | What it means |
|---|---|
Conducts monetary policy | Sets the main interest rate and influences the money supply to reach its goals, usually low and stable inflation. |
Issues the currency | Has the sole right to issue banknotes in the country or currency area. |
Banker to the government | Holds the government’s accounts and helps it manage its borrowing. |
Banker to the commercial banks | Holds the reserves that commercial banks keep with it and lends to them, including in an emergency as “lender of last resort”. |
Supervises the financial system | Regulates banks (in many countries) so that they hold enough capital and do not take excessive risks. |
The central bank does not lend to households or firms directly. It acts on the commercial banks, which then pass the change on to their customers. When the central bank raises the rate at which it lends to commercial banks, their own cost of funds rises, so they raise the rates they charge on mortgages, car loans and business loans and usually offer savers more.
In most economies the main instrument of monetary policy is a single short-term interest rate set by the central bank: the central bank minimum lending rate, usually called the policy rate or base rate. Different central banks use different names for it (Bank Rate in the UK, the federal funds rate target in the US, the one-week repo rate in Türkiye), but its role is the same. It sets the floor for the whole structure of interest rates in the economy.
The central bank can also act on the quantity of money directly, by buying or selling bonds or by changing the share of deposits banks must hold as reserves. Whatever the tool, the central bank makes borrowing cheaper or dearer, and money more or less plentiful, and this changes spending.
In most high-income and many middle-income economies, the central bank sets interest rates independently of the government. The government sets the goal (in the UK the 2% inflation target is set by the government) and the central bank decides how to reach it. In the UK the decision is taken by a nine-member Monetary Policy Committee.
The reason for independence is credibility. A government facing an election has an incentive to cut interest rates to boost spending and jobs, even if this raises inflation later. If firms and workers believe that the central bank will not give in to this pressure, they expect inflation to stay low and set prices and wages accordingly, which itself helps to keep inflation low. Türkiye between 2021 and 2023, when the central bank cut rates under political pressure while inflation soared, shows what can happen when that belief is lost.
Central banks pursue several macroeconomic goals at once. Most give priority to price stability, but low unemployment, a smoother business cycle, conditions for long-term growth and external balance all matter too.
The main goal of almost every central bank is low and stable inflation. High inflation reduces the purchasing power of money, redistributes income from savers and people on fixed incomes to borrowers, and makes it harder for firms to plan. Unstable inflation adds uncertainty, which discourages investment. Deflation, a sustained fall in the price level, is also harmful, because consumers may delay spending and the real value of debts rises.
Most central banks therefore aim for inflation that is low but positive, typically around 2% a year. A small positive rate leaves room to cut real interest rates below zero in a recession, gives a margin against falling into deflation, and allows for the tendency of price indices to slightly overstate true inflation.
New Zealand was the first country to adopt inflation targeting, in 1990, with a target range of 0–2%. By 2024, 45 countries and the euro area had adopted it. The US Federal Reserve announced a formal 2% target in January 2012. Its legal mandate, set by Congress, is a dual one: maximum employment and stable prices.
An inflation target gives the central bank a clear, measurable goal and makes it accountable for meeting it. When inflation moves away from the target, the central bank raises or lowers its policy rate to bring it back. Because the policy rate takes time to work, the central bank looks ahead and responds to its forecast of inflation in one to two years, not only to today’s rate.
Sources: Inflation targeting, Wikipedia (2024), citing the Reserve Bank of New Zealand Act 1989; Federal Reserve Board, FAQ on monetary policy goals (2025); Bank of England, Monetary policy (2026).
A second goal is low unemployment, in particular low cyclical (demand-deficient) unemployment. When AD is weak, firms produce less and need fewer workers. Lower interest rates raise spending, so firms produce more and hire more workers. Monetary policy cannot permanently push unemployment below its natural rate, however: structural unemployment and frictional unemployment are caused by mismatches in the labour market, not by too little spending.
The business cycle is the pattern of expansions and contractions in real GDP around its long-term trend. By cutting interest rates in a downturn and raising them in a boom, the central bank tries to “lean against the wind” and keep output closer to its potential. A smoother cycle means fewer workers lose their jobs in recessions and inflation is less likely to build up in booms.
Firms invest in new factories, machines and research only when they can plan years ahead. Low and stable inflation, predictable interest rates and a stable financial system make such plans easier. In this way monetary policy supports long-term economic growth indirectly, even though it cannot shift the LRAS curve itself.
Interest rates also affect the exchange rate and therefore the current account of the balance of payments. Higher rates attract financial inflows from abroad (often called hot money), which raise the demand for the currency and cause it to appreciate. Lower rates have the opposite effect. Some central banks, especially in small open economies or those with fixed or managed exchange rates, use interest rates to keep the exchange rate stable or to avoid a large current account deficit.
Goal | How monetary policy helps | Example of a possible conflict |
|---|---|---|
Low and stable inflation | Higher rates reduce AD and demand-pull inflation; a credible target anchors expectations. | Raising rates to fight inflation can increase unemployment in the short run. |
Low unemployment | Lower rates raise AD, output and demand for labour. | Cutting rates when the economy is near full employment adds to inflation. |
Reducing business cycle fluctuations | Rates move against the cycle: up in booms, down in downturns. | Time lags mean a policy can take effect after the economy has already turned. |
A stable environment for long-term growth | Predictable prices and rates encourage investment. | Very low rates for many years can encourage excessive borrowing and asset price bubbles. |
External balance | Rates influence the exchange rate and the current account. | Raising rates to defend the currency can push a weak economy into recession. |
These goals do not always point the same way. After a supply shock that raises costs, such as a jump in oil prices, inflation rises while output falls. The central bank must then choose between raising rates to fight inflation, which deepens the fall in output, and keeping rates low to support output, which risks letting inflation become entrenched. This is the policy dilemma of stagflation.
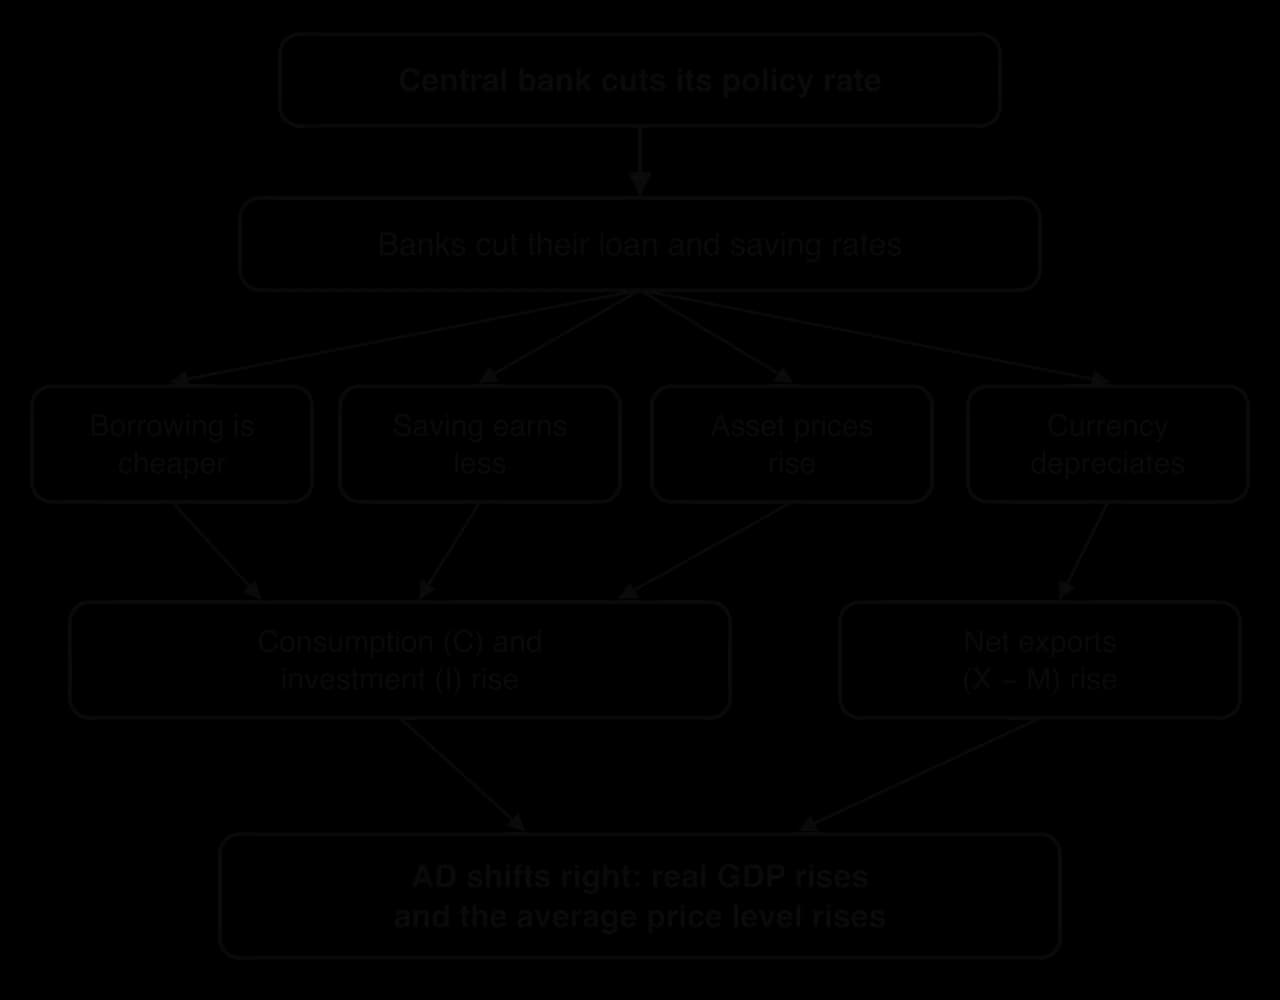
A change in the policy rate does not affect output and prices directly. It works through a chain of effects on other interest rates, on spending and on the exchange rate, known as the monetary transmission mechanism.
The flow chart traces the effects of a cut in the policy rate. Commercial banks lower the interest rates they charge and pay, and four channels then raise spending:
Borrowing becomes cheaper. Households borrow more to buy cars and houses, and firms borrow more to finance investment in capital goods. Lower mortgage rates also leave households with mortgages more disposable income to spend, so consumption rises.
Saving becomes less rewarding. With a lower return on deposits, households save a smaller share of their income and spend more of it.
Asset prices rise. Lower rates make bonds, shares and houses more attractive relative to bank deposits, so their prices rise. Households that own these assets feel wealthier and spend more (a wealth effect).
The currency depreciates. Lower rates reduce the return on holding the currency, so financial capital flows abroad and the exchange rate falls. Exports become cheaper for foreign buyers and imports dearer, so net exports rise.
Each channel raises a component of AD = C + I + G + (X − M). A rise in the policy rate works in reverse: borrowing becomes dearer, saving more attractive, asset prices fall and the currency appreciates, so consumption, investment and net exports all fall.
Expectations matter too. If households and firms believe that the central bank will keep rates low for a long time, they are more confident and spend more today. Central banks increasingly use forward guidance, statements about the likely future path of rates, to strengthen this effect.
 YouTube
The interest rate that a bank quotes is the nominal interest rate. It says how many extra units of money a borrower pays back. What matters for decisions, however, is what that money can buy, because inflation reduces the purchasing power of the money that is repaid.
Adjusting the nominal rate for inflation gives the real rate.
A saver who earns 5% interest when prices rise by 3% can buy only about 2% more goods with the money a year later: the real interest rate is about 2%. If inflation is 7%, the same 5% nominal rate gives a real rate of about −2%. The saver ends the year with more money but less purchasing power, and the borrower repays less, in real terms, than was borrowed.
This is why real rates, not nominal rates, drive spending. A nominal rate of 10% sounds high, but if inflation is 12% the real rate is −2%, and borrowing to buy goods or assets that rise in price with inflation is very attractive. Monetary policy is only contractionary if it raises the real interest rate enough to discourage spending.
Real rates matter in practice. In June 2022 the effective US federal funds rate was 1.21% while consumer prices were 9.0% higher than a year earlier, a real policy rate of about −7.8%. By August 2023 the Fed had raised the rate to 5.33%, and with inflation down to 3.7% the real rate was about +1.6%. The real rate, not the size of the nominal increase, shows how much the Fed had tightened.
Sources: Federal Reserve Bank of St Louis, FRED series FEDFUNDS and CPIAUCSL (2026).
The exact relationship is (1 + nominal rate) = (1 + real rate) × (1 + inflation rate). For low rates the approximation real ≈ nominal − inflation is very close: with a 5% nominal rate and 3% inflation, the exact real rate is 1.05 ÷ 1.03 − 1 = 1.94%, against 2% from the shortcut.
At very high inflation the shortcut is less accurate. In Türkiye in October 2022 the policy rate was 10.5% and inflation 85.5%. The shortcut gives −75%, while the exact formula gives 1.105 ÷ 1.855 − 1 = −40.4%. Both show an extremely negative real rate. The shortcut is the method normally used in calculations.
Monetary policy moves in one of two directions. When the economy is producing below its potential, the central bank loosens policy to raise AD. When the economy is overheating and inflation is rising, it tightens policy to reduce AD.
The opposite policy is used when spending is growing too fast for the economy’s capacity.
A deflationary gap (also called a recessionary gap) exists when equilibrium real GDP is below the full employment level of output, Yf. Resources, including labour, are unemployed, so cyclical unemployment is high and inflation is low or falling.
Expansionary monetary policy closes the gap by shifting AD to the right. In the left-hand diagram, AD₁ meets the short-run aggregate supply (SRAS) curve at Y₁, below Yf. The central bank cuts its policy rate, which raises consumption, investment and net exports through the transmission mechanism. AD shifts to AD₂, and the new equilibrium is at Yf on the long-run aggregate supply (LRAS) curve. Real GDP rises from Y₁ to Yf, cyclical unemployment falls and the average price level rises from P₁ to P₂.
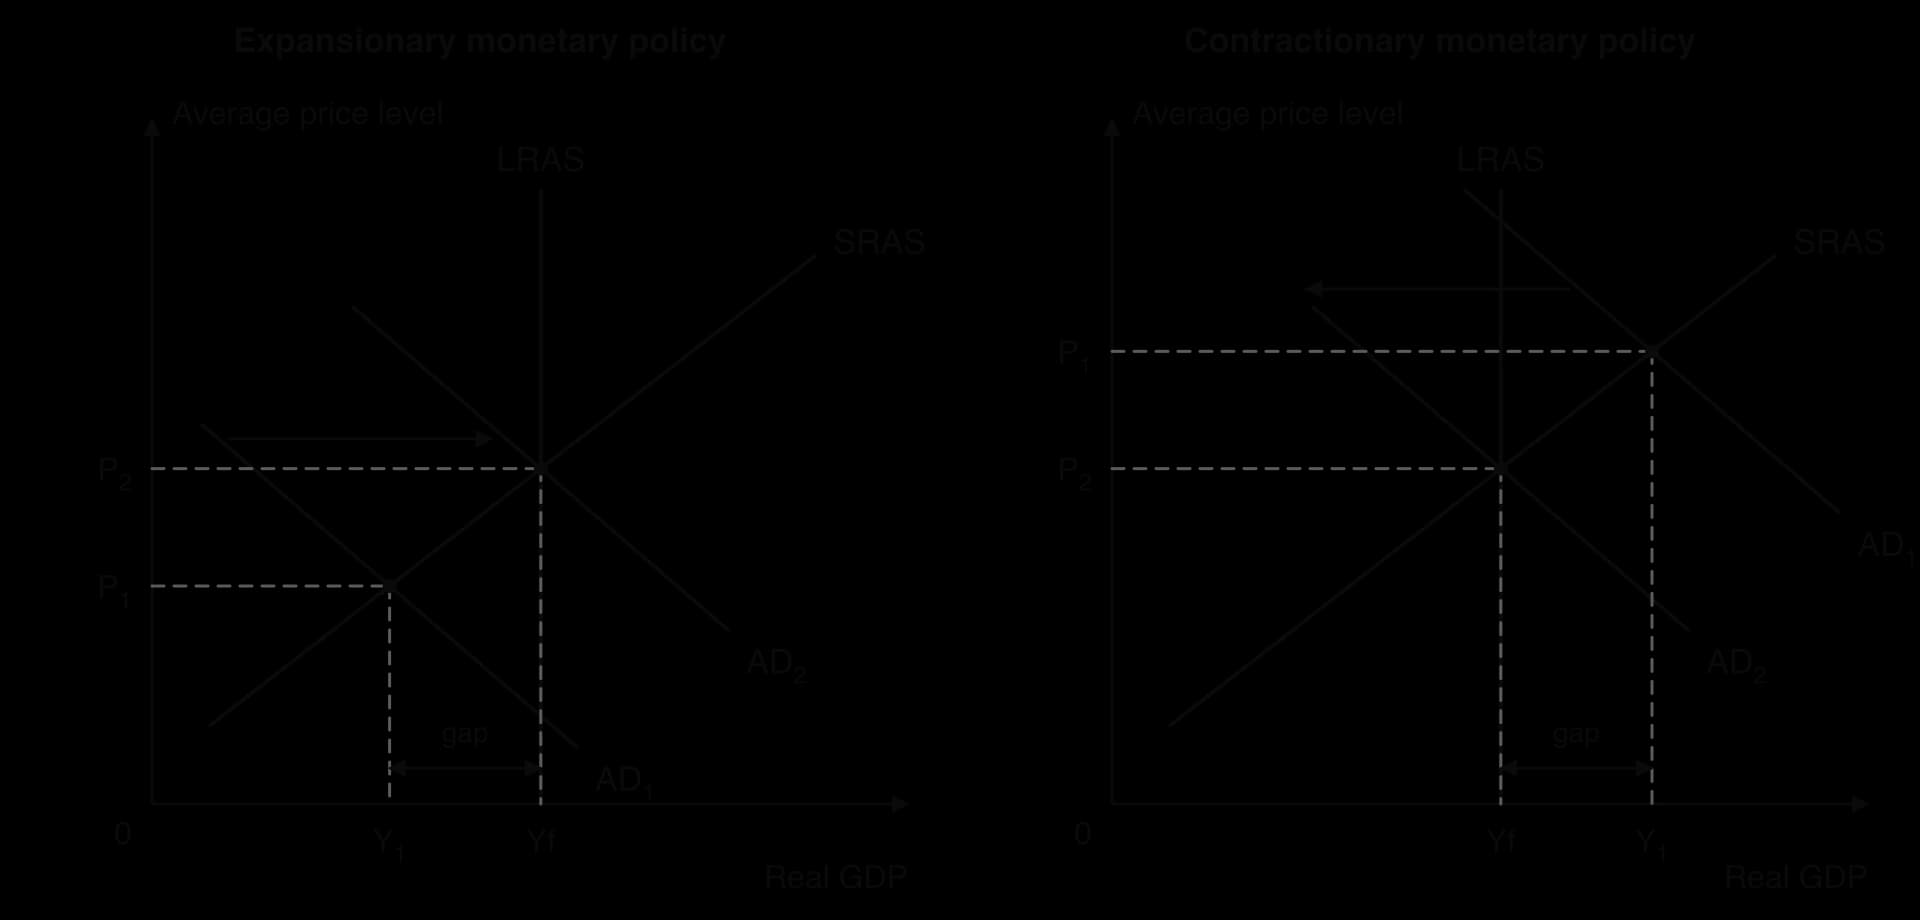
An inflationary gap exists when equilibrium real GDP is above Yf. Firms are producing beyond their normal capacity, unemployment is below its natural rate, and the shortage of labour and other resources pushes up wages and prices: demand-pull inflation.
Contractionary monetary policy shifts AD to the left. In the right-hand diagram, AD₁ meets SRAS at Y₁, above Yf, at price level P₁. The central bank raises its policy rate; borrowing becomes dearer, saving more attractive, asset prices fall and the currency appreciates. Consumption, investment and net exports fall, AD shifts to AD₂ and the economy returns to Yf. The price level falls from P₁ to P₂, or in practice inflation slows, since in a growing economy AD and LRAS are both shifting to the right over time.
The effect of expansionary policy depends on how much spare capacity there is. With the Keynesian AS curve, the AS curve is flat when there is a lot of spare capacity, rises as the economy approaches full employment and becomes vertical at Yf.
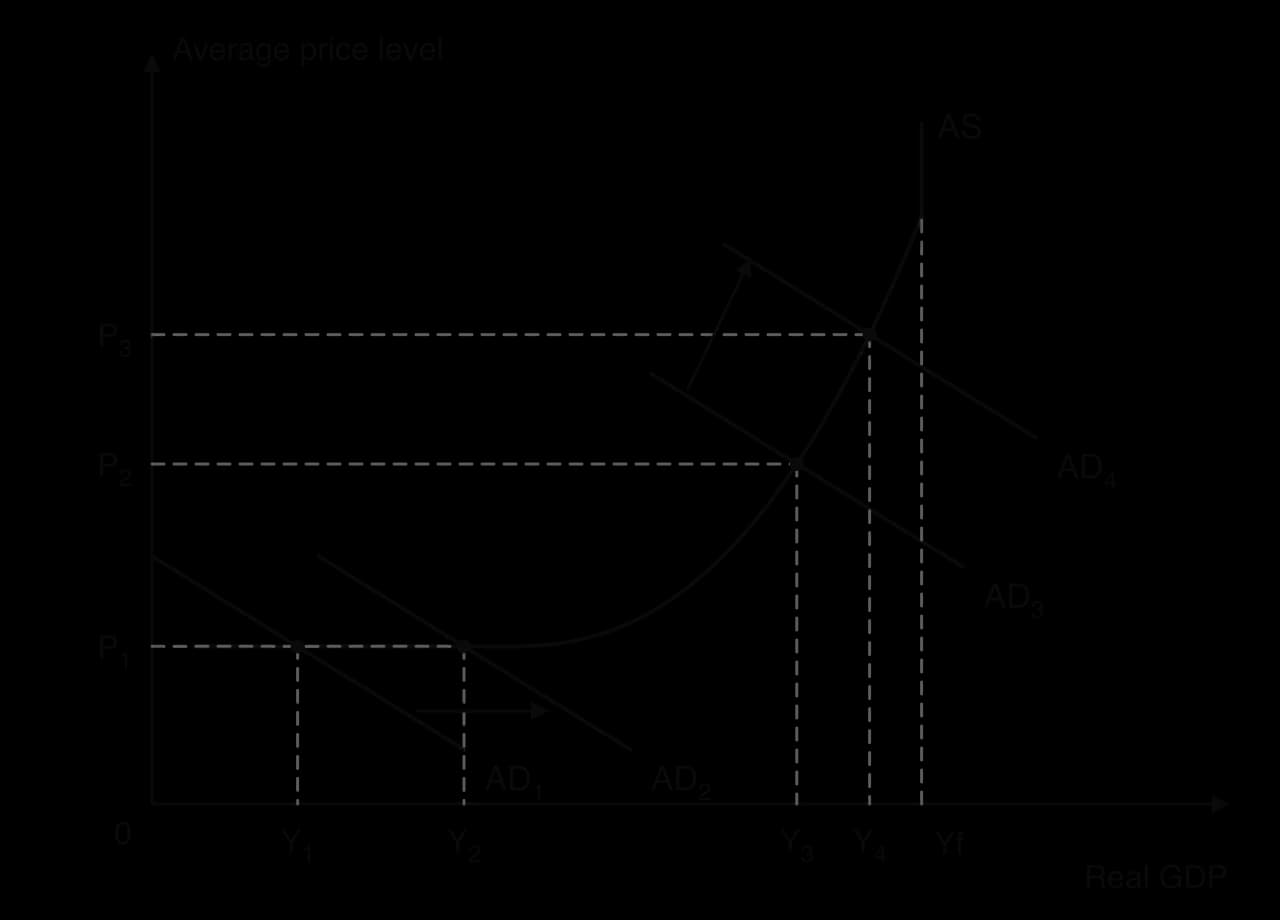
In a deep recession, a rise in AD from AD₁ to AD₂ raises real GDP with no increase in the price level, because idle resources can be brought back into use without bidding up their prices. Close to full employment, a similar rise in AD from AD₃ to AD₄ mostly raises prices. Expansionary monetary policy is therefore most effective, and least inflationary, when the deflationary gap is large, but a deep recession is also when households and firms may be least willing to borrow.
In practice, central banks moved together in both directions within three years. In March 2020, as COVID-19 lockdowns began, the Bank of England cut Bank Rate to 0.1% and the Fed cut its rate to close to zero. As inflation rose in 2021–22, they reversed course: the Fed raised its effective rate from 0.08% in February 2022 to 5.33% by August 2023, and the Bank of England raised Bank Rate from 0.1% in December 2021 to 5.25% in August 2023.
Sources: Bank of England, Bank Rate history (2026); Federal Reserve Bank of St Louis, FRED series FEDFUNDS (2026).
Most of the money supply consists of bank deposits, and most of those deposits are created by commercial banks when they lend. When a bank grants a loan, it does not hand over cash from a vault. It adds the amount to the borrower’s account, and that new deposit is new money that did not exist before.
Banks know that on any given day only a small share of depositors will withdraw their money. They therefore keep only a fraction of their deposits as bank reserves (cash, and deposits at the central bank) and lend out the rest. This is called fractional reserve banking. In many countries the central bank sets a minimum reserve requirement, the smallest share of deposits that banks must hold as reserves.
The money created by one loan does not stay in one bank. The borrower spends it, the seller deposits it in another bank, and that bank can lend most of it again. The process continues in rounds, each smaller than the last.
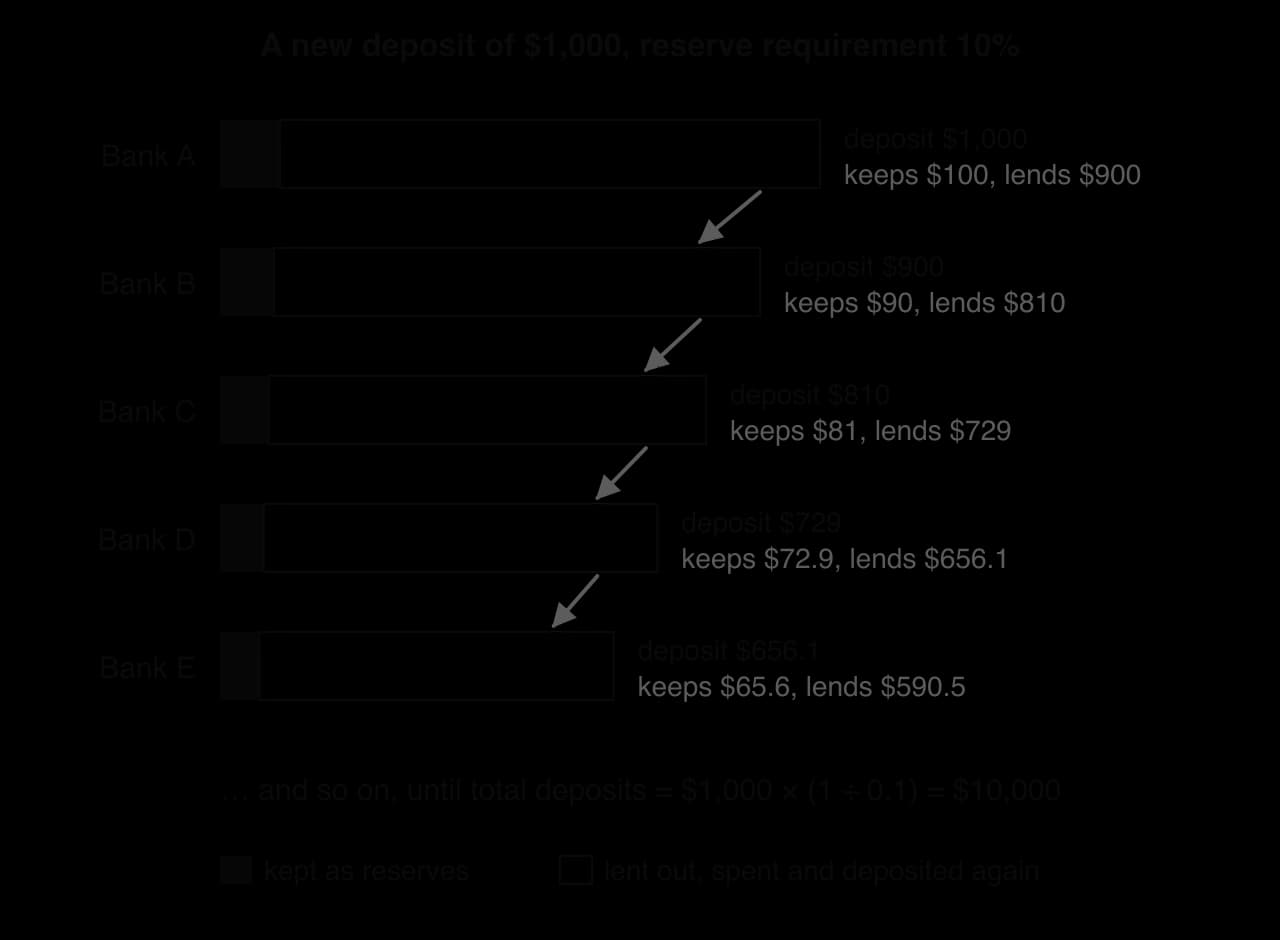
The diagram follows a new deposit of $1,000 in a system with a reserve requirement of 10%. Bank A keeps $100 and lends $900; the $900 is spent and deposited in Bank B, which keeps $90 and lends $810; and so on. Adding up all the rounds gives a limit to the total deposits that can be created, set by the money multiplier.
The formula shows why a change in the reserve requirement affects the money supply. If the requirement falls from 10% to 5%, the money multiplier rises from 10 to 20, and the same reserves can support twice as many deposits.
The money multiplier gives a maximum, which is rarely reached. Banks may hold more reserves than required for safety, especially in a crisis. Some money is held as cash outside the banking system and is not redeposited. Most importantly, loans are made only if households and firms want to borrow and banks judge them creditworthy. Regulations on how much capital banks must hold also limit lending.
Central banks today stress this last point. In 2014 the Bank of England explained that banks do not simply lend out existing deposits or “multiply up” central bank money: they create deposits when they decide to lend, and the amount they create depends ultimately on the central bank’s interest rate policy, which affects the demand for loans. The simple money multiplier is therefore best seen as a model of the upper limit on money creation, not as a description of how much lending actually happens.
Sources: Bank of England, “Money creation in the modern economy”, Quarterly Bulletin 2014 Q1.
 YouTube
A central bank has four main tools. In normal times the first and second work together to set short-term interest rates; the reserve requirement is used more in some countries than others; and quantitative easing was developed for times when interest rates could not be cut any further.
Commercial banks borrow from the central bank, overnight or for short periods, when they are short of reserves. If the central bank raises the rate it charges, borrowing reserves becomes more expensive, so banks raise the rates they charge each other and their customers. A cut has the opposite effect. Changes in this rate are announced at regular scheduled meetings and are the most visible tool of monetary policy.
A government bond is a financial asset issued by a government when it borrows. It pays interest and is repaid on a set date. Banks and other investors buy and sell bonds in the bond market. Open market operations use this market to change the quantity of reserves in the banking system.
Central bank buys bonds (expansionary) | Central bank sells bonds (contractionary) | |
|---|---|---|
What happens | Pays banks and investors with newly created reserves | Receives payment from banks, so reserves are withdrawn |
Bank reserves | Rise | Fall |
Banks’ ability to lend | Increases; money supply rises | Decreases; money supply falls |
Bond prices and yields | Bond prices rise, so interest rates (yields) fall | Bond prices fall, so interest rates (yields) rise |
Effect on AD | Increases | Decreases |
Open market operations are how central banks keep market interest rates close to their chosen policy rate. If the overnight rate between banks drifts above the target, the central bank buys bonds to add reserves; if it drifts below, it sells bonds to absorb them.
Lowering the requirement frees reserves for lending and raises the money multiplier, so the money supply can grow and interest rates fall. Raising it does the opposite. The People’s Bank of China uses this tool actively: it raised its requirement ten times in 2007 alone to restrain inflation, and in May 2025 it cut the requirement by 0.5 percentage points for most banks, a move it expected to add about 1 trillion yuan of long-term funds to the banking system.
Many other central banks rarely use the tool, because even small changes have large and abrupt effects on banks’ balance sheets. Canada abolished its reserve requirement in 1992, and the US Federal Reserve reduced its requirement to zero in March 2020, relying instead on its policy rate and the interest it pays on reserves.
Sources: Reserve requirement, Wikipedia (2026); China News Service, 15 May 2025.
When the policy rate is already close to zero, cutting it further is no longer possible. In this situation central banks have used quantitative easing (QE): buying government bonds, and sometimes other financial assets, on a very large scale with newly created reserves.
QE works in three main ways. Buying bonds pushes up their prices and so lowers their yields, and with them long-term interest rates such as mortgage rates and corporate borrowing costs. The sellers of the bonds receive new money, which they may spend or use to buy other assets such as shares, raising those prices too. QE also signals that the central bank intends to keep rates low for a long time, which supports confidence.
QE differs from ordinary open market operations in its scale and its aim. Ordinary operations buy and sell short-term bonds to hold the policy rate at its target; QE buys long-term bonds in huge quantities to lower long-term rates once the policy rate cannot fall further. The Bank of Japan first used QE in 2001. The Fed began buying mortgage-backed securities in November 2008, and the Bank of England began QE in March 2009. By the end of its programme the Bank of England had bought £895 billion of bonds.
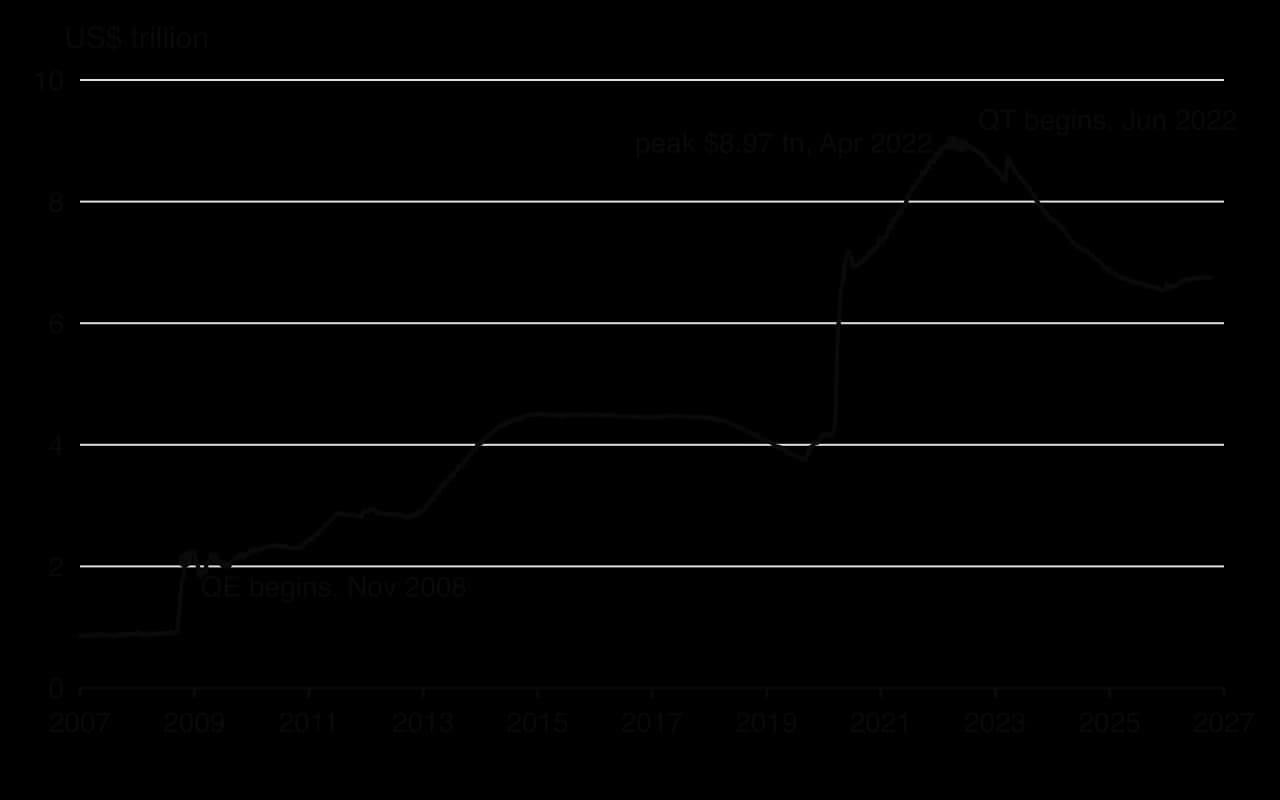
The chart shows the size of the Fed’s holdings of assets, which grew in steps with each round of QE after 2008 and jumped in 2020 when QE was restarted during the pandemic. After inflation rose in 2021–22, central banks began to shrink their bond holdings, a process called quantitative tightening (QT). The Bank of England started to unwind QE in February 2022, and the Fed began QT in June 2022.
The evidence suggests that QE did lower long-term interest rates, especially in the first rounds after 2008. Critics argue that it inflated the prices of shares and houses, which benefits wealthier households who own those assets: a 2012 Bank of England report estimated that about 40% of the gains from higher asset prices went to the richest 5% of UK households. QE also leaves central banks holding large amounts of government debt, which can blur the line between monetary and fiscal policy.
Sources: Bank of England, Quantitative easing (2026); Quantitative easing and Quantitative tightening, Wikipedia (2026), citing the Federal Reserve and the Bank of England (2012).
Tool | Expansionary use | Contractionary use | Main limitation |
|---|---|---|---|
Minimum lending rate | Cut the rate | Raise the rate | Cannot be cut much below zero |
Open market operations | Buy bonds, adding reserves | Sell bonds, removing reserves | Works only through banks’ willingness to lend |
Minimum reserve requirement | Lower the requirement | Raise the requirement | Blunt: small changes have large effects on banks |
Quantitative easing | Buy long-term bonds on a large scale | QT: sell or run down bond holdings | Uncertain size of effect; raises asset prices and wealth inequality |
Like any price, the interest rate can be explained with demand and supply. In the money market, the “good” is money itself and the “price” is the nominal interest rate.
The demand for money is the quantity of money, as cash and bank deposits, that households and firms want to hold. People hold money for three reasons: to pay for everyday transactions; as a precaution against unexpected expenses; and as an asset, when they judge that holding money is better than holding bonds.
Holding money has an opportunity cost: the interest that could have been earned by holding a bond or another interest-bearing asset instead. When interest rates are high, this cost is high, so people hold less money and more bonds. When interest rates are low, the cost of holding money is small, so they hold more. The money demand curve (Dm) therefore slopes downwards.
The money demand curve shifts when the need for money changes at every interest rate. A rise in real GDP means more transactions, and a rise in the price level means each transaction needs more money, so both shift Dm to the right. Greater uncertainty also raises the demand for money as a safe asset.
The money supply is set by the central bank, through open market operations, reserve requirements and QE. It does not depend on the interest rate, so the money supply curve (Sm) is drawn as a vertical line at the quantity chosen by the central bank.
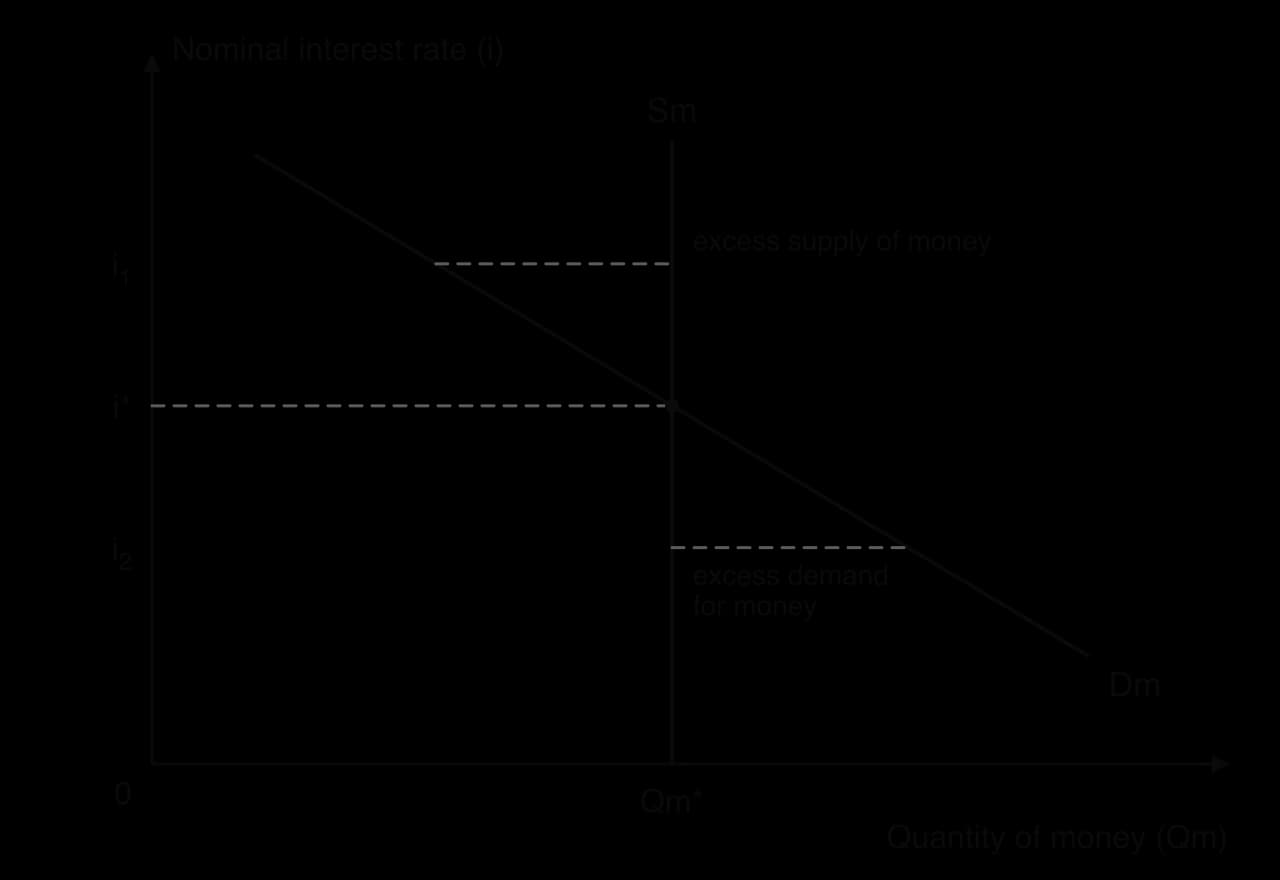
The equilibrium interest rate is i*, where the quantity of money demanded equals the money supply Qm*. The market moves to i* through the bond market. At a higher rate such as i₁, there is an excess supply of money: people hold more money than they want, so they use it to buy bonds. Bond prices rise, and since bond prices and interest rates move in opposite directions, the interest rate falls towards i*. At a lower rate such as i₂, there is excess demand for money: people sell bonds to obtain money, bond prices fall and the interest rate rises towards i*.
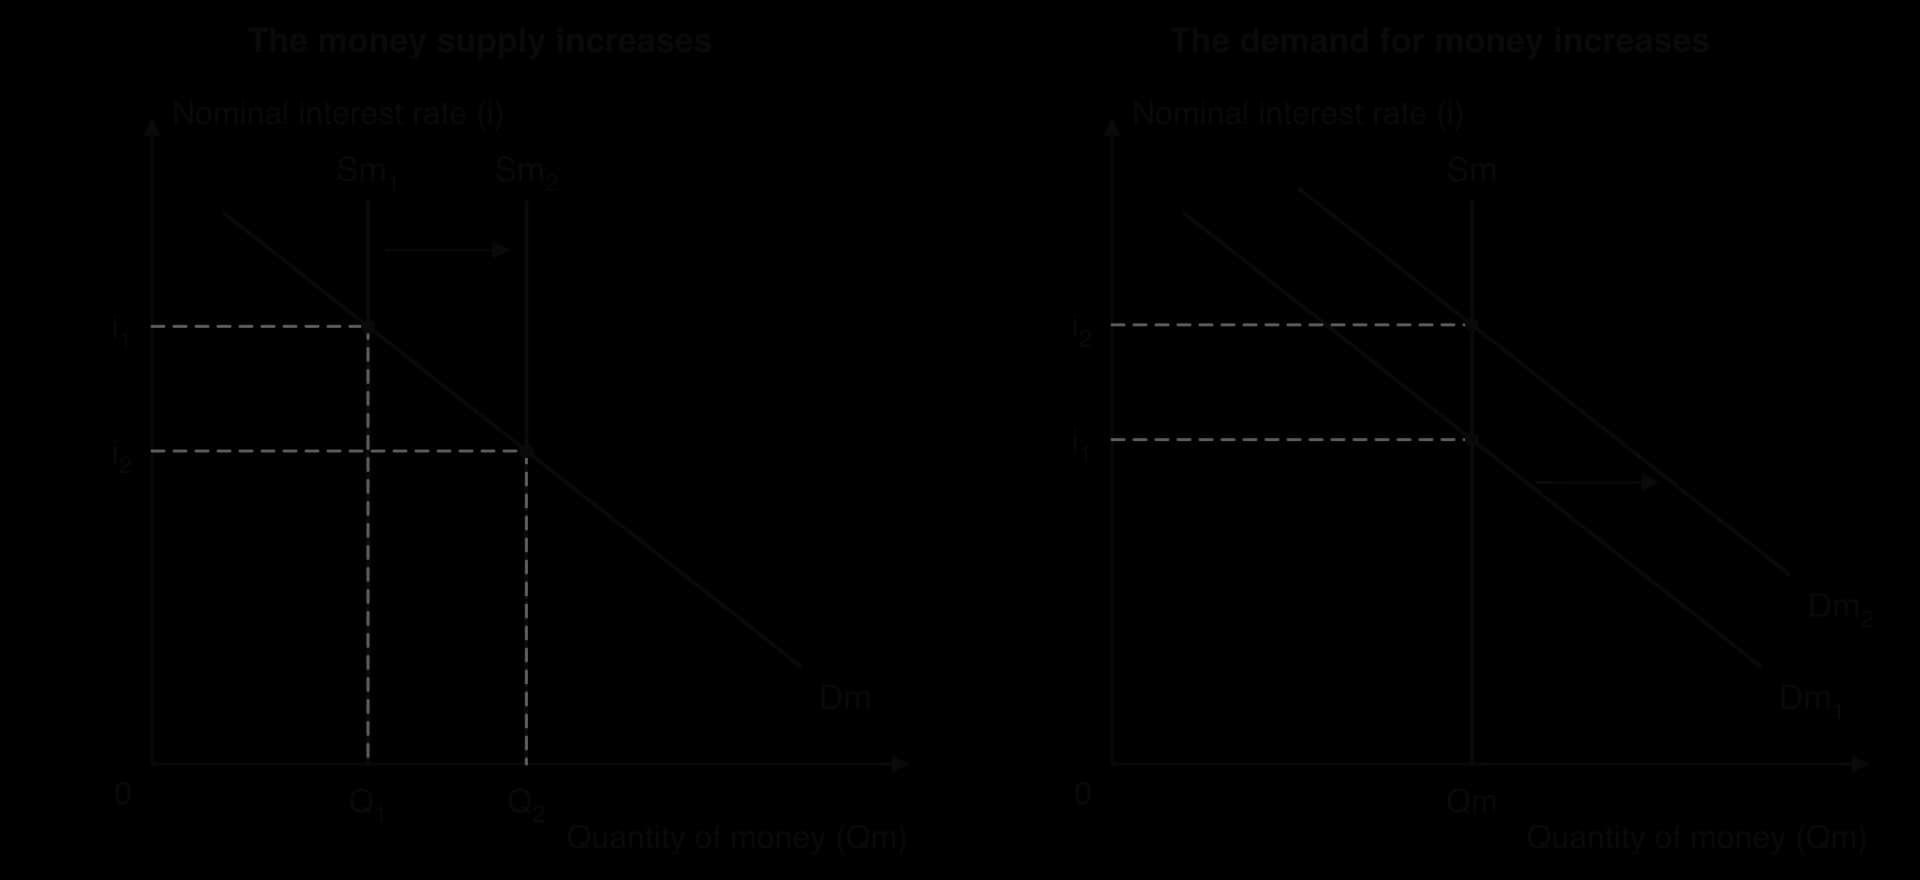
The left-hand diagram shows expansionary monetary policy. The central bank buys bonds through open market operations, cuts the reserve requirement or carries out QE, and the money supply shifts from Sm₁ to Sm₂. At the old rate i₁ there is now excess supply of money, so the interest rate falls to i₂. Lower interest rates then raise AD through the transmission mechanism. Contractionary policy shifts Sm to the left and raises the interest rate.
The right-hand diagram shows what happens if the demand for money rises, for example because real GDP and the price level are rising in a boom. With the money supply unchanged, the interest rate rises from i₁ to i₂. A central bank that wants to keep the rate at i₁ must increase the money supply to match the higher demand.
The equilibrium interest rate can also be read from a money demand schedule. The table gives one for a hypothetical economy.
Nominal interest rate (%) | 2 | 3 | 4 | 5 | 6 |
|---|---|---|---|---|---|
Quantity of money demanded ($ billion) | 400 | 350 | 300 | 250 | 200 |
Monetary policy is the first line of defence against inflation and recession in most economies. Whether it works well depends on the state of the economy, the cause of the problem, the confidence of households and firms, and the credibility of the central bank.
Incremental. Rates can be changed in small steps, typically 0.25 percentage points, so the central bank can fine-tune policy and watch the response before moving again.
Flexible and easily reversed. Committees meet often, so a policy that proves too tight or too loose can be adjusted within weeks. Fiscal changes such as new taxes or spending programmes are much harder to reverse.
Short implementation lag. A decision can be taken and announced on the same day, and commercial banks usually change their rates within days. Fiscal policy often needs parliamentary approval, which can take months.
Independent of politics. An independent central bank can raise rates when this is unpopular, which makes its commitment to low inflation credible and helps to anchor inflation expectations.
No direct effect on the budget. Monetary policy does not require the government to borrow more, unlike expansionary fiscal policy.
Interest rates cannot be cut far below zero. If rates were strongly negative, people could withdraw their deposits and hold cash, which pays 0%. When the policy rate is close to zero, the central bank is at the zero lower bound and has little room left to stimulate AD by cutting rates.
After the 2008 financial crisis many central banks reached this limit. Some went slightly below it: the ECB set a negative rate on banks’ deposits in June 2014 and lowered it to −0.50% by September 2019, before returning it to zero in July 2022. The Bank of Japan ended eight years of negative interest rates in March 2024. These experiments showed that rates can go a little below zero, but not by enough to provide a large stimulus, which is why central banks turned instead to quantitative easing (QE): buying government bonds on a very large scale to lower long-term interest rates.
Sources: European Central Bank, Key ECB interest rates (2026); Bank of Japan, Wikipedia (2026).
Lower interest rates make borrowing cheaper, but they cannot force anyone to borrow. In a deep recession, households worried about losing their jobs may save more, not less, and firms with spare capacity see no reason to invest, however cheap credit is. Banks that fear defaults may refuse to lend. In this situation, often described as “pushing on a string”, a cut in rates has little effect on AD.
Low business confidence and consumer confidence therefore limit expansionary monetary policy exactly when it is most needed. Contractionary policy does not face the same limit: higher rates reliably reduce borrowing and spending. Monetary policy is therefore usually more effective at reducing inflation than at ending a deep recession.
Time lags. Although decisions are quick, their effects are slow. The Bank of England estimates that it can take around 18–24 months for a change in interest rates to have its full effect. By then the economy may be in a different part of the cycle.
Cost-push inflation. Monetary policy acts on AD. When inflation is caused by a fall in SRAS, for example a jump in energy prices, raising rates lowers inflation only by reducing output and employment further.
One rate for the whole economy. A single interest rate affects every region and sector. The ECB sets one rate for all the countries in the euro area, even when some are booming and others are in recession.
Household and government debt. When debts are high, a rise in rates hurts borrowers and can cause defaults; a cut may do little if households are trying to repay what they owe.
Distribution. Higher rates help savers and hurt borrowers, often younger households with mortgages. Low rates and QE raise asset prices, which benefits wealthier households.
Open economies. If other countries’ rates rise, financial capital may flow out and the currency depreciate even if the home central bank does not change its rate, raising import prices and inflation.
The strengths and limitations apply differently to each goal. The table brings them together.
Goal | Strengths of monetary policy | Limitations |
|---|---|---|
Low and stable inflation | Very effective against demand-pull inflation; a credible inflation target anchors expectations and lowers the cost of disinflation. | Weak against cost-push inflation: it reduces inflation only by reducing output. Takes 18–24 months to work fully. |
Low unemployment | Lower rates reduce cyclical unemployment by raising AD, quickly and without raising government debt. | Limited at the zero lower bound and when confidence is low. Cannot reduce structural or frictional unemployment. |
Economic growth | Supports short-run growth by closing a deflationary gap; stable prices encourage long-term investment. | Does not shift LRAS directly. Very low rates for long periods may encourage debt and asset bubbles that end in a crisis. |
Economists differ on how much monetary policy can achieve. Monetarist/new classical economists argue that the economy tends towards full employment on its own, so the main job of the central bank is to keep inflation low and predictable; trying to push output above Yf by keeping rates low only raises inflation in the long run. Keynesian economists argue that recessions can last a long time and that active demand management is needed, but many add that monetary policy is weak in a deep recession, when fiscal policy must take the lead.
Both views can be seen in recent history. The disinflation of 2023–24 in the US, after the Fed’s rate rises, is consistent with the view that monetary policy controls inflation. The slow recovery after 2008, despite near-zero rates and QE, supports the Keynesian view that monetary policy alone may not be enough in a deep slump.
Key concept | How it applies to monetary policy |
|---|---|
Intervention | The central bank intervenes in the money market to steer interest rates and AD; its independence limits political intervention in that decision. |
Equity | Rate changes and QE redistribute income and wealth between borrowers and savers, and between asset owners and others. |
Change | Policy responds to the business cycle and must look ahead, because its effects take 18–24 months. |
Interdependence | One country’s interest rates affect capital flows, exchange rates and inflation in others. |
Economic well-being | Low and stable inflation protects purchasing power; low unemployment protects incomes. |
Monetary policy is the most flexible and fastest-acting tool of demand management, and it is generally effective at controlling demand-pull inflation, as the falls in inflation after the 2022–23 rate rises showed. It is less effective at ending deep recessions, because of the zero lower bound and low confidence, and it cannot cure cost-push inflation without a cost in output and jobs. Its success depends heavily on credibility: an independent central bank with a clear target can reduce inflation at a lower cost than one whose commitment is in doubt. For long-term growth and structural problems, supply-side policies are needed alongside it.
Türkiye’s experience between 2021 and 2025 is an unusually clear test of monetary theory, because the central bank followed two opposite policies in quick succession. In the first period it cut interest rates while inflation was rising; in the second it raised them very sharply. The results match what the theory of real interest rates and credibility predicts.
In March 2021 the Central Bank of the Republic of Türkiye (CBRT) raised its policy rate, the one-week repo rate, to 19%. Within days its governor was dismissed. President Erdoğan had long opposed high interest rates, arguing that tight monetary policy would not lower inflation, the opposite of mainstream theory. From September 2021 the central bank cut the rate in steps to 14% by December 2021, and then to 8.5% by February 2023.
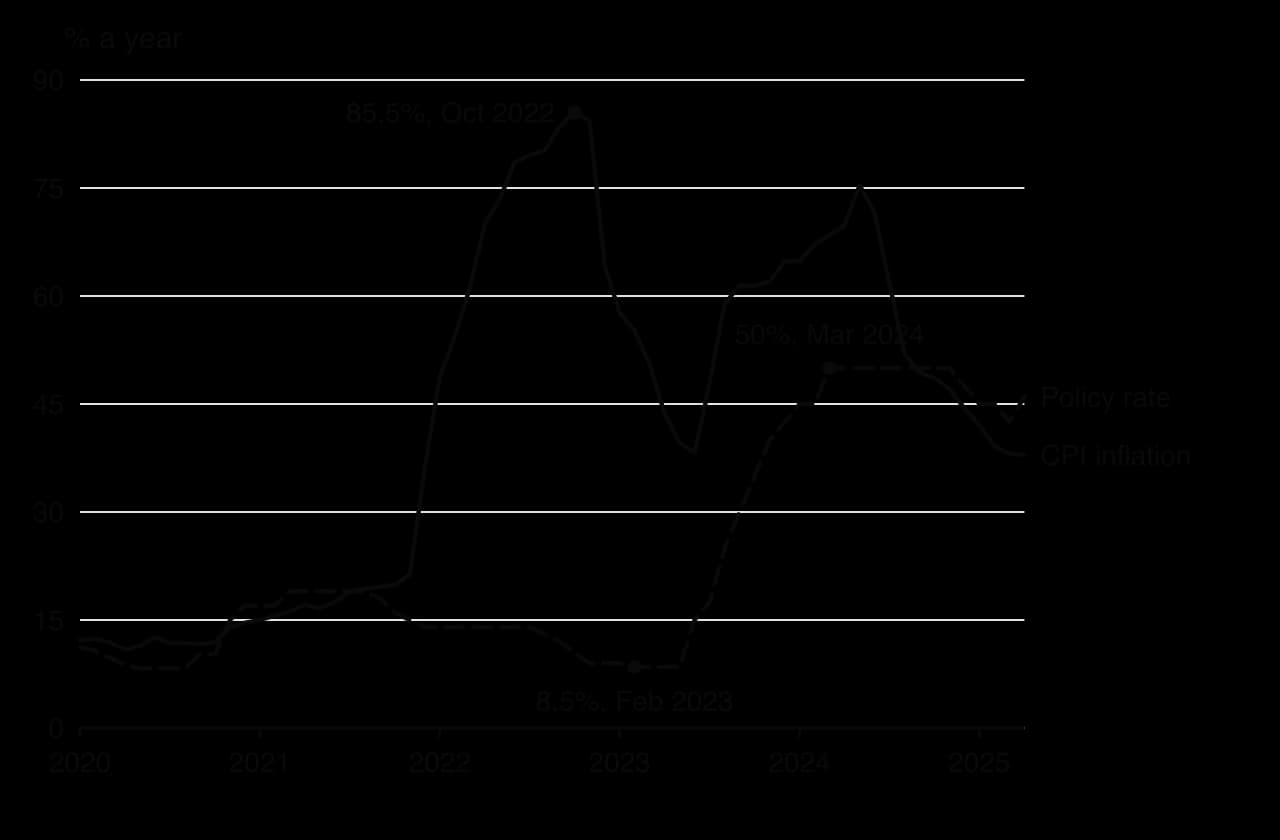
With inflation already near 20% in 2021, each cut pushed the real interest rate further below zero. Annual consumer price inflation reached 85.5% in October 2022, when the policy rate was 10.5%: a real rate of about −75% using the usual approximation. Households had every reason to spend money quickly or move their savings into foreign currency, gold or property, rather than hold lira deposits that were losing value.
The exchange rate channel worked strongly. As investors moved money out of lira, the currency depreciated from about 8.5 lira per US dollar in September 2021 to 18.6 in October 2022, measured as monthly averages. A weaker lira raised the price of imported energy, food and components, adding cost-push inflation to the demand-pull pressure from negative real rates, and expectations of further inflation became built into wages and prices.
After the May 2023 elections a new economic team, led by finance minister Mehmet Şimşek and a new central bank governor, changed course. The CBRT raised its rate from 8.5% to 15% in June 2023, to 25% in August, to 42.5% by December 2023 and to 50% in March 2024, where it stayed for the rest of 2024.
Inflation did not fall at once. It rose again to 75.4% in May 2024, partly because of the lira’s further fall in mid-2023 and the long time lags of monetary policy. It then fell steadily: to 44.4% in December 2024 and 37.9% in April 2025. By then the real interest rate was clearly positive, at about 46% − 37.9% ≈ +8%. As inflation slowed, the central bank began to lower its rate, to 37% by January 2026.
Year | Average CPI inflation (%) | Real GDP growth (%) | Policy rate at year end (%) |
|---|---|---|---|
2021 | 19.6 | 11.8 | 14.0 |
2022 | 72.3 | 5.4 | 9.0 |
2023 | 53.9 | 5.0 | 42.5 |
2024 | 58.5 | 3.5 | 47.5 |
2025 | 34.9 | 3.7 | 38.0 |
The table shows the trade-off. Growth was very strong in 2021 when real rates were deeply negative, and slowed from 5.4% in 2022 to about 3.5–3.7% in 2024–25 as policy tightened. The economy did not fall into recession, however, and unemployment continued to fall, from 10.4% in 2022 to 8.3% in 2025 on IMF figures.
Real, not nominal, rates matter. A 14% policy rate was not tight when inflation was 70–85%. Policy became contractionary only when the real rate turned positive in 2024.
Credibility and independence. Repeated changes of governor and political pressure to cut rates undermined confidence in the lira and raised inflation expectations, so a much larger rise in rates was later needed to bring inflation down.
Time lags. Inflation kept rising for almost a year after rates began to rise in June 2023, and fell only in the second half of 2024.
The exchange rate channel. In an open economy that imports much of its energy, a falling currency adds cost-push inflation, which is why cutting rates made inflation worse, not better.
The case also has limits. Other factors affected inflation at the same time, including world energy prices after 2022 and a devastating earthquake in February 2023, so not every change can be attributed to monetary policy. Disinflation came at a cost to borrowers and to growth, and inflation still averaged 34.9% in 2025. The lira also kept depreciating, to about 47.8 per US dollar in August 2026, so the return to price stability was far from complete.
Sources: Central Bank of the Republic of Türkiye, one-week repo rate decisions (2026); OECD consumer prices for Türkiye via FRED, CPALTT01TRM659N, and US dollar exchange rate, CCUSMA02TRM618N (2026); IMF World Economic Outlook database, PCPIPCH, NGDP_RPCH and LUR for Türkiye (2026); Turkish economic crisis (2018–current), Wikipedia (2026).
Monetary policy appears in every paper. Paper 1 often asks you to explain monetary policy with an AD/AS diagram in part (a) and to evaluate it in part (b). Paper 2 data-response questions often include a real interest rate calculation and a part (g) on a central bank’s decision. At HL, Paper 3 can ask for money creation or money market calculations and a policy recommendation in which monetary policy is one option.
Monetary policy is the central bank’s use of interest rates and the money supply to influence aggregate demand; most central banks set it independently of the government.
Its goals are low and stable inflation (usually an inflation target of about 2%), low unemployment, a smoother business cycle, a stable environment for long-term growth and external balance.
A change in the policy rate works through the transmission mechanism: borrowing costs, saving, asset prices and the exchange rate change C, I and (X − M), and so AD.
The real interest rate ≈ nominal rate − inflation; it is the real rate that affects spending.
Expansionary policy shifts AD right to close a deflationary gap; contractionary policy shifts AD left to close an inflationary gap.
HL: commercial banks create money by lending; the money multiplier (1 ÷ reserve ratio) sets the maximum. The tools are the minimum lending rate, open market operations, reserve requirements and QE. The equilibrium interest rate is where money demand meets the vertical money supply.
Monetary policy is incremental, flexible, reversible and quick to implement, but it is limited near the zero lower bound, when confidence is low, against cost-push inflation and by time lags of up to two years.
I can define monetary policy and explain the roles of the central bank and commercial banks.
I can explain the goals of monetary policy, including inflation targeting and why it aims for about 2%.
I can explain each channel of the monetary transmission mechanism.
I can distinguish real from nominal interest rates and calculate the real interest rate.
I can draw and explain AD/AS diagrams for expansionary and contractionary monetary policy.
I can explain money creation and calculate deposits with the money multiplier (HL).
I can explain the four tools of monetary policy, including QE (HL).
I can draw the money market diagram and explain how the equilibrium interest rate changes (HL).
I can evaluate the effectiveness of monetary policy for growth, unemployment and inflation, using real examples such as Türkiye.
In a modern economy, households, firms, the government, banks and foreign buyers and sellers are linked through flows of money.
Explain how the financial sector and the foreign sector create interdependence between decision-makers in the circular flow of income.
10 marks
Using real-world examples, discuss the effectiveness of lower interest rates in increasing investment and real GDP.
15 marks
Read the extracts and answer the questions that follow.
Text A — Overview of Rendalia
[1] Rendalia is a lower-middle-income economy in South America with a population of 31 million. Agriculture employs about a quarter of the labour force, and soybeans are its largest export, followed by beef and timber. Tourism, centred on the rainforests and wetlands of the south, has become the fastest-growing source of foreign exchange.
[2] Between 2015 and 2025 the world price of soybeans fell, and foreign investors withdrew funds from Rendalia. As a result, the rendal (RDL) experienced a depreciation against the US dollar (Table 1). Because Rendalia imports most of its fuel and fertilizer, the weaker currency raised firms' costs and inflation rose sharply.
[3] In 2025 the central bank raised its policy interest rate from 5 % to 11 % in an attempt to bring inflation back to its target of 3–5 %. Business groups warned that higher borrowing costs would slow investment and job creation at a time when unemployment was already rising.
[4] Despite slower growth, the share of the population living in extreme poverty has continued to fall, helped by a cash transfer programme for rural households. Inequality remains high, however, particularly between the prosperous soy-growing north and the poorer, more remote south, where many households depend on small-scale farming and seasonal tourism work.
[5] The government's budget deficit widened to 4.8 % of GDP in 2025 as spending on the cash transfer programme rose and revenue from taxes on trade fell. Credit rating agencies have warned that further increases in government debt could raise the cost of borrowing.
Table 1: Economic data for Rendalia
Indicator | 2015 | 2025 |
|---|---|---|
Real GDP growth (annual %) | 4.1 | 2.3 |
Inflation (annual % change in CPI) | 3.2 | 9.4 |
Unemployment (% of labour force) | 6.5 | 8.1 |
Exchange rate (RDL per US$) | 4.00 | 6.00 |
Population in extreme poverty (%) | 14.0 | 11.5 |
Text B — Soy, forests and soil in the Northern Province
[1] Rendalia's Northern Province contains large areas of tropical forest. Over the past decade, soy farms have expanded rapidly into the forest. Fertile, cleared land has become increasingly scarce, and each new farm must be carved out of forest on poorer, more distant land.
[2] The price of cleared farmland in the province has more than doubled since 2015. Smaller farmers, unable to afford land close to roads and ports, have moved deeper into the forest, where transport costs are higher and yields are lower.
[3] Agricultural economists have estimated the combinations of soybeans and forest products (timber, nuts and resins harvested sustainably) that the province could produce each year if all of its land, labour and capital were fully employed (Table 2).
[4] Clearing the forest has consequences beyond the farms themselves. Without tree cover, heavy rains wash away topsoil, reducing yields on existing farms and filling rivers with silt that damages fisheries downstream. Indigenous communities who depend on the forest for food and income have lost land, and the burning that accompanies clearance releases large quantities of carbon dioxide.
Table 2: Production possibilities of the Northern Province (per year)
Combination | Soybeans (thousand tonnes) | Forest products (thousand cubic metres) |
|---|---|---|
A | 0 | 500 |
B | 200 | 460 |
C | 400 | 360 |
D | 600 | 200 |
E | 800 | 0 |
Text C — A new strategy for growth
[1] In 2025 Rendalia's government announced a new strategy. A 5 % tax will be charged on the value of soybean exports. Half of the revenue will fund payments to landowners who keep forest standing, and the other half will pay for rural roads, agricultural research to raise yields on existing farmland, and training for workers in ecotourism.
[2] Soy producers argue that the tax will make them less competitive against producers in other countries and reduce export earnings. Environmental groups say the payments for keeping forest are too low to stop clearing. Tourism operators welcome the plan; a hotel night in a southern eco-lodge costs RDL 360, and they say the weaker rendal has made Rendalia an attractive destination for foreign visitors.
Define the term depreciation indicated in bold in the text (Text A, paragraph 2).
2 marks
Define the term scarce indicated in bold in the text (Text B, paragraph 1).
2 marks
Using information from Table 2, calculate the opportunity cost of one tonne of soybeans when the Northern Province moves from combination C to combination D.
2 marks
Using information from Table 2, state whether the opportunity cost of soybeans rises, falls or stays the same as more soybeans are produced.
1 mark
Using information from Table 1 and Text C, paragraph 2, calculate the price in US$ of a hotel night in a southern eco-lodge in 2025.
2 marks
Using an AD/AS diagram, explain how the central bank's increase in its interest rate is likely to affect inflation in Rendalia (Text A, paragraph 3).
4 marks
Using an exchange rate diagram, explain why the rendal depreciated between 2015 and 2025 (Text A, paragraph 2 and Table 1).
Using a production possibilities curve (PPC) diagram, explain how soil erosion could affect the Northern Province's production possibilities (Text B, paragraph 4).
4 marks
Using an externalities diagram, explain why the expansion of soy farming into the forest leads to a welfare loss (Text B, paragraph 4).
4 marks
Using information from the text/data and your knowledge of economics, evaluate the government's new strategy (Text C) as a way of achieving economic growth and sustainable development in Rendalia.
15 marks