Measure inequality with the Lorenz curve and Gini coefficient, distinguish absolute and relative poverty, explain their causes and effects, and evaluate taxes, transfers and other policies to reduce them.
Each is in the Economics glossary, with every other term in the subject.
A situation in which income is below the level needed to meet basic needs for survival, such as food, clean water, shelter and clothing, measured against a fixed standard such as an international poverty line.
Total tax paid as a percentage of total income: total tax divided by total income, multiplied by 100.
A single index that combines several different measures, such as income, health and education, into one number, so that a many-sided idea such as poverty or development can be measured.
A regular cash payment to low-income households made only if they meet conditions, such as sending their children to school or attending health clinics.
A direct tax on the profits of companies.
A tax paid directly to the government by the person or firm on whom it is levied, on their income, profits or wealth, such as personal income tax, corporate income tax or wealth tax.
Treating people less favourably because of a characteristic unrelated to their productivity, such as gender, race, ethnicity, religion, age or disability, for example in hiring, pay, promotion or access to credit.
The difference between the average (usually median) earnings of men and women, expressed as a percentage of men’s earnings.
Distinguish between equality and equity, and between inequality of income and inequality of wealth.
Draw a Lorenz curve, explain how the Gini coefficient is derived from it, and show changes in the distribution of income.
Construct a Lorenz curve from income quintile data (HL).
Distinguish between absolute and relative poverty and explain how poverty is measured with single and composite indicators, including the difficulties involved.
Explain the causes of economic inequality and poverty.
Evaluate the effects of income and wealth inequality on economic growth, standards of living and social stability.
Distinguish between progressive, proportional and regressive taxes, and between average and marginal tax rates.
Calculate the indirect tax paid on a given amount of spending, and total tax and average tax rates from a tax schedule (HL).
Evaluate taxation and other policies, including transfer payments, universal basic income and minimum wages, as ways to reduce poverty and inequality.
Every economy divides its output among its people, and none divides it equally. The economics of inequality and poverty studies how income and wealth are shared out, how that distribution is measured, why some people are poor even in rich countries, and what governments can do about it. In South Africa in 2022, the richest fifth of the population accounted for 59.5% of all consumption, while the poorest fifth accounted for 3.7%.
Sources: World Bank, Poverty and Inequality Platform, via World Development Indicators (2026).
The topic sits at the centre of the key concepts of equity,
218 exam-style questions on this subtopic, written in the style of the IB papers. The first has its markscheme open. Counted on
Every economy must decide for whom goods and services are produced.
Explain why the question of 'for whom to produce' involves the concepts of equity and efficiency.
10 marks
Answers may include:
Terminology: definitions of the basic economic questions, equity (fairness, a normative concept), equality, efficiency (allocative efficiency: producing the combination of goods most wanted by society), price mechanism.
Explanation: in a market economy, goods go to those willing and able to pay, so the distribution of output depends on the distribution of income and wealth; this can be efficient, because resources follow consumer demand, but can be judged unfair (inequitable) if low-income households cannot afford necessities; governments may redistribute income or provide goods directly to achieve a fairer outcome, but this may weaken incentives or create waste, reducing efficiency; the answer to 'for whom' therefore reflects a choice between efficiency and different views of equity.
Diagram: a demand and supply diagram showing that consumers whose willingness to pay is below the equilibrium price do not obtain the good; or a PPC showing a choice between necessities and luxury goods.
A maximum of [6] should be awarded if only equity or only efficiency is explained.
Markbands (best fit)
Level | Marks | Descriptor |
|---|---|---|
One of 70 short multiple-choice questions on 3.4. Pick an answer to see why it's right or wrong.
Income shares by quintile, poorest first, are 3%, 7%, 13%, 22% and 55%. Which points (cumulative % of population, cumulative % of income) give the Lorenz curve?
The official deck for this part of the syllabus.
State the four questions the economics of inequality and poverty studies.
Explain why a market outcome can be efficient yet still be seen as unfair.
With a free account, Augment remembers where you stopped and what you have practiced.
A measure of inequality equal to the area between the line of perfect equality and the Lorenz curve divided by the whole area under that line; it ranges from 0 (perfect equality) to 1.
One-fifth (20%) of a population ranked by income, from the poorest fifth (the first quintile) to the richest fifth (the fifth quintile).
A situation in which people’s chances of achieving a high income or good standard of living depend on circumstances they did not choose, such as parents’ income, gender, ethnicity or place of birth.
An income or consumption threshold set by the World Bank in dollars a day at purchasing power parity, below which a person is counted as extremely poor; $3.00 a day (2021 prices) since June 2025.
The 45-degree line on a Lorenz diagram along which each percentage of the population receives the same percentage of income, showing a perfectly equal distribution.
A curve showing the cumulative percentage of total income or wealth received by each cumulative percentage of the population, ranked from the poorest to the richest.
The percentage of each additional unit of income that is paid in tax: the change in tax paid divided by the change in income, multiplied by 100.
A transfer payment made only to people whose income or wealth is below a set level, so that support is targeted at those most in need.
The income a particular type of household needs for a minimum acceptable standard of living, found by pricing a basket of goods and services that members of the public agree is necessary.
A composite poverty measure counting people as poor if deprived in at least one-third of ten weighted indicators of health, education and living standards; it combines the share of people poor with the intensity of their deprivation.
A direct tax on the income of individuals, such as wages, salaries, rent, interest and dividends, usually charged at rates that rise with income.
The condition of lacking the income or resources needed for a minimum acceptable standard of living, judged against basic needs or against the typical living standards of a society.
A self-reinforcing situation in which low incomes lead to low saving, low investment and poor health and education, which keep productivity and incomes low, so poverty persists over time and across generations.
A tax whose average rate rises as income rises, so that people with higher incomes pay a larger percentage of their income in tax.
A tax whose average rate stays the same at every level of income, so that everyone pays the same percentage of their income in tax.
A tax whose average rate falls as income rises, so that people with lower incomes pay a larger percentage of their income in tax than people with higher incomes.
A situation in which income is well below the typical income of the society a person lives in, usually measured as household income below 50% or 60% of the median.
The extent to which people can move up or down the income or social scale during their lives or compared with their parents; low mobility means children’s incomes depend strongly on their parents’.
Government spending on goods and services, such as free school meals, social housing or health care, that is directed at particular low-income or disadvantaged groups.
The legal use of loopholes, allowances or the relocation of income and profits to reduce the tax paid, unlike tax evasion, which is illegal concealment of income.
Payments from the government to individuals, such as pensions, unemployment benefits and child benefits, for which no good or service is provided in return.
A regular, unconditional cash payment made by the government to every adult or citizen, regardless of income, wealth or employment.
A direct tax on the value of a person’s net assets (property, savings, shares and other assets minus debts), usually charged each year and only above a high threshold.
The words “equality” and “equity” sound alike, but in economics they mean different things. Equality is a positive idea: it describes whether people have the same amount of something, such as income, wealth or access to schooling. It can be measured, and two economists looking at the same data will agree on whether income is more or less equally distributed than it was ten years ago.
Equity means fairness. It is a normative idea, because what counts as fair depends on values. One person may regard a distribution as fair if everyone was paid in line with the effort they made; another may regard it as fair only if everyone can meet their basic needs. Because judgments differ, equity cannot be settled by data alone, although data inform the debate.
Most people accept some inequality as fair. A surgeon who has trained for twelve years usually earns more than a student working part time, and few regard that gap as unjust. In the same way, a pensioner who saved throughout a working life has more wealth than a 20-year-old, which reflects age rather than unfairness.
Economists often separate two ideas of fairness. Horizontal equity means treating people in the same situation in the same way: two people with the same income should pay the same tax. Vertical equity means treating people in different situations differently, in proportion to those differences: people with higher incomes should pay more tax, and people with greater needs should receive more support. Progressive taxes and means-tested benefits are applications of vertical equity.
A further distinction is between equality of outcome (similar incomes or living standards) and equality of opportunity (similar chances to succeed, whatever a person’s background). Many people who reject equal outcomes as a goal still regard unequal opportunities as unfair. When a person’s chances depend on circumstances they did not choose, the result is inequality of opportunity.
The link between the two ideas is therefore indirect. Reducing inequality is often justified on grounds of equity, but a fair society is not necessarily one with equal incomes. The debate is about how much inequality is acceptable, and which kinds: inequality that results from effort and choices is usually judged differently from inequality that results from inherited wealth, discrimination or lack of access to education.
Economic inequality refers to differences in how economic resources are shared among individuals or households. It has two main dimensions, which are related but measured differently.
Income is a flow: the amount of money a person or household receives over a period of time, such as a month or a year. It includes wages and salaries, profits from running a business, rent, interest and dividends (the factor incomes earned by supplying land, labour, capital and entrepreneurship), plus transfer payments from the government, such as pensions and child benefits.
Wealth is a stock: the value of the assets a person owns at a point in time, minus their debts. Assets include houses and land, savings in bank accounts, shares, bonds, pension funds and businesses. A person can have a high income and little wealth (a young doctor with a student loan) or great wealth and a low income (a retired farmer who owns valuable land).
Income | Wealth | |
|---|---|---|
Type of variable | A flow, measured per period (e.g. per year) | A stock, measured at a point in time |
Examples | Wages, profits, rent, interest, dividends, transfer payments | Property, land, savings, shares, pension funds, businesses, minus debts |
How it is distributed | Unequal in every economy | Usually far more unequal than income |
How it is taxed | Personal and corporate income taxes | Wealth taxes, inheritance taxes, property taxes, capital gains taxes |
The distribution of income describes how total income is shared among the population; the distribution of wealth describes how total wealth is shared. The two are linked in both directions. Wealth generates income (rent from property, dividends from shares, interest from savings), and high incomes allow people to save and so build up wealth.
Wealth inequality is greater than income inequality in almost every country, for three reasons. First, saving is easier at high incomes: a household that spends all its income on necessities accumulates no wealth, while a high-income household can save a large share. Second, wealth earns a return, so existing wealth grows over time without any additional work, and the gap widens. Third, wealth is passed between generations through inheritance, so differences persist from parents to children.
Measuring inequality starts by ranking the population from the poorest to the richest household and asking what share of total income each group receives. The population is commonly divided into five equal groups, called income quintiles.
If income were shared equally, each quintile would receive 20% of total income. In practice the poorest quintile receives much less than 20% and the richest much more. Deciles (tenths) and percentiles (hundredths) are used in the same way when more detail is needed.
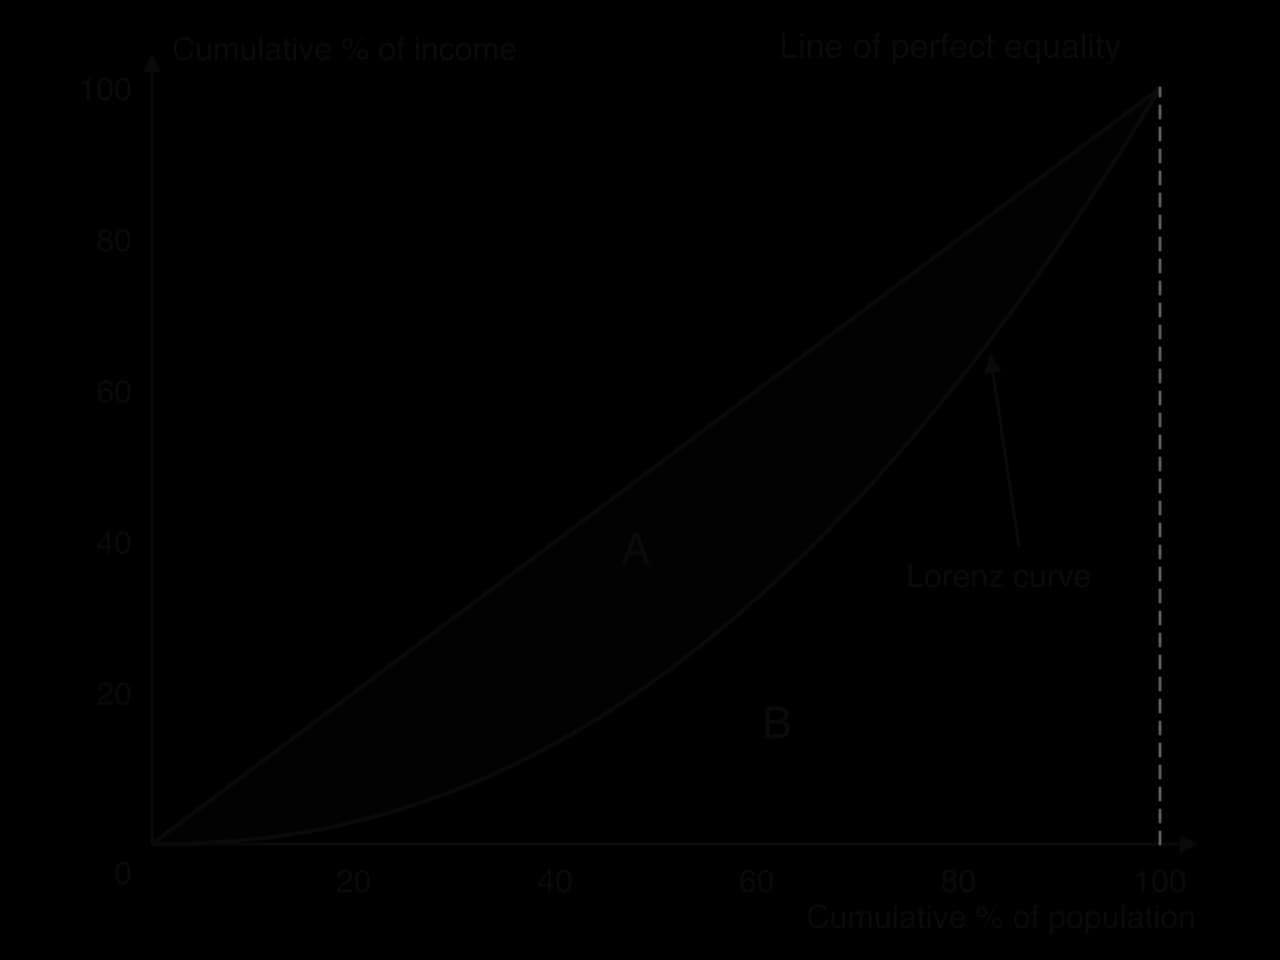
A Lorenz curve shows the whole distribution on one diagram. The horizontal axis measures the cumulative percentage of the population, ranked from the poorest; the vertical axis measures the cumulative percentage of income they receive. “Cumulative” means each point adds up everything to its left: the point at 40% of the population shows the share of income received by the poorest 40% together.
The diagonal from the origin to the top-right corner is the line of perfect equality. Along it, the poorest 20% receive 20% of income, the poorest 40% receive 40%, and so on. Every real Lorenz curve lies below this line, because the poorest groups receive less than their population share. Both lines start at (0, 0) and end at (100, 100): no people receive no income, and all the people receive all the income.
The diagram shows the Lorenz curve sagging below the line of perfect equality. The gap between the two, area A, measures how far the distribution is from equality. The opposite extreme, perfect inequality, would occur if one person received all the income: the Lorenz curve would then run along the horizontal axis to 100% and rise vertically at the end.
The Lorenz curve is visual, so it is hard to compare dozens of countries or years with it. The Gini coefficient summarises the curve in a single number.
With perfect equality, the Lorenz curve coincides with the line of perfect equality, area A is zero and the Gini coefficient is 0. With perfect inequality, area B disappears and the coefficient is 1. The same measure is often reported as the Gini index, which is the coefficient multiplied by 100: a Gini coefficient of 0.54 is a Gini index of 54. Countries with a Gini index below about 30 are usually described as relatively equal, and those above about 50 as highly unequal.
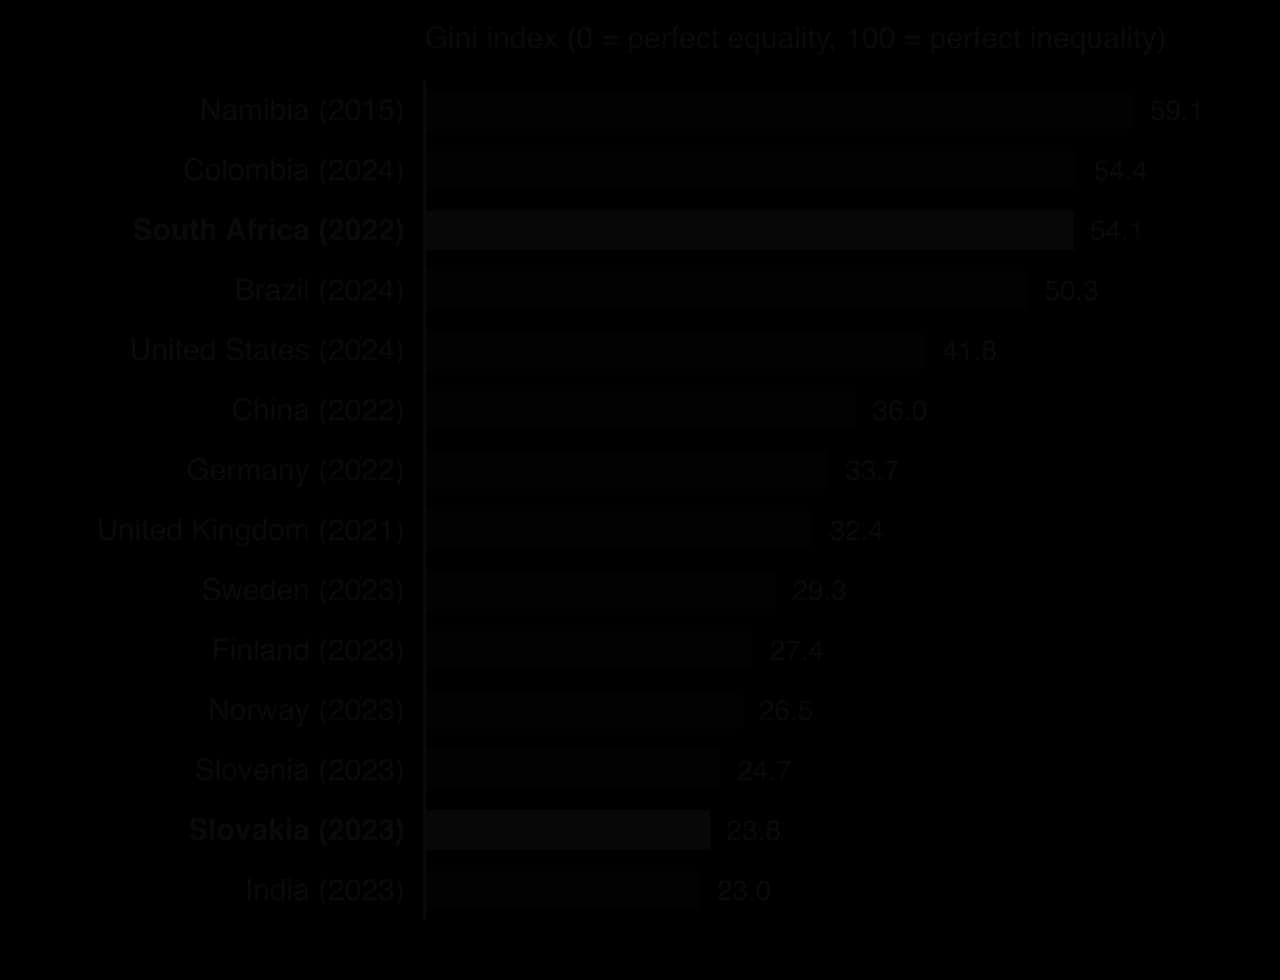
The chart shows how widely inequality varies. South Africa, Namibia, Colombia and Brazil have Gini indices above 50, while most of Europe lies between 24 and 34. Rich countries also differ: the United States, at 41.8, is markedly more unequal than Germany or Norway. These differences reflect history, the structure of the labour market and, above all, how much governments redistribute through taxes and transfers.
When income becomes more equally distributed, the Lorenz curve moves towards the line of perfect equality, area A shrinks and the Gini coefficient falls. When income becomes less equally distributed, the curve moves away from the line, area A grows and the Gini coefficient rises.
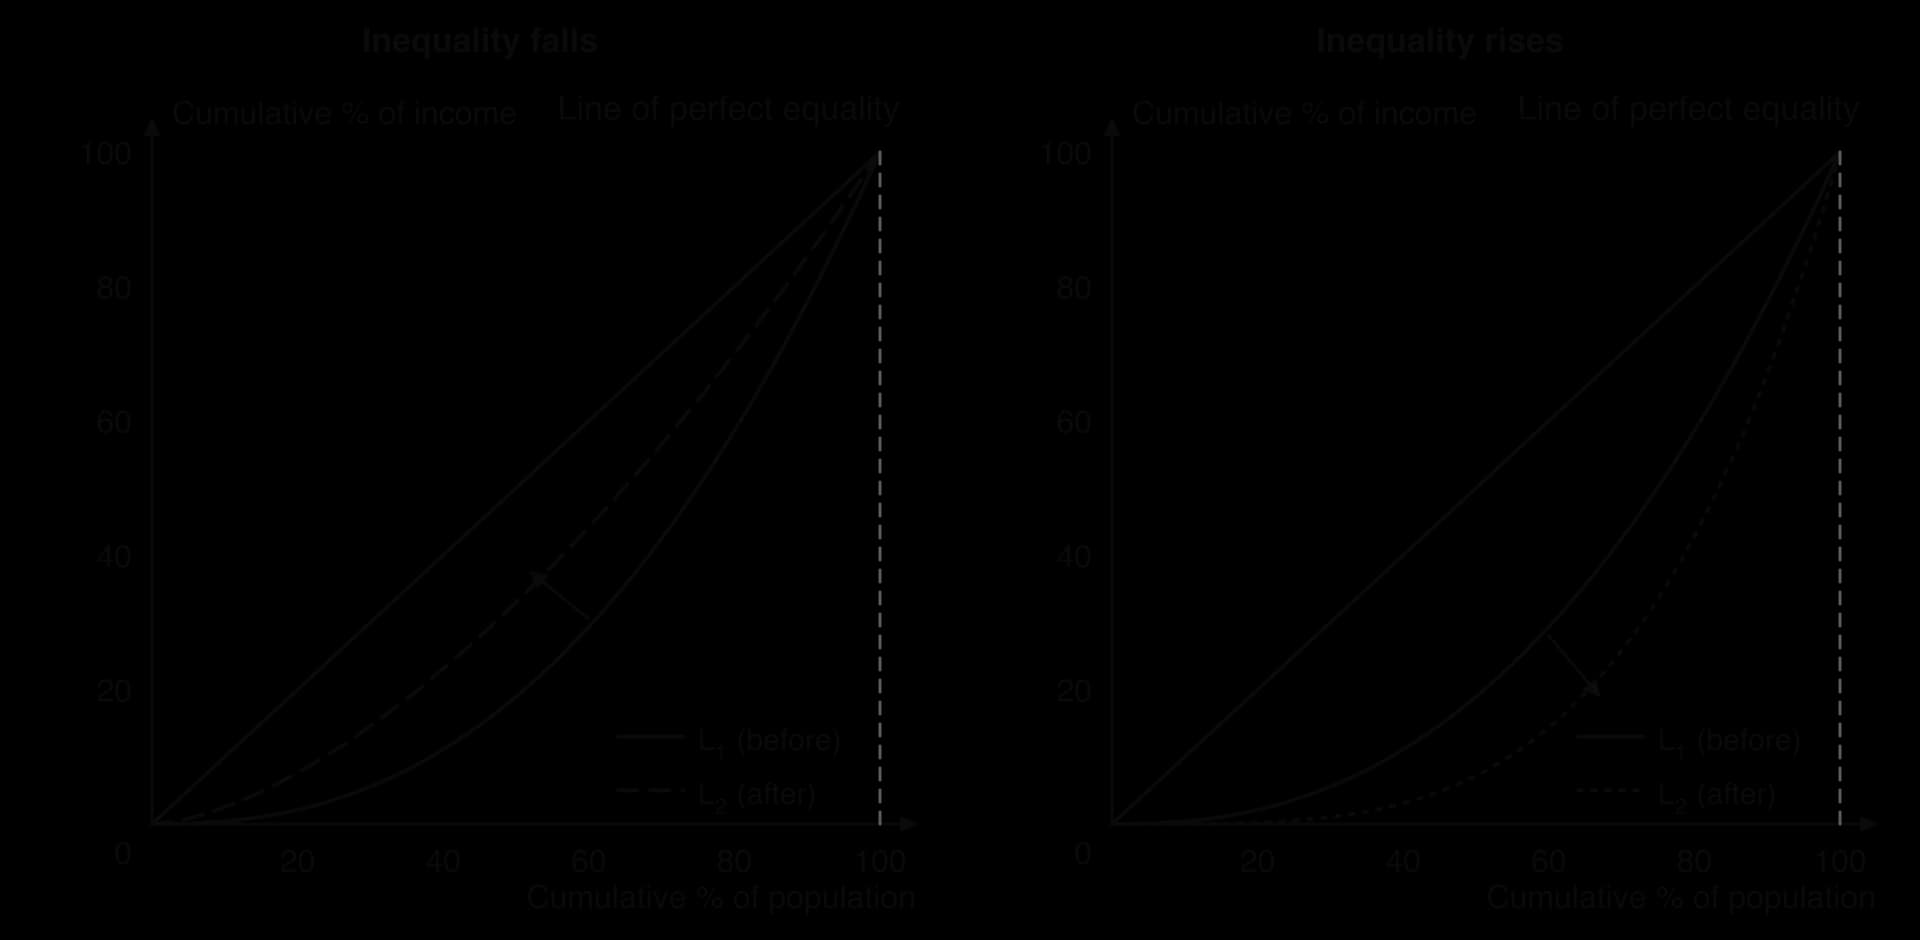
In the left-hand panel, a policy such as a more progressive income tax or larger cash benefits for low-income households raises the share of income going to the poorest groups, so the curve moves from L₁ to L₂, closer to the diagonal. In the right-hand panel, a change such as rapid growth in top salaries, or cuts to benefits, moves the curve from L₁ to L₂, further from the diagonal.
The Gini coefficient is widely used because it condenses the whole distribution into one figure that can be compared across countries and over time, and it is published for most countries by the World Bank and national statistics offices. The Lorenz curve adds detail by showing which part of the distribution is affected.
Both measures have limitations, however:
Different distributions can have the same Gini coefficient. Two Lorenz curves that cross can enclose the same area A. One country may have a very poor bottom group and an equal middle; another may have a rich top group and an equal bottom. The single number hides the difference.
They show relative shares, not living standards. If all incomes double, the Lorenz curve and Gini coefficient do not change, although everyone is better off. A falling Gini can also coincide with falling incomes for everyone, if the rich lose most.
The data differ between countries. Some countries measure income and others consumption. Consumption is more equal than income, because rich households save part of their income and poor households may borrow or receive help. India’s Gini index of 23.0 in 2023 is based on consumption, so it cannot be compared directly with income-based figures for Brazil or the United States.
Surveys miss the very rich and the very poor. Top incomes are under-reported, and homeless people or those in informal work may be left out altogether, so measured inequality is usually too low.
Household size and costs are hard to adjust for. A household income of $50,000 means different living standards for a single person and for a family of five, or in a city and in the countryside.
 YouTube
Statistics agencies usually publish the share of total income (or consumption) received by each quintile. To plot a Lorenz curve, these shares must first be added up cumulatively. The first point is always (0, 0); the second is (20, share of the poorest quintile); the third is (40, share of the poorest two quintiles combined); and so on, until (100, 100). Joining the points gives the Lorenz curve.
The table gives the share of total consumption received by each quintile in Slovakia in 2023 and in South Africa in 2022.
Quintile | Slovakia, share (%) | South Africa, share (%) |
|---|---|---|
Poorest 20% | 9.1 | 3.7 |
Second 20% | 15.3 | 6.9 |
Third 20% | 19.3 | 10.8 |
Fourth 20% | 23.6 | 19.1 |
Richest 20% | 32.8 | 59.5 |
Sources: World Bank, World Development Indicators (2026).
Area B (under the Lorenz curve) can be approximated by five trapeziums, each 0.2 wide. The area of each is 0.2 × (left height + right height) ÷ 2, with heights written as fractions. For South Africa:
The whole triangle under the line of perfect equality has an area of 0.5, so A = 0.5 − 0.252 = 0.248 and the Gini coefficient is 0.248 ÷ 0.5 ≈ 0.50. The published figure, 0.541, is higher, because joining five points with straight lines ignores the inequality within each quintile. The same method gives 0.22 for Slovakia, against a published 0.238.
Inequality is about the gaps between people; poverty is about whether people at the bottom have enough. A country can have low inequality and widespread poverty (if everyone is poor) or high inequality and little extreme poverty (if even the poorest have enough to meet basic needs).
Absolute poverty is defined against a fixed standard of basic needs: enough food, clean water, shelter, clothing and basic health care to survive. Someone in absolute poverty lacks these whatever the living standards around them. Because the standard is fixed in real terms, absolute poverty can in principle be eliminated, and it falls when the incomes of the poorest rise faster than the cost of basic needs.
Relative poverty is defined against the typical living standards of a particular society. A person is relatively poor when their income is so far below the average that they cannot take part in the ordinary life of their community: heating their home, paying for a school trip, owning a phone. Relative poverty is usually measured as income below a set percentage of the median household income, commonly 50% or 60%.
Because the threshold moves with median income, relative poverty is closely linked to inequality. It falls only if the incomes of the poor rise faster than median income. A rise in the incomes of everyone by the same percentage leaves relative poverty unchanged, even though absolute poverty falls.
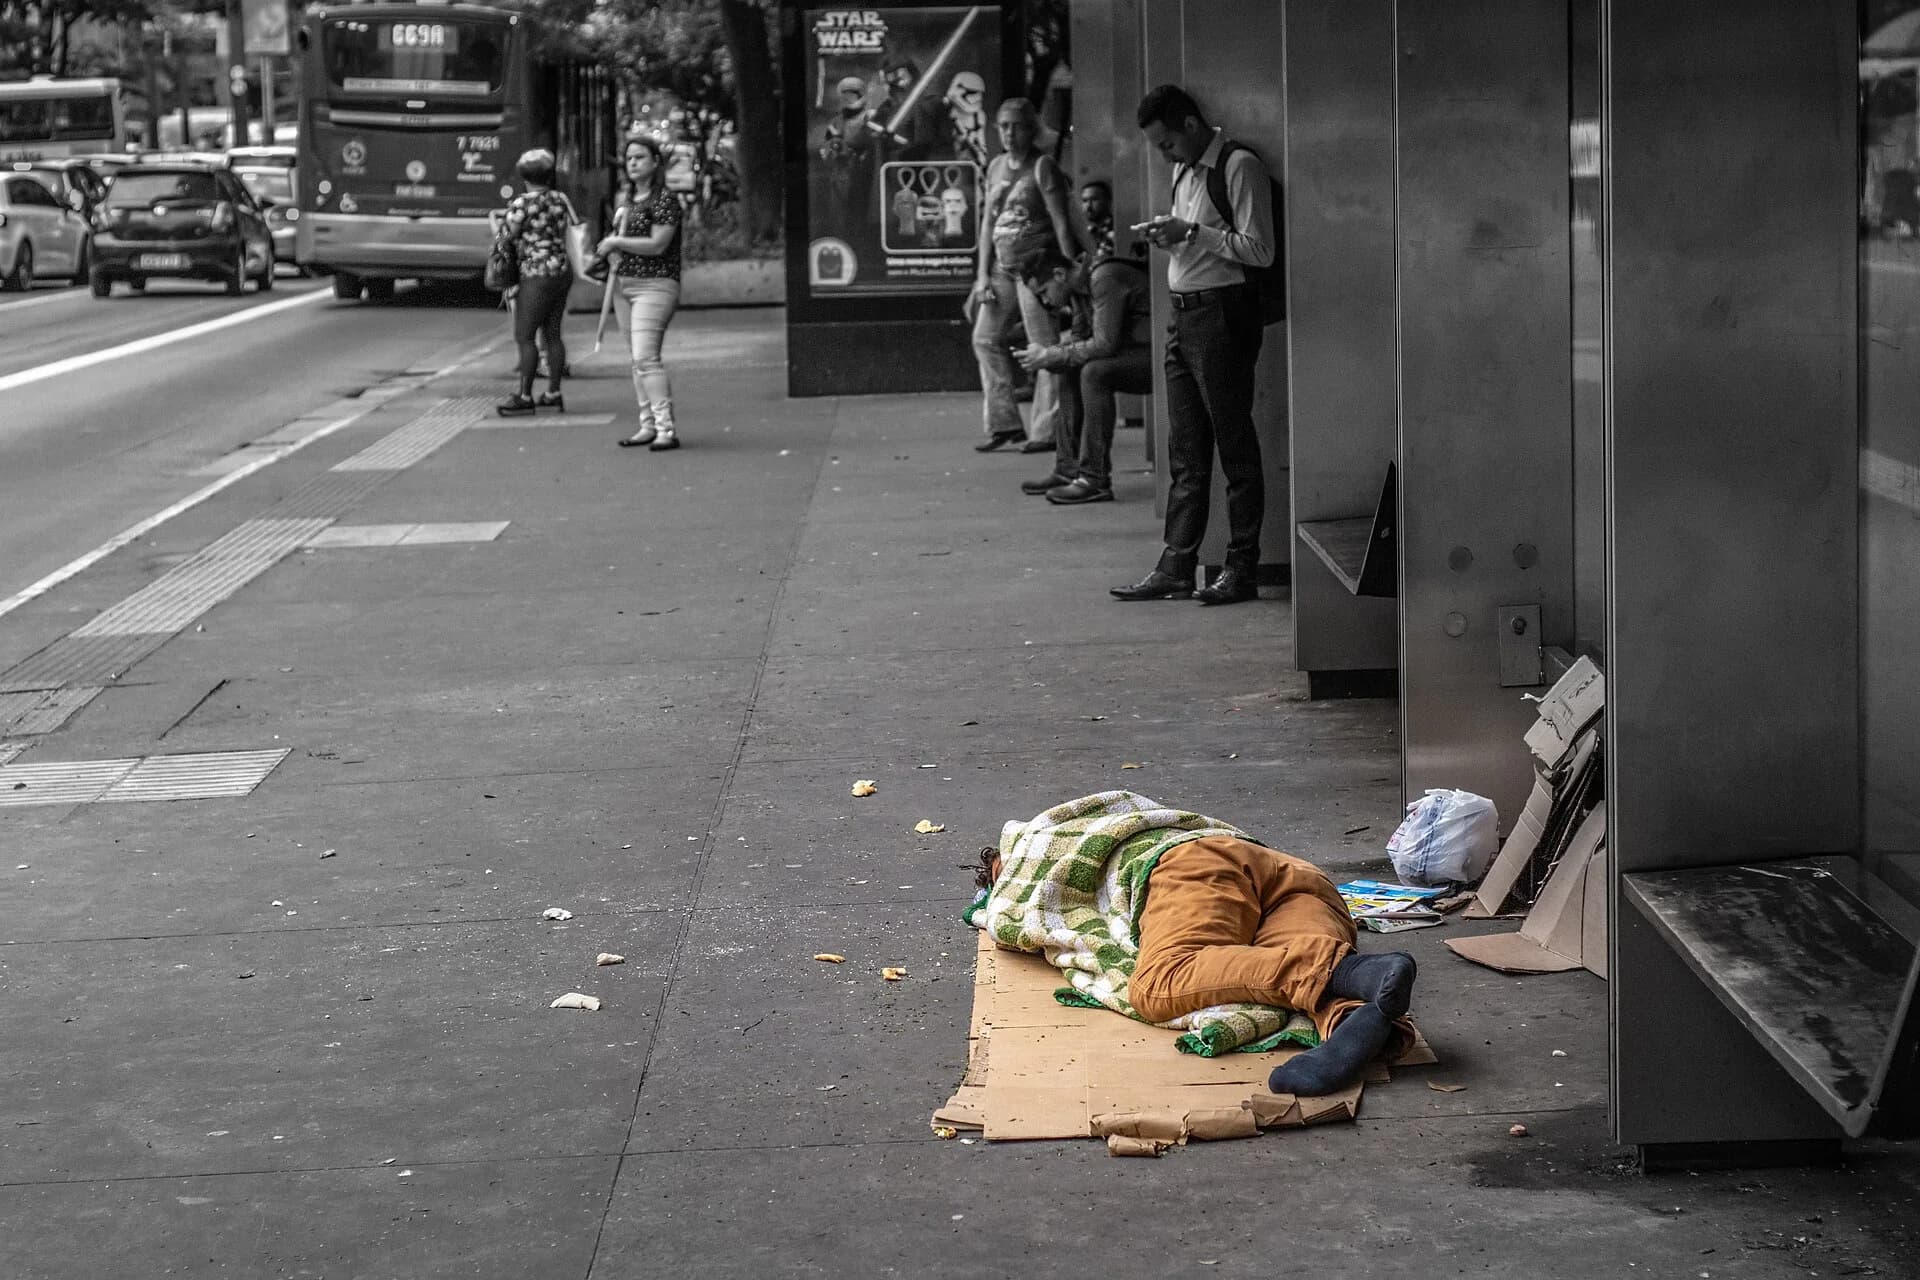
The photograph shows that both ideas matter in the same place. A person sleeping on a pavement lacks shelter, a basic need, so is in absolute poverty. Other residents of the same city may have shelter and food but be in relative poverty, unable to afford what most of their neighbours regard as normal.
Poverty can be measured with a single indicator, usually income or consumption compared with a threshold, or with a composite indicator that combines several kinds of deprivation.
The most widely quoted single indicator is the share of the population living below an international poverty line set by the World Bank. The line is expressed in US dollars a day, converted into each country’s currency at purchasing power parity (PPP) rather than at market exchange rates, so that it buys the same basket of goods everywhere.
The line is revised when new price data become available. In June 2025 the World Bank raised it from $2.15 a day (in 2017 prices) to $3.00 a day (in 2021 prices), reflecting updated estimates of what basic needs cost in the poorest countries. The revision raised the estimated number of people in extreme poverty in 2022 from 713 million to about 838 million, although no one’s actual income had changed.
Sources: World Bank, “June 2025 Update to Global Poverty Lines” (2025).
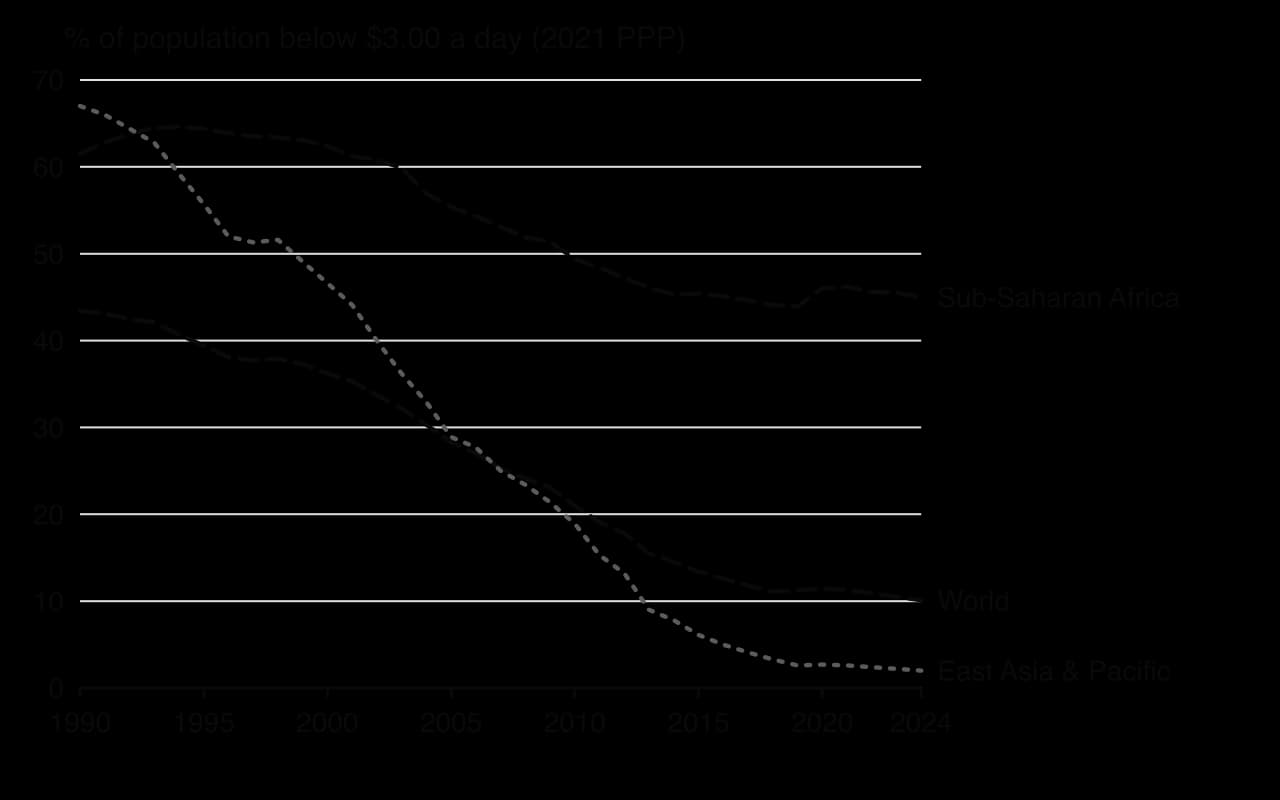
The chart shows the share of people below $3.00 a day. The fall in East Asia and the Pacific, from 67% to 2%, reflects decades of rapid growth in China, Indonesia and Viet Nam. Sub-Saharan Africa’s share has stayed at about 45% since the mid-2010s, so a growing proportion of the world’s extreme poor live there.
Countries also set their own national poverty lines, reflecting local prices and ideas of what is needed. Rich countries mostly use relative lines, such as 60% of median income.
A minimum income standard takes a different approach. Instead of fixing a line in dollars, it asks what goods and services are needed for a minimum acceptable standard of living, prices them, and calculates the income that buys them. The result is a budget for each type of household.
In the United Kingdom, the Minimum Income Standard is calculated each year by groups of members of the public, who negotiate in detail what a household needs, from food and clothing to a mobile phone and the occasional meal out, after which experts check items such as nutrition and heating. In 2025 a single working-age adult needed gross earnings of £30,500 a year to reach the standard, and a couple with two young children needed combined earnings of £74,000. Because the basket reflects current social norms, a minimum income standard is a relative measure grounded in specific needs.
Sources: Joseph Rowntree Foundation, “A Minimum Income Standard for the United Kingdom in 2025” (2025).
Income measures miss deprivations that money does not capture well, such as a lack of schooling, poor health or no electricity in the village. A composite indicator combines several such measures into one.
The best-known composite poverty measure is the global Multidimensional Poverty Index (MPI), published by the United Nations Development Programme (UNDP) and the Oxford Poverty and Human Development Initiative (OPHI). It looks at ten indicators in three equally weighted dimensions. A person is counted as multidimensionally poor if they are deprived in at least one-third of the weighted indicators.
Dimension (weight) | Indicator | Weight of each indicator |
|---|---|---|
Health (1/3) | Nutrition; child mortality | 1/6 each |
Education (1/3) | Years of schooling; school attendance | 1/6 each |
Standard of living (1/3) | Cooking fuel; sanitation; drinking water; electricity; housing; assets | 1/18 each |
The MPI itself is the product of two numbers: the headcount ratio (H), the share of people who are multidimensionally poor, and the intensity (A), the average share of weighted deprivations those poor people experience. The 2025 global MPI covered 109 countries and 6.3 billion people, of whom 1.1 billion were multidimensionally poor; more than half of them were children, and about 740 million lived in middle-income countries.
Sources: UNDP and OPHI, Global Multidimensional Poverty Index (2025).
Every poverty figure rests on choices and data that can be questioned. The main difficulties are:
Choosing the line. Any threshold is partly arbitrary. A person on $2.99 a day is counted as poor and one on $3.01 is not, although their lives are almost the same. Raising the international line in 2025 added about 125 million people to the count without any change in their circumstances.
Converting currencies. PPP rates are estimated from price surveys that are carried out only every few years and may not reflect the prices the poorest people actually pay.
Infrequent and incomplete surveys. Poverty data come from household surveys, which are expensive. South Africa’s internationally comparable figures come from surveys in 2014 and then 2022, with nothing in between. Homeless people, people in institutions and those in conflict zones are often missed.
Income in kind and the informal economy. Many poor households grow their own food or work for cash without records, so their income is hard to measure; consumption is often used instead, but it has its own problems.
Differences within households. Surveys usually measure household income and assume it is shared equally, so poverty among women, children or older relatives within a household can be hidden.
Different costs of living. Housing costs much more in cities than in rural areas, and people with disabilities or long-term illnesses need more income to reach the same living standard.
Relative measures can move oddly. In a recession that cuts middle incomes, relative poverty may fall even though no one is better off, because the median income used to set the line has fallen.
Poverty has many dimensions. Income indicators miss deprivation in health, education and housing, while composite indicators depend on which indicators and weights are chosen.
Inequality and poverty have many causes, which often reinforce each other. Most of them work through the labour market (what people can earn), through the ownership of assets (what income their wealth yields) or through government policy (what taxes and transfers change).
When children from poor families have worse access to education, health care, safe housing and social networks, they enter adult life with fewer skills and contacts, so their earnings are lower. Their own children then face the same disadvantages. Inequality of opportunity therefore turns today’s inequality of outcome into tomorrow’s.
Countries with high inequality tend to have low social mobility, because the gap between the opportunities of rich and poor children is wider. This link means that inequality of opportunity is both a cause and a consequence of unequal incomes.
Income from land, property and capital goes to those who own them. Because ownership of assets is very unequal, so is the income they generate. People who own nothing but their own labour depend entirely on wages and transfers. The unequal ownership of land is a long-standing cause of inequality in many countries: in South Africa, the Natives Land Act of 1913 reserved only about 7% of the land, later 13%, for the black majority, and the effects on ownership and income persist.
Inheritance passes this unequal ownership to the next generation. A child who inherits a house or a business receives an income and a safety net that a child without an inheritance lacks.
Human capital is the stock of skills, knowledge, education, experience and health that makes a worker productive. Workers with more human capital are more productive, so firms are willing to pay them more. Differences in education and training are among the most important causes of differences in wages within a country.
Poverty itself reduces human capital, which creates a self-reinforcing cycle of poverty. A family on a low income cannot afford good nutrition or health care, children may leave school early to earn money, and adults have no savings to pay for training.
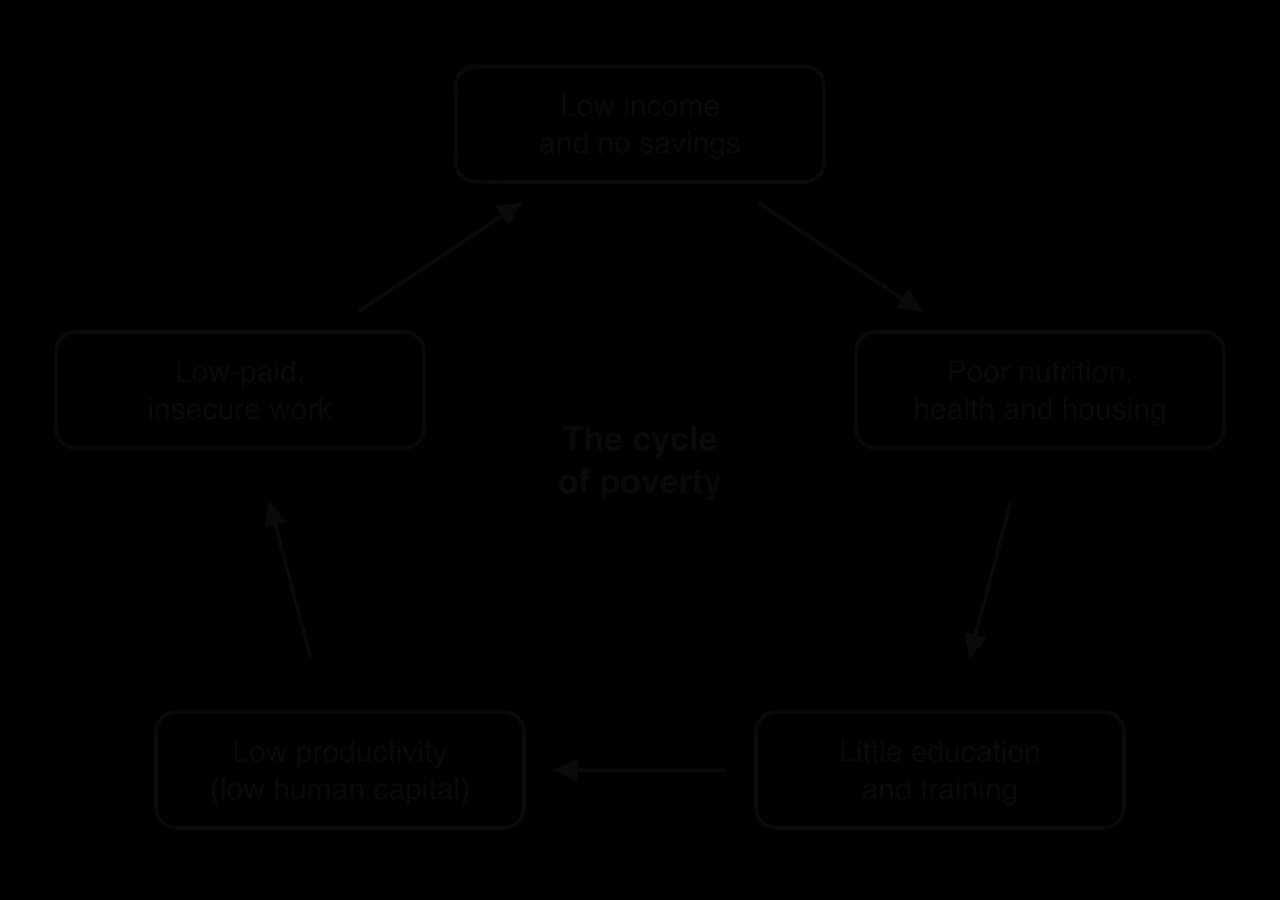
The diagram shows how the cycle closes. Policies that act on one link, such as free school meals (nutrition), free primary education (schooling) or training programmes (productivity), can allow a household to escape, which is why many anti-poverty policies target human capital rather than income alone.
Discrimination occurs when people are treated differently in the labour market, in education, in housing or in access to credit because of characteristics unrelated to their productivity, such as gender, race, ethnicity, religion, age, disability or sexual orientation.
Discrimination lowers the incomes of the groups affected in several ways. They may be paid less for the same work, passed over for promotion, kept out of high-paying occupations, or denied loans to start a business. Past discrimination also leaves lasting effects through lower wealth and human capital, even after discriminatory laws are abolished.
Gender is the most widely measured case, through the gender pay gap.
Among full-time employees in 2024, it was about 29% in South Korea, 21% in Japan and 13% in the United Kingdom, while in Belgium it was close to 1% in 2022. Part of the gap reflects differences in occupations and in hours after childbirth, which themselves can reflect social norms and discrimination; part is unexplained by measured characteristics.
Sources: OECD, Earnings and wages database: gender wage gap, median earnings of full-time employees (2026).
Incomes also depend on bargaining power. Workers who belong to a labour union, or who have skills that few others have, can negotiate higher pay; workers in insecure, informal or casual jobs cannot. Where one or a few employers dominate a local labour market, they can hold wages down. The decline of union membership in many high-income countries since the 1980s has weakened the bargaining power of lower-paid workers.
Power also works through politics. Wealthy individuals and large firms can influence tax rules, regulations and public spending through lobbying and donations, while poorer groups have less voice. Groups with low social status, such as some castes, migrants or ethnic minorities, may be excluded from good jobs, land ownership or public services altogether.
Governments change the distribution of income through taxes and transfers, so their choices can widen or narrow inequality. A tax system that relies heavily on indirect taxes, which take a larger share of low incomes, increases inequality. Low or poorly targeted benefits leave households without work far below the poverty line: in the United Kingdom, households relying on out-of-work benefits reach only about a quarter of the Minimum Income Standard. Cuts in top income tax rates or in taxes on wealth and inheritance increase the share of income kept by the richest.
Sources: Joseph Rowntree Foundation, “A Minimum Income Standard for the United Kingdom in 2025” (2025).
Globalisation has helped to reduce inequality between countries, as economies such as China and Viet Nam grew rapidly by exporting manufactured goods. Within high-income countries, however, it has tended to increase inequality. Low-skilled manufacturing jobs moved to lower-wage economies, reducing demand for low-skilled workers, while highly skilled workers and owners of capital gained from larger global markets.
Technological change has had a similar effect. Computers, automation and, more recently, artificial intelligence replace many routine tasks done by middle- and low-skilled workers, while raising the productivity and pay of highly skilled workers who use the technology. Economists call this skill-biased technological change. It widens the gap between the wages of graduates and non-graduates, and it can concentrate profits in a few firms whose platforms serve the whole world.
Market-based supply-side policies aim to increase the economy’s productive capacity by strengthening market forces. Several of them tend to increase inequality, at least in the short run. Cuts in the top rates of income tax and in corporate tax raise the incomes of the highest earners and of shareholders.
Reducing the power of labour unions and the protection of workers (labour market flexibility) can lower the wages and job security of less-skilled workers. Cutting unemployment benefits to increase the incentive to work reduces the income of those who cannot find work. Privatisation may raise prices for essential services such as water or electricity, which take a larger share of the budgets of poor households.
Supporters argue that faster growth eventually raises the incomes of everyone, including the poor; critics point out that the gains may be concentrated at the top for long periods.
Cause | How it increases inequality or poverty |
|---|---|
Inequality of opportunity | Children from poor families get less education and health care, so they earn less as adults. |
Resource ownership | Income from land, property and capital goes to those who own them; inheritance passes this on. |
Human capital | Low skills mean low productivity and low wages; the cycle of poverty keeps them low. |
Discrimination | Groups are paid less, kept out of good jobs or denied credit for reasons unrelated to productivity. |
Status and power | Weak bargaining power and little political influence hold down wages and public support. |
Tax and benefit policies | Regressive taxes and low benefits leave the poorest with less. |
Globalisation and technology | Demand for low-skilled workers falls while high-skilled workers and capital owners gain. |
Market-based supply-side policies | Lower top tax rates, weaker unions and benefit cuts shift income towards the top. |
Whether inequality is a problem depends partly on values, but it also has economic consequences that can be analysed. The evidence points in different directions, so the effects are open to debate.
Some inequality may support economic growth. Higher rewards for skills, effort and risk-taking give people an incentive to study, work hard and start businesses. High-income households save a larger share of their income, and these savings can finance investment in capital goods. On this view, policies that compress incomes too much can weaken incentives and slow growth.
High inequality can also hold growth back. When many people are poor, they cannot afford education or health care, so the economy’s stock of human capital is lower than it could be, and talented children from poor families never reach their potential. Because poor households spend a larger share of their income than rich ones, concentrating income at the top can reduce consumption and aggregate demand. Very unequal societies may also face political pressure for sudden, poorly designed policy changes, which discourages investment.
Cross-country research has found that higher inequality is associated with slower and less durable growth, and that moderate redistribution does not on average harm growth. The relationship is not settled, however: it depends on the level of inequality, its causes and how redistribution is carried out.
Sources: Ostry, Berg and Tsangarides, “Redistribution, Inequality, and Growth”, IMF Staff Discussion Note SDN/14/02 (2014).
For a given level of GDP per capita, a more unequal distribution means that more people live in poverty and that average figures overstate how well most people live. Because an extra dollar adds more to the well-being of a poor person than to that of a rich person, a more equal distribution of the same total income tends to raise overall well-being.
Inequality also shapes access to essential services. Where health care, education and housing are provided mainly through markets, the poor receive less and lower-quality provision, so gaps in life expectancy and health between rich and poor can be large. Wealth inequality adds insecurity: households with no savings are pushed into poverty by an illness or the loss of a job.
High inequality is associated with higher crime rates, lower trust between groups and more political conflict. When large groups believe that the economic system is unfair and that they have no chance of improving their position, support for institutions can weaken and protests or unrest become more likely. Social instability in turn harms investment and growth, as firms are reluctant to invest where property and contracts are insecure. These links are associations rather than proven causes, and other factors, such as the quality of institutions, history and ethnic divisions, also matter.
Key concept | How it applies to inequality and poverty |
|---|---|
Equity | Whether a distribution is fair is a normative judgment; vertical and horizontal equity guide tax and benefit design. |
Economic well-being | Poverty means low well-being; a more equal distribution of the same income tends to raise total well-being. |
Efficiency | Redistribution may weaken incentives, but wasted human capital among the poor is also inefficient. |
Intervention | Taxes, transfers, minimum wages and spending on services change the market distribution of income. |
Change | Globalisation and new technology change which skills are rewarded, and so the distribution of income. |
A reasoned judgment is that extreme inequality is likely to harm growth, living standards and social stability, while some inequality is a normal result of differences in skills, effort and age. Policy debates therefore focus on which inequalities to reduce, such as those caused by unequal opportunities, and on which policies reduce them at the lowest cost.
Taxes fund the public services and transfers that support the poor, and the way they are designed changes the distribution of income directly. Their effect depends on what is taxed and on how the tax changes with income.
A direct tax is paid by a person or firm directly to the government on their income or wealth. An indirect tax is a tax on spending, collected from the seller and passed on, in whole or part, to the buyer in a higher price.
Indirect taxes include value added tax (VAT) or general sales taxes, and excise duties on goods such as fuel, alcohol and tobacco. Their impact on markets, through a shift in supply, is analysed in microeconomics; for inequality, what matters is who bears them as a share of income.
Taxes are classified by how the share of income paid in tax changes as income rises. That share is the average tax rate. The share of each additional unit of income paid in tax is the marginal tax rate.
The average tax rate shows the overall burden of a tax on a person. The marginal tax rate shows the incentive effect of the tax, because it is the share of any extra income that goes to the government.
Using the average tax rate, three types of tax can be distinguished: progressive, proportional and regressive taxes.
Most personal income taxes are progressive, because income is divided into bands, each taxed at a higher rate than the band below. A progressive tax reduces inequality, since it takes a larger share from high incomes.
A proportional tax takes the same share from everyone, so it leaves the distribution of income unchanged in percentage terms, although high earners still pay more in absolute amounts.
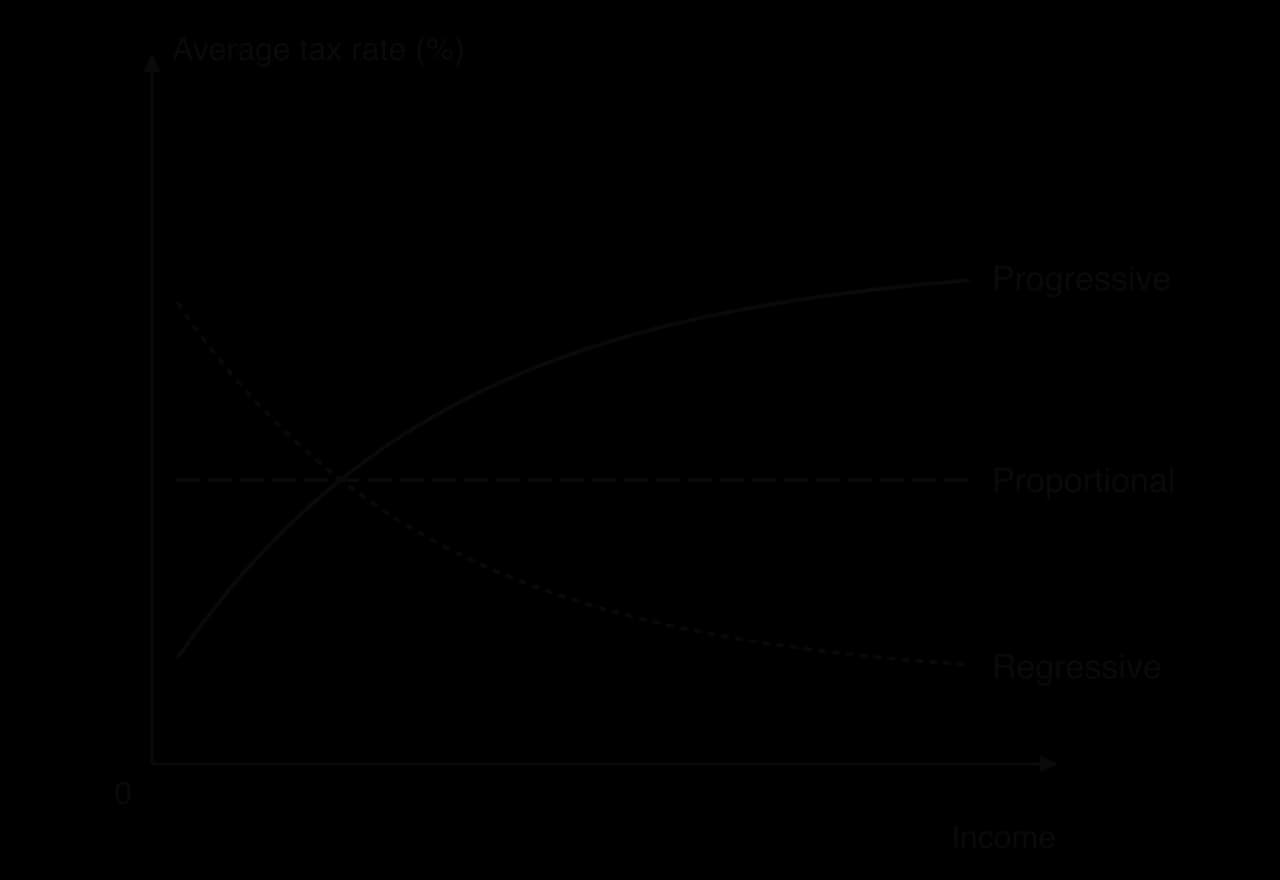
The diagram plots the average tax rate against income for each type. A regressive tax increases inequality, because it takes a larger share of low incomes, even when rich people pay more in absolute amounts.
Personal income tax is the main progressive tax in most countries. A tax-free allowance means that the first part of everyone’s income is not taxed, and higher bands are taxed at rising rates. Because only the income within each band is taxed at that band’s rate, the average tax rate rises gradually and always stays below the top marginal rate.
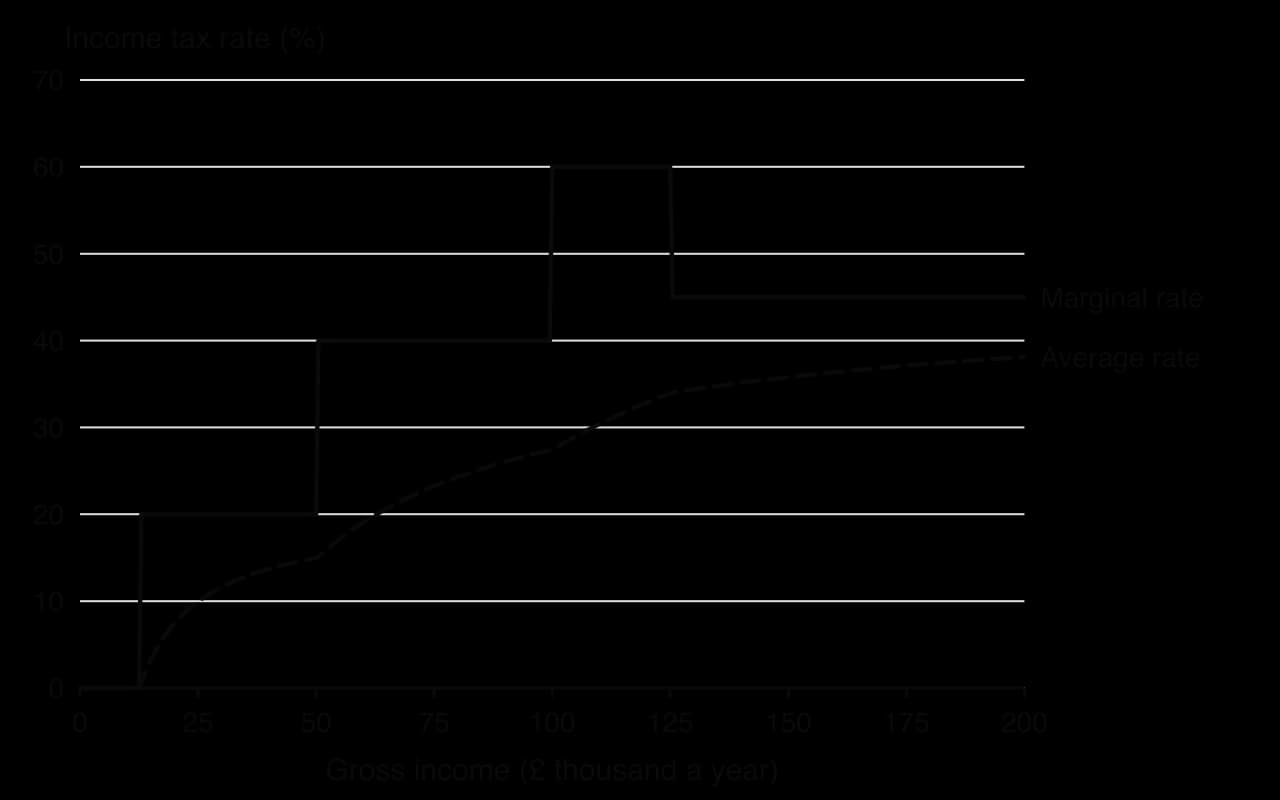
The chart applies the United Kingdom’s 2026/27 income tax schedule for England: 0% on the first £12,570, 20% up to £50,270, 40% up to £125,140 and 45% above. Because the tax-free allowance is reduced by £1 for every £2 of income above £100,000, each extra pound in that range costs 40p of tax plus 20p from the lost allowance, a marginal rate of 60%. The average rate rises steadily, so the tax is progressive throughout.
Corporate income tax is a tax on company profits. Because shares are owned mostly by higher-income households, taxing profits reduces the income of the richest and so tends to reduce inequality. Its effect is weakened because firms can shift profits to low-tax countries, and because part of the tax may fall on workers through lower wages or on consumers through higher prices.
Since wealth is more unequal than income, taxing it directly could reduce inequality more than income tax alone. A wealth tax is a yearly tax on the net value of a person’s assets above a threshold. Related taxes fall on wealth when it changes hands or grows, such as inheritance taxes and taxes on capital gains.
In practice wealth taxes are rare and raise little revenue. Twelve OECD countries had a net wealth tax in 1990, but only five did by 2017. France replaced its general wealth tax with a tax on real estate only in 2018. The difficulties are that assets such as private businesses and art are hard to value, wealthy people can move themselves or their assets abroad, and those with valuable assets but low incomes may struggle to pay. Norway is one of the few countries that keeps a net wealth tax.
Sources: OECD Global Revenue Statistics Database, as summarised in “Wealth tax”, Wikipedia (2026).
An indirect tax is charged at the same rate whoever buys the good, so at first sight it seems proportional. Its burden on incomes is regressive, however, because low-income households spend a larger share of their income, while high-income households save part of theirs. The same tax rate applied to spending therefore takes a larger percentage of a low income.
Excise duties on goods such as tobacco, alcohol and fuel are often even more regressive, because spending on them does not rise in proportion to income. For the same reason, a rise in the price of necessities hits the poor hardest: during the 2021–23 surge in food and energy prices, low-income households were affected most, since food and energy take a larger share of their budgets.
The method depends on whether the amount spent is before or after the tax is added. If the price before tax is given, the tax is the rate multiplied by that price. If the amount spent already includes the tax, as shop prices usually do, the tax is a fraction of the spending: with a rate of t%, the fraction is t ÷ (100 + t).
In a banded income tax, each slice of income is taxed at the rate for its band. Total tax is found by working out the tax on each slice and adding them. The average tax rate is then total tax divided by total income.
Country X has the following income tax schedule (hypothetical data).
Taxable income band | Marginal tax rate |
|---|---|
$0–10,000 | 0% |
$10,001–30,000 | 10% |
$30,001–80,000 | 25% |
Above $80,000 | 40% |
£12,570 is tax free. The basic-rate band covers the next £37,700 (up to £50,270), taxed at 20%: £7,540. The remaining £9,730 is taxed at 40%: £3,892. Total tax is £11,432, an average rate of 11,432 ÷ 60,000 × 100 = 19.1%, while the marginal rate is 40%.
Taxes and cash transfers together can change the distribution of income substantially. In the United Kingdom in the financial year ending 2024, the Gini coefficient of original income (before any taxes or benefits) was 0.476 (reported as 47.6%). Cash benefits reduced it to 0.373, and direct taxes reduced it further to 0.329. The richest fifth of households had 12.2 times the original income of the poorest fifth, but only 3.3 times as much after all taxes and benefits, including the value of services such as education and health care.

The chart shows that most of the reduction in inequality comes from cash benefits, which are financed by taxes, rather than from the progressive structure of taxes alone. Taxation reduces inequality most when it pays for transfers and services that go to low-income households.
Strengths of using taxation:
Progressive income taxes take a larger share from high incomes, directly narrowing the gap after tax.
Tax revenue funds transfer payments and public services, which do most to raise the living standards of the poor.
Taxes on wealth, inheritance and capital gains address the most unequal part of the distribution and the passing of advantage between generations.
Reducing reliance on regressive indirect taxes, or exempting necessities such as basic food from VAT, lowers the burden on the poor.
Limitations:
Disincentives. High marginal rates may reduce the incentive to work longer hours, take a promotion or start a business, and may slow growth. The evidence suggests these effects exist but are usually modest except at very high rates.
Avoidance and evasion. High earners and firms can use legal loopholes (tax avoidance) or illegal concealment to reduce their tax, and can move income or residence to low-tax countries.
Limited reach in lower-income countries. Where much work is informal, few people pay income tax, so governments rely on indirect taxes, which are regressive.
Wealth is hard to tax. Valuation problems and capital flight explain why few countries keep wealth taxes.
Taxes alone do not lift people out of poverty. A person with no income pays no income tax, so a progressive tax cannot raise their income; that requires spending on transfers and services.
The effectiveness of taxation therefore depends on the design of the whole system, the capacity of the tax authority, and above all on how the revenue is spent. A balanced judgment is that progressive direct taxes are an effective tool for reducing inequality in countries with strong tax administration, but they must be combined with spending on transfers and human capital to reduce poverty.
Governments use many other tools. Some raise the incomes of the poor directly; others aim to change the causes of low income, especially low human capital and discrimination.
Spending on education, training and health raises the productivity and future earnings of children and workers from poor backgrounds. Examples include free and compulsory schooling, early-years education, school meals, scholarships for university, vocational training, and free or subsidised health care. Because human capital is the main source of income for people who own few assets, these policies attack a root cause of poverty and can break the cycle of poverty.
Some programmes combine cash with investment in human capital. A conditional cash transfer pays poor families on condition that their children attend school and have health check-ups. Brazil’s Bolsa Família, launched in 2003, is a large example; Brazil’s Gini index fell from 58.4 in 2001 to 51.9 in 2015, a fall to which economists attribute several causes, including such transfers and rises in the minimum wage.
Sources: World Bank, World Development Indicators (2026).
Evaluation. Investment in human capital tends to be the most effective long-run policy, since it raises incomes through higher productivity rather than through transfers, and it supports growth at the same time. Its effects take many years to appear, however, and the quality of schools and health care matters as much as spending. It does little for adults who are already poor today, so it must be combined with other measures.
Transfer payments are payments from the government to individuals for which no good or service is given in return. They include old-age pensions, unemployment benefits, child benefits, disability benefits and housing support. They are not part of GDP, because they transfer existing income rather than pay for new output.
Transfers may be universal (paid to everyone in a group, such as all pensioners) or a means-tested benefit, paid only to those whose income or wealth is below a limit.
Evaluation. Transfers raise the incomes of the poor immediately, which makes them the most direct way to reduce poverty, and they act as an automatic support during recessions. Means-tested benefits are cheaper and better targeted than universal ones, but they create problems of their own. Some people who are entitled to them do not claim, because of complex rules or stigma. Because benefits are withdrawn as earnings rise, a low-income worker can lose much of each extra dollar earned, a very high effective marginal tax rate that weakens the incentive to work more. Universal benefits avoid these problems but cost far more, so they require higher taxes.
Instead of giving cash, governments can use targeted spending, providing or subsidising particular goods and services for low-income groups: free school meals, social housing at below-market rents, free health care, subsidised public transport, or food vouchers.
Evaluation. Targeted spending ensures that support is used for necessities and directly improves health, education and housing, which also builds human capital. It can be more acceptable to taxpayers than cash. It is less flexible than cash, however, because families cannot choose what they need most, it can be expensive to administer, and targeting may miss some poor households. Subsidised goods may also be resold or used by people who are not poor.
A universal basic income (UBI) is a regular cash payment made by the government to every adult, whether or not they work and whatever their income, with no conditions attached. It would replace some or all existing benefits.
Supporters argue that a UBI would end poverty traps, because the payment is not withdrawn when a person earns more, so every extra dollar earned is kept apart from income tax. It would be simple to administer, carry no stigma, reach everyone who is entitled, and give people security to retrain, care for relatives or start a business, which may matter more as automation changes the labour market.
Finland carried out one of the best-known tests. From January 2017 to December 2018, 2,000 unemployed people aged 25 to 58, chosen at random, received €560 a month unconditionally, even if they found work. Employment among them barely differed from a control group, but recipients reported less stress, fewer health problems and more confidence in the future. The government did not extend the experiment.
Sources: “Universal basic income pilots”, Wikipedia, summarising Kela results (2026).
 YouTube
Evaluation. The main objection is cost. A payment large enough to live on, given to every adult, would require very large increases in taxes, while a payment small enough to afford would not lift people out of poverty. Paying the same amount to the rich and the poor spreads resources thinly, so a UBI reduces poverty less per dollar than targeted benefits. Critics also fear that it would reduce the incentive to work, although small experiments, such as Finland’s, have found little effect. Because pilots are small, temporary and limited to particular groups, they cannot show how a permanent national UBI would affect work, prices and public finances.
Governments can pass laws that make discrimination in hiring, pay, promotion, housing and education illegal, such as equal pay laws requiring equal pay for work of equal value. Other measures include requiring large firms to publish their gender pay gaps, funding affordable childcare and parental leave so that women are not penalised for having children, and affirmative action policies that set targets for the representation of disadvantaged groups in education or employment.
Evaluation. Anti-discrimination policies address an unfair cause of inequality and also raise efficiency, since workers are matched to jobs by ability. Laws are hard to enforce, however, because discrimination is often hidden in hiring and promotion decisions, and they cannot quickly undo the effects of past discrimination on wealth and education. Affirmative action is controversial: supporters see it as necessary to overcome entrenched disadvantage, while critics argue that it can be unfair to individuals and may benefit mainly the better-off members of the groups concerned.
A minimum wage is a legal floor on the hourly wage that employers may pay. It is a form of price floor in the labour market. Its aim is to raise the incomes of the lowest-paid workers and reduce in-work poverty.
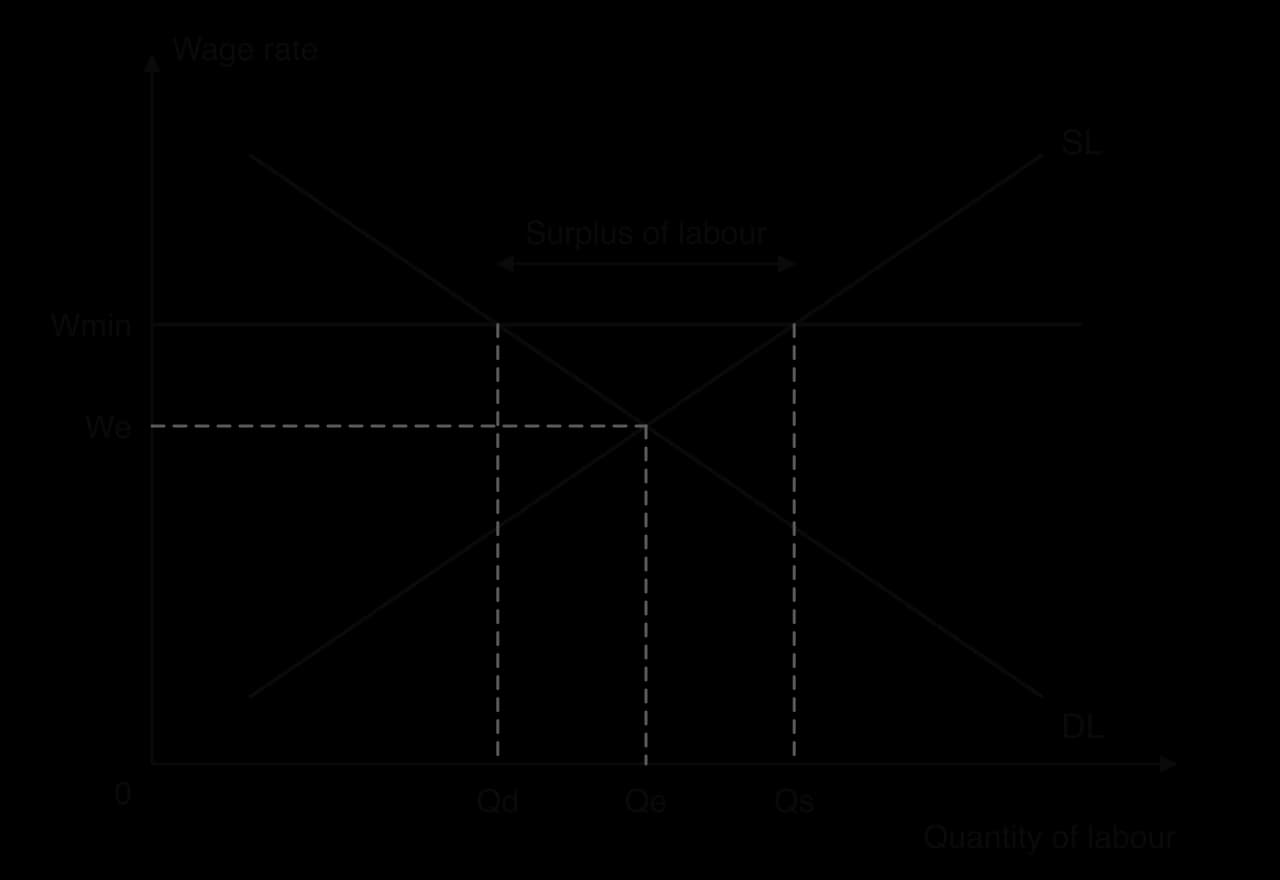
The diagram shows a competitive labour market with an equilibrium wage We and employment Qe. A minimum wage Wmin set above We raises the pay of workers who keep their jobs, but firms now employ only Qd workers, while Qs workers want jobs at that wage. The difference, Qs − Qd, is a surplus of labour, or unemployment, in this model.
In practice, employment often falls less than this simple model predicts. Where employers have power to hold wages down, a moderate minimum wage can raise both pay and employment. Higher pay may also improve workers’ motivation and reduce staff turnover, raising productivity. The demand for low-paid labour is often wage-inelastic in the short run, so the job losses are small.
Evaluation. Minimum wages raise the pay of millions of low-paid workers at little cost to the government, and they reduce the gap between low and middle earners. They do not help people without work, who are often the poorest, and a minimum wage set too high, especially in poorer regions, may cost jobs or push work into the informal economy.
A minimum wage alone may not be enough to escape poverty. In the United Kingdom, full-time work at the National Living Wage of £12.21 an hour in April 2025 took a single adult to only 76% of the Minimum Income Standard. Minimum wages work best alongside in-work benefits and lower taxes on low earners.
Sources: Joseph Rowntree Foundation, “A Minimum Income Standard for the United Kingdom in 2025” (2025).
Policy | Main strength | Main limitation | Time frame |
|---|---|---|---|
Progressive taxation | Takes more from high incomes; funds transfers | Disincentives, avoidance; cannot raise incomes of the poorest by itself | Immediate |
Investment in human capital | Tackles a root cause; raises productivity and growth | Slow, costly; quality matters | Long run |
Transfer payments | Raise incomes of the poor directly | Cost; low take-up; high effective marginal tax rates | Immediate |
Targeted spending on goods and services | Ensures necessities are met; builds human capital | Less choice; administration; may miss some poor | Short to medium run |
Universal basic income | Simple, no stigma, keeps work incentives at the margin | Very expensive; spreads money thinly | Immediate |
Anti-discrimination policy | Removes an unfair cause; improves efficiency | Hard to enforce; slow to undo past effects | Medium to long run |
Minimum wage | Raises low pay at little fiscal cost | Does not help the jobless; possible job losses | Immediate |
No single policy is sufficient. Transfers relieve poverty now, while investment in human capital and anti-discrimination policies reduce the causes of poverty in the future, and progressive taxes provide the revenue for both. The best combination depends on a country’s level of income, the capacity of its government to collect taxes and target benefits, and how much weight society places on equity relative to other objectives.
South Africa is one of the most unequal countries in the world. Its Gini index, measured on consumption, was 59.3 in 1993, the year before the end of apartheid, and 54.1 in 2022. In 2022 the richest 10% of the population accounted for 42.1% of consumption and the poorest 20% for 3.7%. Among countries with surveys since 2020, only Colombia recorded a slightly higher figure; Namibia, Botswana and Eswatini had higher indices in their latest surveys, from 2015–16.
This inequality has its roots in unequal resource ownership, human capital and power. Under laws dating back to the Natives Land Act of 1913, the black majority was confined to a small share of the land, denied access to good schools and skilled jobs, and prevented from building up wealth.
Since 1994 these laws have gone, but their effects remain: wealth, land and skills are still unequally distributed, and unemployment is very high, at an estimated 32% of the labour force in 2025, so a large share of households have no earned income at all.
The government’s main response has been a large system of social grants, which are transfer payments. They include an old-age pension, a disability grant and a child support grant, which are means-tested and paid monthly. During the COVID-19 pandemic in May 2020 the government added a Social Relief of Distress grant for unemployed adults with no other income, paid at R350 a month and later R370. By early 2026 about 26.5 million people, roughly two in five South Africans, received a grant. In 2026 the child support grant was R580 a month and the old-age pension R2,400.
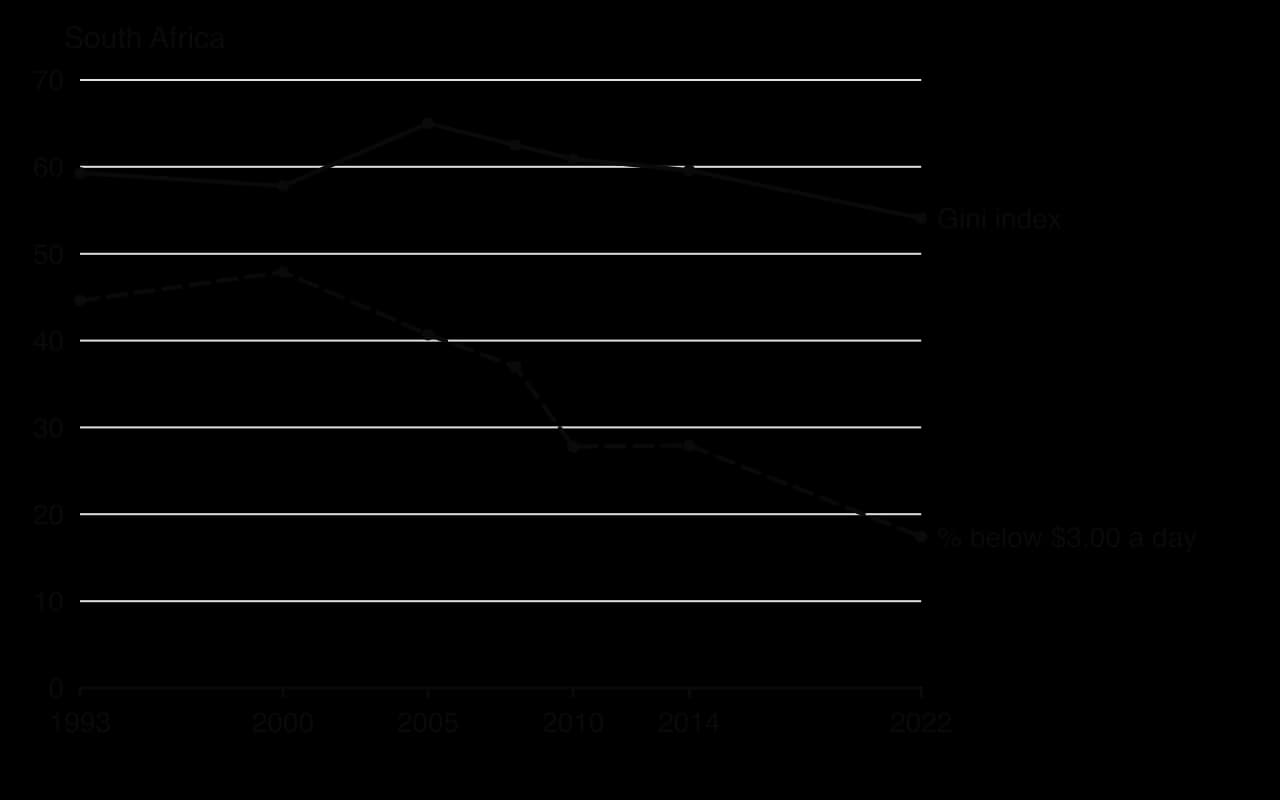
The chart shows that the share of South Africans living on less than $3.00 a day fell from 47.9% in 2000 to 17.4% in 2022, while the Gini index peaked at 65.0 in 2005 and stayed above 59 until 2014. The expansion of grants is one of the main reasons for the fall in absolute poverty: the transfers are large relative to the incomes of the poorest households, so they lift many above the international poverty line. The national poverty rate, measured against South Africa’s own higher line, was still 37.9% in 2022.
South Africa’s experience shows the difference between reducing absolute poverty and reducing inequality. Grants raise the floor, but the Gini index is driven mainly by the labour market: the gap between those with skilled, formal jobs and the millions with no work at all. Transfers cannot close that gap without much larger spending, and spending on grants excluding the distress grant was already budgeted at about R246.6 billion in 2025/26. The distress grant has been extended year by year, most recently to March 2027, so its future is uncertain.
Grants have limits as a policy. They relieve poverty but do not by themselves raise human capital or create jobs, so long-run progress depends on better education, skills and faster growth. Some critics argue that high dependence on grants weakens the incentive to search for work, although the grants are small compared with wages and much of the unemployment is structural.
Evidence on the effects is also limited: internationally comparable surveys exist only for 2014 and 2022, so changes in between cannot be tracked. A reasonable judgment is that South Africa’s grants have been effective in reducing absolute poverty, but that reducing its extreme inequality requires policies that raise the human capital and employment of the poor, and possibly greater redistribution of wealth and land.
Sources: World Bank, Poverty and Inequality Platform and World Development Indicators, including ILO modelled unemployment estimates (2026); “Natives Land Act, 1913”, Wikipedia (2026); “South African Social Security Agency”, Wikipedia (2026); National Treasury, Budget Speech and Budget Review (February 2026).
Inequality and poverty appear in every paper. Paper 1 questions often ask you to explain causes of inequality or poverty in part (a) and to evaluate a policy in part (b). Paper 2 commonly asks you to define poverty or tax terms, draw a Lorenz curve, and evaluate a government’s policy using the text. At HL, Paper 3 tests the Lorenz construction and tax calculations, and may ask you to recommend a policy to reduce poverty.
Paper 2-style short questions. Try these before opening the answers.
Define the term relative poverty. [2]
Distinguish between a progressive and a regressive tax. [2]
Draw a Lorenz curve diagram to show the effect of a more progressive income tax on the distribution of income. [4]
A country’s Gini coefficient rose from 0.31 to 0.36 over ten years. Explain what this shows about the distribution of income. [2]
Using information from the text and your knowledge of economics, evaluate the government’s plan to raise the minimum wage by 10% as a way to reduce poverty. [15]
1. Relative poverty is a situation in which a household’s income is well below the typical income in its society, usually measured as below 50% or 60% of median income. (2 marks need the comparison with others in the same society and some indication of how it is measured.)
2. A progressive tax takes a rising percentage of income as income rises (the average tax rate rises), while a regressive tax takes a falling percentage of income as income rises (the average tax rate falls).
3. Correctly labelled axes (cumulative % of population; cumulative % of income), the line of perfect equality, an original Lorenz curve L₁ and a new curve L₂ closer to the line of perfect equality, with an arrow. Explanation: the tax takes a larger share of high incomes, so after-tax income is more equally distributed; area A shrinks and the Gini coefficient falls.
4. A higher Gini coefficient means that the Lorenz curve has moved further from the line of perfect equality, so income has become less equally distributed: a larger share of total income now goes to higher-income groups.
5. Sketch: define the minimum wage; draw the labour market diagram showing the higher wage and the surplus of labour; explain the gains to low-paid workers in work; evaluate using the text’s data (how far above the market wage, the share of the poor who are not in work, the informal sector, the possible effect on firms’ costs and prices, wage-inelastic demand in the short run); compare with alternatives such as in-work benefits; reach a judgment that depends on how high the minimum is and on who the poor are.
Paper 3-style question (HL). Country Q’s statistics office publishes the following data on the distribution of income (hypothetical data).
Quintile | Share of income, 2015 (%) | Share of income, 2025 (%) |
|---|---|---|
Poorest 20% | 4 | 6 |
Second 20% | 8 | 10 |
Third 20% | 12 | 14 |
Fourth 20% | 20 | 21 |
Richest 20% | 56 | 49 |
Equality is about equal amounts and can be measured; equity is about fairness and is a normative judgment. Inequality of opportunity is widely seen as inequitable.
Income is a flow and wealth a stock; wealth is distributed far more unequally than income.
The Lorenz curve plots cumulative income shares against cumulative population; the Gini coefficient, A ÷ (A + B), runs from 0 (perfect equality) to 1 (perfect inequality).
Absolute poverty is measured against a fixed standard of basic needs (the $3.00 a day international poverty line); relative poverty against typical incomes in a society. The MPI is a composite measure of health, education and living standards.
Causes include inequality of opportunity, unequal ownership of resources, differences in human capital, discrimination, unequal power, tax and benefit policies, globalisation and technology, and market-based supply-side policies.
Inequality can affect growth in both directions, lowers living standards for the poor and is associated with social instability.
Progressive taxes raise the average tax rate with income; indirect taxes tend to be regressive because poorer households spend a larger share of income.
Transfers, targeted spending, human capital investment, UBI, anti-discrimination laws and minimum wages each have strengths and limitations; combinations work best.
I can distinguish equality from equity, and income from wealth.
I can draw a Lorenz curve, show a change in the distribution of income and explain the effect on the Gini coefficient.
I can construct a Lorenz curve from quintile data (HL).
I can distinguish absolute from relative poverty and explain international poverty lines, minimum income standards and the MPI.
I can explain at least four difficulties in measuring poverty.
I can explain each of the eight causes of inequality and poverty with a mechanism.
I can evaluate the effects of inequality on growth, living standards and social stability.
I can classify taxes as progressive, proportional or regressive using average tax rates, and explain why indirect taxes are regressive.
I can calculate indirect tax paid, total tax and average tax rates from data (HL).
I can evaluate taxation, transfers, UBI, minimum wages and other policies, using a real example, and reach a judgment.
0 |
0 |
The work does not reach a standard described by the descriptors below. |
1 | 1–2 | Little understanding of the specific demands of the question. Relevant economic theory is stated but not relevant. Economic terms are stated but not relevant. |
2 | 3–4 | Some understanding of the specific demands of the question. Relevant economic theory is described. Some relevant economic terms are included. |
3 | 5–6 | The specific demands of the question are understood but only partially addressed. Relevant economic theory is partly explained. Some relevant terms are used appropriately. Where appropriate, relevant diagram(s) are included. |
4 | 7–8 | The specific demands of the question are understood and addressed. Relevant economic theory is explained. Relevant terms are used mostly appropriately. Where appropriate, relevant diagram(s) are included and explained. |
5 | 9–10 | The specific demands of the question are understood and addressed. Relevant economic theory is fully explained. Relevant terms are used appropriately throughout. Where appropriate, relevant diagram(s) are included and fully explained. |
Using real-world examples, discuss whether government intervention to promote equity necessarily reduces efficiency.
15 marks
Answers may include:
Terminology: equity, equality, efficiency, redistribution, progressive taxation, transfer payments, minimum wage, price ceiling, merit goods, incentives.
Explanation: arguments that it reduces efficiency: high marginal tax rates may reduce the incentive to work and invest; generous benefits may reduce the incentive to seek work; price ceilings on necessities cause shortages and welfare loss; a minimum wage above equilibrium may cause unemployment. Arguments that it does not: provision of education and healthcare to low-income groups builds human capital and raises productivity; cash transfers can raise consumption, health and school attendance; reducing extreme inequality may support social stability and growth.
Diagram(s): price ceiling diagram showing shortage and welfare loss; minimum wage (labour market) diagram showing a surplus of labour; positive consumption externality diagram for education.
Synthesis/evaluation: depends on the policy chosen and its design (targeted cash transfers versus price controls); magnitude of incentive effects is an empirical question; short-run costs versus long-run gains in human capital; equity is normative, so the acceptable trade-off is a value judgement; consideration of the word 'necessarily'; a reasoned conclusion.
Examples: Brazil's Bolsa Família conditional cash transfer programme (from 2003), linked to higher school attendance and reduced poverty; Mexico's Prospera/Progresa programme; the Nordic countries combining high taxes and high productivity; Venezuela's price controls on food leading to shortages.
N.B. Terminology, theory, diagrams and examples given in part (a) and referred to in part (b) should be rewarded.
Examiners should be aware that candidates may take a different approach which, if appropriate, should be rewarded.
Markbands (best fit)
Level | Marks | Descriptor |
|---|---|---|
0 | 0 | The work does not reach a standard described by the descriptors below. |
1 | 1–3 | Little understanding of the specific demands of the question. Theory is stated but not relevant. Terms are not relevant. No synthesis or evaluation. Real-world examples are identified but not relevant. |
2 | 4–6 | Some understanding of the demands. Relevant theory is described. Some relevant terms are included. Synthesis or evaluation is superficial. A relevant real-world example is identified. |
3 | 7–9 | The demands are understood but only partially addressed. Theory is partly explained. Some terms are used appropriately. Relevant diagram(s) are included where appropriate. Synthesis or evaluation is appropriate but lacks balance. Example(s) are identified and partly developed in context. |
4 | 10–12 | The demands are understood and addressed. Theory is explained. Terms are used mostly appropriately. Diagram(s) are included and explained. Synthesis or evaluation is appropriate and mostly balanced. Example(s) are identified and developed in the context of the question. |
5 | 13–15 | The demands are understood and addressed. Theory is fully explained. Terms are used appropriately throughout. Diagram(s) are included and fully explained. Synthesis or evaluation is effective and balanced. Example(s) are identified and fully developed to support the argument. |
Technological progress is a major source of growth in production possibilities.
Using a production possibilities curve (PPC), explain the effect of an improvement in technology that affects the production of only one of two goods.
10 marks
Using real-world examples, discuss the possible consequences of economic growth for the distribution of income.
15 marks
Read the extract and answer the questions that follow.
Text A — Seravia's road from planning to markets
[1] Until 2014, Seravia, a lower-middle-income economy in eastern Europe, was largely a planned economy. Central planners set output targets for state farms and factories, fixed most prices and allocated housing and jobs. Shops frequently ran out of basic goods while warehouses held unsold items that nobody wanted.
[2] Since 2015 the government has removed most price controls and carried out a programme of privatization, selling around two-thirds of its state-owned enterprises to private owners. Foreign firms have been allowed to invest and to import machinery.
[3] Output has grown strongly and the range and quality of goods in shops has improved. However, unemployment has risen as loss-making factories have closed, and the gap between high-income and low-income households has widened. Pensioners on fixed state pensions complain that prices have risen faster than their incomes.
Table 1: Selected indicators for Seravia
Indicator | 2014 | 2024 |
|---|---|---|
Real GDP per capita (US$) | 3 840 | 6 912 |
Unemployment (% of labour force) | 2.1 | 6.8 |
Gini coefficient | 0.27 | 0.38 |
Share of output produced by private firms (%) | 18 | 64 |
Define the term planned economy indicated in bold in the text (Text A, paragraph 1).
2 marks
Define the term privatization indicated in bold in the text (Text A, paragraph 2).
2 marks
Using information from Table 1, calculate the percentage change in Seravia's real GDP per capita between 2014 and 2024.
2 marks
Using a production possibilities curve (PPC) diagram, explain how the removal of central planning may have allowed Seravia to increase output without any increase in its resources (Text A, paragraphs 1 and 2).
4 marks
Using information from the text/data and your knowledge of economics, discuss the consequences of Seravia's move from a planned economy towards a market economy.
15 marks