2.6 Quadratic functions · IB Maths AA | Augment Education
2.6 Quadratic functions
Sketch and interpret parabolas, move between the general, factorised and vertex forms of a quadratic by expanding, factorising and completing the square, and build quadratic models.
IB Mathematics: Analysis and Approaches
Part of 2 Functions
SL and HL
Key terms introduced here
Each is in the Maths AA glossary, with every other term in the subject.
The U-shaped curve that is the graph of a quadratic function. It opens upwards when a>0, downwards when a<0, and is symmetric about a vertical line through its vertex.
Find the x-intercepts of the graph of f(x)=a(x−p)(x−q) and the vertex of the graph of f(x)=a(x−h)2+k.
Complete the square to write a quadratic in the form a(x−h)2+k.
Convert a quadratic function between its general, factorised and vertex forms.
Sketch the graph of a quadratic function, labelling its key features.
Determine the range and the maximum or minimum value of a quadratic function, including on a restricted domain.
Find the equation of a quadratic function from its graph or from given information.
Use quadratic functions to model projectiles, areas and other situations, and interpret the results.
A quadratic function is a function whose highest power of x is 2. Its graph is a smooth, symmetric curve called a parabola, which has a single highest or lowest point. The height of a ball thrown into the air, the area of a rectangle with a fixed perimeter and the revenue from selling a product at different prices are all modelled by quadratic functions, and in each case the turning point answers a practical question: how high, how large, how much.
Quadratics are the first functions after straight lines whose rate of change is not constant. Their graphs, and the three ways of writing their equations, are a model for how the same function can be represented in different forms, each showing different features.
The quadratic function and its graph
Definition
The condition a=0 matters: if a=0, the function is f(x)=bx+c, which is linear. The constants b and c can be zero, so f(x)=3x2, f(x)=x2−5 and f(x)=−2x2+x are all quadratic functions. The form ax2+bx+c is called the general form, and the natural domain of a quadratic function is all real numbers.
The effect of a on the shape
Every parabola is the same basic U-shape, stretched and turned according to the value of a.
If a>0, the parabola opens upwards and has a lowest point (a minimum). It is concave up.
If a<0, the parabola opens downwards and has a highest point (a maximum). It is concave down.
The larger ∣a∣ is, the narrower (steeper) the parabola; the smaller ∣a∣ is, the wider it is.
y = x²
y = 2x²
y = 0.5x²
y = −x²
Positive a gives a parabola that opens upwards, negative a one that opens downwards. A larger value of |a| makes the parabola narrower.
A useful way to remember the shape: a positive a gives a "smiling" curve and a negative a a "frowning" one. Concavity, the direction in which a curve bends, is defined precisely using the second derivative in 5.7.
Key features of a parabola
The graph of a quadratic function has these key features.
The y-intercept is (0,c), because f(0)=a(0)2+b(0)+c=c.
The x-intercepts (if any) are the points where f(x)=0. Their x-coordinates are the zeros of the function. A parabola can cross the x-axis twice, touch it once, or miss it altogether.
The axis of symmetry is a vertical line that divides the parabola into two mirror-image halves.
The vertex is the turning point, where the axis of symmetry meets the curve.
y = x² − 2x − 3
The axis of symmetry x = 1 lies halfway between the x-intercepts −1 and 3. The y-intercept (0, −3) has a mirror-image partner (2, −3) on the other side of the axis.
The vertex gives the minimum or maximum value of the function. For y=x2−2x−3, the vertex is (1,−4), so the minimum value of the function is −4, and it occurs when x=1.
The axis of symmetry x=−2ab
The position of the axis of symmetry can be found from the coefficients without drawing the graph. Two points with the same y-coordinate on a parabola are mirror images of each other, so the axis lies exactly halfway between them.
Setting f(x)=c, the y-coordinate of the y-intercept, gives
ax2+bx+c=c⇒ax2+bx=0⇒x(ax+b)=0
so the parabola has height c at x=0 and at x=−ab. The axis of symmetry is halfway between these:
x=20+(−ab)=−2ab
The three forms of a quadratic function
The same quadratic function can be written in three standard forms. Each form shows some key features directly, without any calculation.
Form
Equation
What it shows directly
General
f(x)=ax2+bx+c
y-intercept (0,c); axis x=−2ab
Factorised
f(x)=a(x−p)(x−q)
x-intercepts (p,0)
Vertex
f(x)=a(x−h)2+k
vertex (h,k); axis x=h
In all three forms, a is the same number: the coefficient of x2, which decides the shape. For example, y=x2−2x−3, y=(x+1)(x−3) and y=(x−1)2−4 are three representations of the same function, the one in the graph of key features. Expanding either of the last two gives the first.
Factorised form
The factorised form shows the zeros because a product is zero exactly when one of its factors is zero: f(p)=a(0)(p−q)=0 and f(q)=0. The axis of symmetry is halfway between the two x-intercepts, at x=2p+q, and substituting this value gives the vertex.
A sign in a factor is easy to misread. In a(x−p)(x−q), the factor (x+1) corresponds to p=−1, so the intercept is on the negative side of the axis. When the two zeros are equal, the factorised form is a(x−p)2: the graph touches the x-axis at (p,0), which is also the vertex, and does not cross it. When a parabola does not meet the x-axis at all, the quadratic has no real zeros and cannot be written in factorised form with real numbers.
Vertex form
The vertex form shows the turning point because (x−h)2 is never negative and equals 0 only when x=h. If a>0, then a(x−h)2≥0, so f(x)≥k, with equality only at x=h: the minimum point is (h,k). If a<0, then a(x−h)2≤0, so f(x)≤k and (h,k) is the maximum point.
Vertex form also describes how the parabola is obtained from y=x2. The graph of y=a(x−h)2+k is the graph of y=x2 stretched vertically by a factor of a (and reflected in the x-axis if a<0), then translated h units horizontally and k units vertically. These transformations of graphs are studied in general in 2.11.
Completing the square
The idea behind the method
To convert a quadratic from general form into vertex form, the x2 and x terms are combined into a single perfect square. This process is called completing the square. It rests on the expansion
(x+d)2=x2+2dx+d2
so an expression x2+2dx is a perfect square except for the missing constant d2:
x2+2dx=(x+d)2−d2
The number d in the bracket is half the coefficient of x.
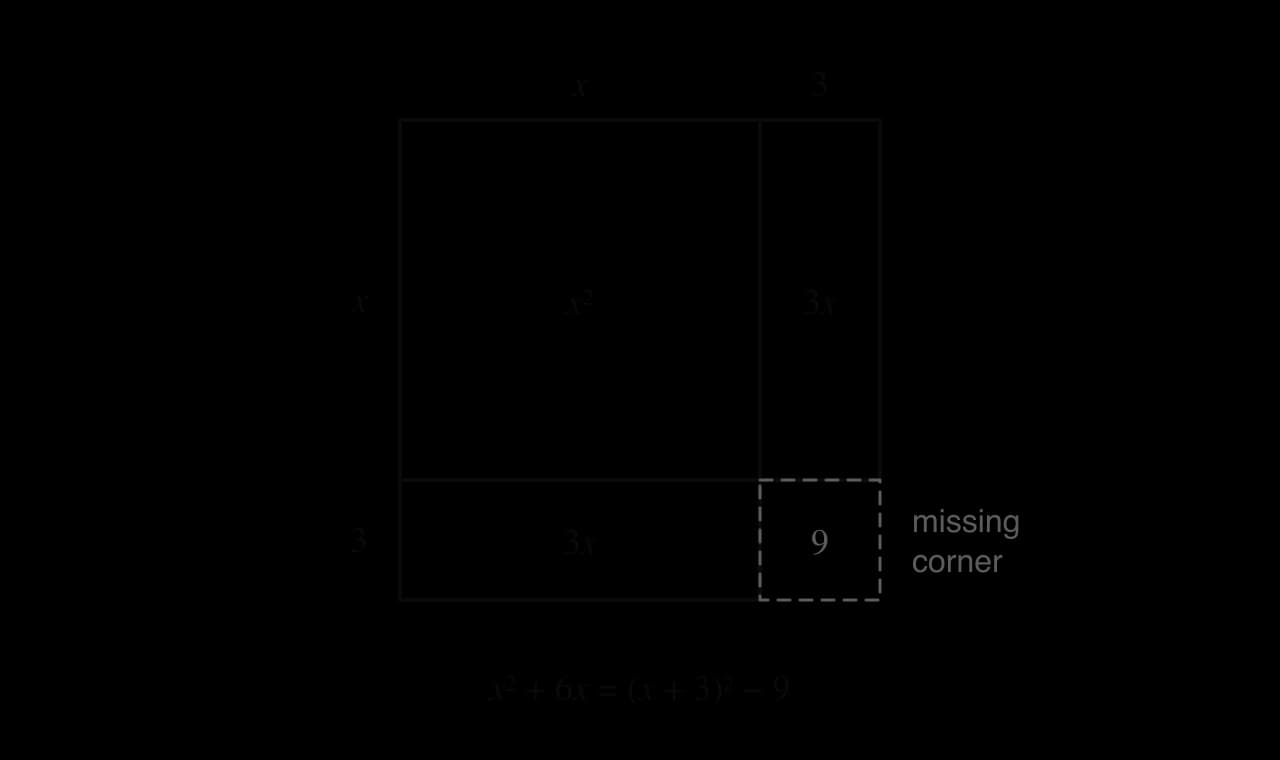
The area model shows the same fact for x2+6x. The area x2+6x is arranged as a square of side x with two strips of area 3x, and it is a complete square of side x+3 apart from a missing corner of area 32=9.
Splitting 6x into two strips of 3x leaves the large square (x + 3)² short by one corner of area 9, so x² + 6x = (x + 3)² − 9.
When the coefficient of x2 is 1
For x2+bx+c: halve the coefficient of x, write the square of x plus that half, subtract the square of the half, then add the constant.
x2+bx+c=(x+2b)2−(2b)2+c
When the coefficient of x2 is not 1
When a=1, take a out as a factor of the x2 and x terms only, complete the square inside the bracket, then multiply out the outer bracket again.
The general result
Completing the square on the general quadratic shows where the axis formula comes from and gives a formula for the vertex.
The same working, with the equation set equal to zero, leads to the quadratic formula in 2.7. In practice the y-coordinate of the vertex is usually found by substituting x=−2ab into f(x) rather than by remembering this formula.
Converting between forms
Each conversion uses one algebraic skill:
vertex form or factorised form to general form: expand the brackets
general form to vertex form: complete the square
general form to factorised form: factorise (methods for factorising are covered in 2.7)
factorised form to vertex form: find the axis x=2p+q from the zeros, then the vertex, and write a(x−h)2+k.
Different forms suit different questions. To find a minimum or the range, use vertex form; to find where a graph crosses the x-axis, use factorised form; to find the y-intercept or to differentiate, use general form. Recognising which representation answers a question most directly saves a great deal of algebra.
Range and maximum or minimum values
Range on the whole real line
The vertex decides the range of a quadratic function with domain x∈R. For f(x)=a(x−h)2+k:
if a>0, the minimum value is k and the range is f(x)≥k
if a<0, the maximum value is k and the range is f(x)≤k.
Completing the square therefore answers questions about the least or greatest value of an expression, even when the expression is part of something larger.
Range on a restricted domain
When the domain is an interval, the range depends on whether the vertex lies inside it. Check three values: the function at each endpoint of the domain, and at the vertex if the vertex is in the domain. The smallest and largest of these give the range.
y = x² − 4x + 1, 0 ≤ x ≤ 5
On 0 ≤ x ≤ 5 the lowest point is the vertex (2, −3) and the highest point is the endpoint (5, 6), so the range is −3 ≤ y ≤ 6.
For f(x)=x2−4x+1 on 0≤x≤5, the vertex is at x=2, inside the domain, with f(2)=−3. The endpoint values are f(0)=1 and f(5)=6. The range is −3≤f(x)≤6. The endpoint x=0 gives neither the least nor the greatest value, because the vertex is lower and the other endpoint is further from the axis of symmetry.
Sketching quadratic graphs
A routine for sketching
A sketch shows the general shape with the key features labelled; it does not need to be drawn to scale. For a quadratic:
Decide the shape from the sign of a.
Mark the y-intercept (0,c).
Find the x-intercepts, if there are any, by factorising or another method.
Find the axis of symmetry and the vertex.
Use symmetry to add the mirror image of the y-intercept, then draw a smooth curve through the points.
When a parabola does not cross the x-axis, the x-intercepts are missing, and the vertex and the y-intercept carry the sketch. For y=x2+2x+5=(x+1)2+4, the vertex is (−1,4) and the y-intercept is (0,5). The minimum value 4 is positive and the parabola opens upwards, so the whole graph lies on the positive side of the x-axis and there are no x-intercepts.
Using symmetry and technology
Symmetry gives the axis whenever two points on the parabola have the same y-coordinate: the axis is the vertical line halfway between them. This is often quicker than any formula.
A graphic display calculator (GDC) finds the key features of any parabola numerically. After graphing the function, the maximum or minimum function gives the vertex, the zero (or root) function gives each x-intercept, and evaluating at x=0 gives the y-intercept. The GDC gives decimal approximations, so exact values, such as 25 or 2+3, still need algebra. A suitable viewing window should show the vertex and every intercept; if the curve looks like a straight line or disappears, the window is too narrow or too wide.
Finding the equation of a quadratic function
Choosing the right form
The information given decides the most efficient form to start from.
Information given
Start from
Both x-intercepts and one other point
y=a(x−p)(x−q)
The vertex and one other point
y=a(x−h)2+k
The graph touches the x-axis at x=p, and one other point
y=a(x−p)2
Three points, none special
y=ax2+bx+c and simultaneous equations
In each case, substitute the extra point to find a (or solve for a, b and c).
y = f(x)
A parabola through (−2, 0), (4, 0) and (0, −4). The two x-intercepts make the factorised form the natural starting point.
The vertex form works in the same way when the turning point is known. Only one more point is needed, because the vertex already fixes h and k.
Quadratic models
A mathematical model uses a function to describe a real situation. Quadratic models appear when a quantity rises to a peak and falls again, or falls to a lowest value and rises again. The vertex then answers the "greatest" or "least" question, and the context decides which values of the variable make sense.
Projectiles
An object thrown into the air, ignoring air resistance, follows a parabolic path, and its height above the ground is a quadratic function of time. Near the Earth's surface, the t2 coefficient is −4.9 when height is in metres and time in seconds, which is half of the acceleration due to gravity, 9.8m s−2.
The model is an approximation. It ignores air resistance, which slightly lowers the real maximum height and shortens the flight, and it stops being valid once the ball reaches the ground. A model's domain should always be restricted to the values for which it describes the situation.
Maximum area
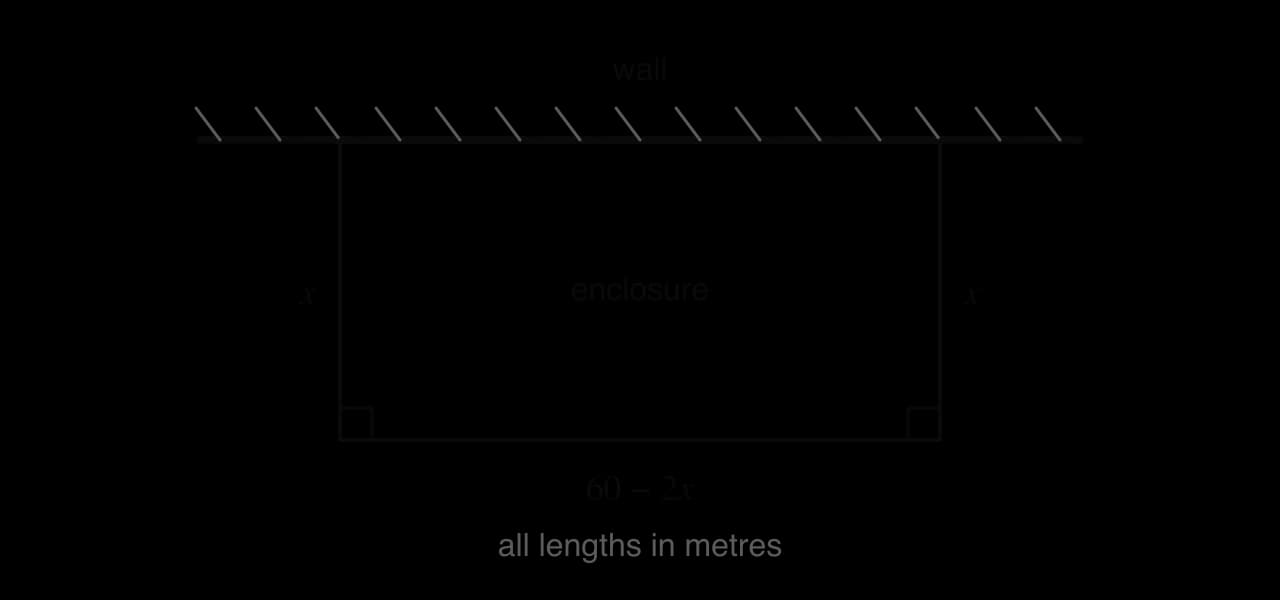
Problems about areas with a fixed perimeter lead to quadratic functions, because area is a product of two lengths. A farmer has 60 m of fencing to make a rectangular enclosure against a long straight wall, so that only three sides need fencing.
The two sides perpendicular to the wall use 2x metres of fencing, leaving 60 − 2x metres for the side parallel to the wall.
The answer has a pattern worth seeing: with a wall on one side, the best enclosure is twice as long as it is wide. Finding the maximum from the vertex works for any quadratic. For other functions, the same type of problem is solved by optimisation with calculus in 5.8.
Revenue and arches
Quadratic models also arise when two linear quantities are multiplied, as with price and the number of items sold, and in the shapes of curved structures.
Exam-style questions on quadratic functions
The second question uses a GDC to fit a quadratic model to data, then interprets it.
Self-check
To do:
I can state the y-intercept, axis of symmetry, vertex and concavity of the graph of y=ax2+bx+c.
To do:
I can find the x-intercepts from the factorised form a(x−p)(x−q) and the vertex from the vertex form a(x−h)2+k.
To do:
I can complete the square, including when the coefficient of x2 is not 1 or is negative.
To do:
I can convert a quadratic between its general, factorised and vertex forms.
To do:
I can sketch a parabola, labelling its intercepts with the axes and its vertex.
To do:
I can find the range of a quadratic function on R and on a restricted domain.
To do:
I can find the equation of a quadratic from its graph, its vertex or three points.
To do:
I can set up and use a quadratic model for a projectile, an area or a revenue, and interpret the answers in context.
The vertex is (−2,13). Since a=−3<0, it is a maximum.
Check with the axis formula: for g, −2ab=−2(−3)−12=−2, which agrees.
(b) The zeros are 1 and 5, so the axis of symmetry is x=21+5=3.
f(3)=3(3−1)(3−5)=3(2)(−2)=−12
The vertex is (3,−12) and a=3, so f(x)=3(x−3)2−12.
Check: 3(x−3)2−12=3(x2−6x+9)−12=3x2−18x+15, which matches (a).
(c) The vertex is (3,−12) and the y-intercept is (0,15).
Since (x+5)2≥0, the minimum value is 5, when x=−5.
(b) The denominator is always positive and is smallest when it equals 5. A fraction with numerator 1 and a positive denominator is largest when the denominator is smallest, so the maximum value is 51, when x=−5.
. The vertex is
(3,5)
, a maximum.
(a) The range is g(x)≤5.
(b) The vertex x=3 is in the domain, so the maximum is 5. At the endpoints, g(0)=−4 and g(4)=−16+24−4=4. The smallest value is −4. The range is −4≤g(x)≤5.
(c) The vertex is not in this domain, and g decreases for x>3. At x=7: g(7)=−49+42−4=−11. The endpoint x=4 is not included, so the value g(4)=4 is not reached. The range is −11≤g(x)<4.
. The
x
-intercepts are
(−2,0)
and
(4,0)
.
there, so the vertex is
(1,9)
.
y = −x² + 2x + 8
Four labelled points and the maximum point (1, 9) fix the curve. The points (0, 8) and (2, 8) are mirror images in the axis x = 1.
.
(b) With a=1, the axis is x=−2b, so −2b=2 and b=−4. Substitute (5,7): 7=25−20+c, so c=2.
The curve is y=x2−4x+2=(x−2)2−2, with vertex (2,−2).
Check with (−1,7): 1+4+2=7.
:
−4=a(2)(−4)=−8a
, so
a=21
.
f(x)=21(x+2)(x−4)=21(x2−2x−8)=21x2−x−4
(b) The axis is x=2−2+4=1, and f(1)=21(3)(−3)=−29. The vertex is (1,−29).
. Find
b
and
c
.
y=2(x−3)2−2=2x2−12x+18−2=2x2−12x+16
(b) Here a=1, so the axis is x=−2b=3, which gives b=−6.
Substitute (1,2): 2=1−6+c, so c=7.
(c) Substitute each point into y=ax2+bx+c.
(0,3):(1,6):(2,13):c=3a+b+c=64a+2b+c=13
With c=3: a+b=3 and 4a+2b=10, so 2a+b=5. Subtracting the first equation gives a=2, then b=1.
y=2x2+x+3
Check: at x=2, y=8+2+3=13. The three equations can also be solved with the simultaneous equation solver on a GDC.
h(1.4285…)=−4.9(1.4285…)2+14(1.4285…)+1.5=11.5
The maximum height is 11.5 m, reached after 1.43 s (3 s.f.).
(c) Solve −4.9t2+14t+1.5=0 with a GDC (or the quadratic formula in 2.7). The solutions are t=−0.103… and t=2.9605…. Time cannot be negative, so the ball hits the ground after 2.96 s.
(d) The model applies from the throw until the ball lands: 0≤t≤2.96.
h(t) = −4.9t² + 14t + 1.5
The model is drawn only for 0 ≤ t ≤ 2.96, from the throw to the moment the ball lands. The vertex gives the greatest height.
(b) Both lengths must be positive: x>0 and 60−2x>0, so 0<x<30.
(c) A(x)=−2x2+60x has a=−2<0, so its vertex is a maximum. The zeros are x=0 and x=30, so the axis is x=15.
A(15)=15(60−30)=450
The greatest area is 450m2, when the sides perpendicular to the wall are 15 m and the side parallel to the wall is 30 m.
and
p=50
, so the vertex is at
p=25
.
R(25)=25(200−100)=2500
The revenue is greatest, USD 2500, at a ticket price of USD 25.
(b) The arch meets the water at (0,0) and (40,0), so y=ax(x−40). The vertex is at x=20, with height 10.
10=a(20)(20−40)=−400a⇒a=−401
The arch is y=−401x(x−40).
The boat occupies 14≤x≤26. The arch is lowest over the boat at its edges, x=14 and x=26, which by symmetry have the same height.
y(14)=−401(14)(14−40)=4014×26=9.1
The arch is 9.1 m high above the edges of the boat, which is more than 9 m, so the boat can pass, with 0.1 m to spare.
So a=2, h=2, k=−5 (A1 A1 for the values).
(b) "Write down" means read it from (a): the vertex is (2,−5).
(c) x=2.
(d) a>0, so the vertex is a minimum: f(x)≥−5.
(e) Use the form from (a) (M1).
2(x−2)2−5=3⇒(x−2)2=4⇒x−2=±2
So x=0 or x=4 (A1). Both answers are expected; they are mirror images in x=2, as they should be.
(b) Using the simultaneous equation solver on the GDC: a=−1, b=8, c=−8, so P(x)=−x2+8x−8.
By hand, subtracting the first equation from the second gives 8a+2b=8, and the second from the third gives 27a+3b=−3. These simplify to 4a+b=4 and 9a+b=−1, so 5a=−5, giving a=−1, b=8 and then c=−8.
(c) The vertex is at x=−2(−1)8=4, and P(4)=−16+32−8=8. The company should make 400 units, for a maximum daily profit of USD 8000.
(d) Solve −x2+8x−8=5, that is, x2−8x+13=0. The GDC gives x=2.2679… or x=5.7320… (exactly 4±3). The profit is USD 5000 when about 227 or 573 units are made.
.
[4]4 marks
Markscheme (b)
∫(x−3)2+221dxM1
=21arctan(2x−3)A1
21(arctan1−arctan0)M1
=8πA1
, where
a,b∈Z
.
[2]2 marks
(b)
Hence find an expression for y in terms of x.
[3]3 marks
(c)
Find the value of y when x=27.
[1]1 mark
, where
p,q∈Z
.
[1]1 mark
(b)
Hence find ∫x2+4x+131dx.
[2]2 marks
(c)
By writing 2x+7=(2x+4)+3, find ∫h(x)dx.
[3]3 marks
(d)
Hence find the exact value of ∫−21h(x)dx, giving your answer in the form lna+bπ, where a,b∈Z+.
[3]3 marks
(e)
The region bounded by the curve y=x2+4x+133, the x-axis and the lines x=−2 and x=1 is rotated through 2π radians about the x-axis.