2.2 Functions, domain, range and inverse · IB Maths AA | Augment Education
2.2 Functions, domain, range and inverse
Decide whether a relation is a function, use function notation, find domains and ranges in interval and set notation, model with functions, and understand inverse functions and their graphs.
IB Mathematics: Analysis and Approaches
Part of 2 Functions
SL and HL
Key terms introduced here
Each is in the Maths AA glossary, with every other term in the subject.
The function f−1 that undoes f: if f(a)=b then f−1(b)=a. It exists only when f is one-to-one, and its graph is the reflection of the graph of f in y=x.
A function in which at least one output comes from two or more different inputs, such as f(x)=x2, where f(−3)=f(3)=9. It has no inverse function on that domain.
A function or equation that describes a real situation, with variables standing for real quantities. Its domain is limited to values that make sense in the context.
The largest set of real numbers for which a formula gives a real output: values that would mean dividing by zero, taking the square root of a negative number or the logarithm of a non-positive number are left out.
A function in which different inputs always give different outputs, so each output comes from exactly one input. Its graph passes the horizontal line test.
A graph represents a function of x when every vertical line meets it at most once.
, and evaluate and solve with it.
Find the domain and range of a function, including its natural domain, and write them in interval and set notation.
Use a function as a mathematical model, restricting its domain to values that make sense in the context.
Determine whether a function is one-to-one or many-to-one, and use the horizontal line test to decide whether an inverse exists.
Find values of f−1, state the domain and range of f−1, and sketch y=f−1(x) by reflecting y=f(x) in the line y=x.
A function is a rule that turns each input into exactly one output. The idea is at the centre of the course: sequences, graphs, models, trigonometry and calculus are all built on functions. A function can be given as a formula, a graph, a table of values or a description in words, and moving between these representations is one of the main skills in mathematics.
Every function comes with a set of allowed inputs and a set of outputs it produces. Knowing these sets matters as much as knowing the formula, especially when a function models a real situation, where only some inputs make sense.
What a function is
A relation pairs inputs with outputs. A function is a relation with one extra condition: every input gives exactly one output. Two different inputs may share an output, but one input may never produce two different outputs.
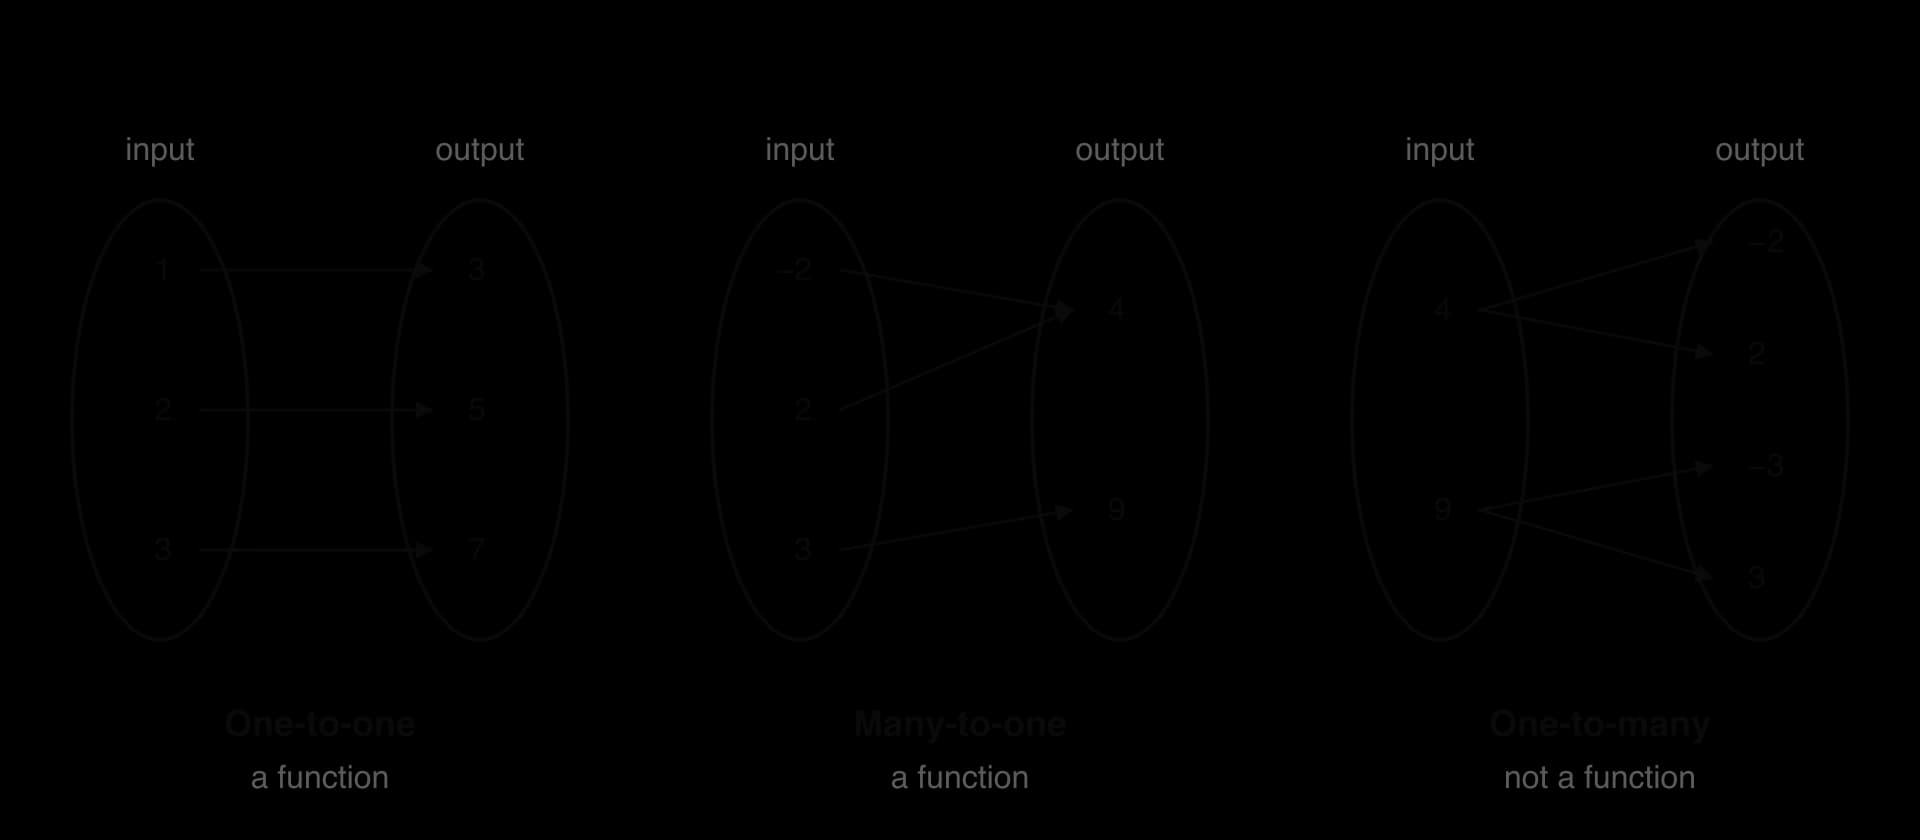
A mapping diagram shows a relation as arrows from inputs to outputs. In a function, exactly one arrow leaves each input.
A function sends each input to one output. Several inputs may share an output (many-to-one), but one input may not split into several outputs.
The first mapping is x↦2x+1 and the second is x↦x2; both are functions. The third sends each number to both of its square roots, so the input 4 has two outputs, −2 and 2, and the relation is not a function. The symbol x avoids this problem by meaning only the non-negative square root, so 4=2.
Function notation
A function is usually named with a letter, and f(x), read "f of x", is the output when the input is x. The equation f(x)=3x−1 and the mapping notation f:x↦3x−1 describe the same function. Here x is the independent variable (the input chosen freely) and f(x), or y when the function is graphed, is the dependent variable.
Other letters are used when they suit the context: v(t) for a velocity at time t, C(n) for the cost of n items, A(r) for the area of a circle of radius r. The letter in brackets is a placeholder, so f(x)=x2 and f(t)=t2 define the same function.
To evaluate a function, replace every occurrence of the variable by the input, in brackets.
Graphs of functions and the vertical line test
The graph of a function f is the set of all points (x,f(x)), so its equation is y=f(x). Since each x in the domain has exactly one output, each vertical line meets the graph at most once. This gives a quick visual test.
The circle x2+y2=9 fails the test. The vertical line x=1 meets it at two points, (1,8) and (1,−8), so the input 1 would have two outputs. Each half of the circle on its own passes the test: the upper semicircle is the graph of the function y=9−x2, and the lower one is the graph of y=−9−x2.
upper half: y = √(9 − x²)
lower half: y = −√(9 − x²)
The vertical line x = 1 meets the circle twice, so the whole circle is not the graph of a function. Each semicircle alone is.
Domain and range
The domain of a function is its set of inputs and the range is the set of outputs it actually produces. On a graph, the domain is the spread of the graph along the x-axis and the range is its spread along the y-axis.
A function is not fully defined until its domain is known. The same formula on different domains gives different functions, with different ranges and graphs. When a domain is stated, it is written after the formula: f(x)=x2, x∈R, −2≤x≤3.
Interval and set notation
Domains and ranges are sets of real numbers, usually intervals. They can be written as inequalities, in interval notation or in set notation.
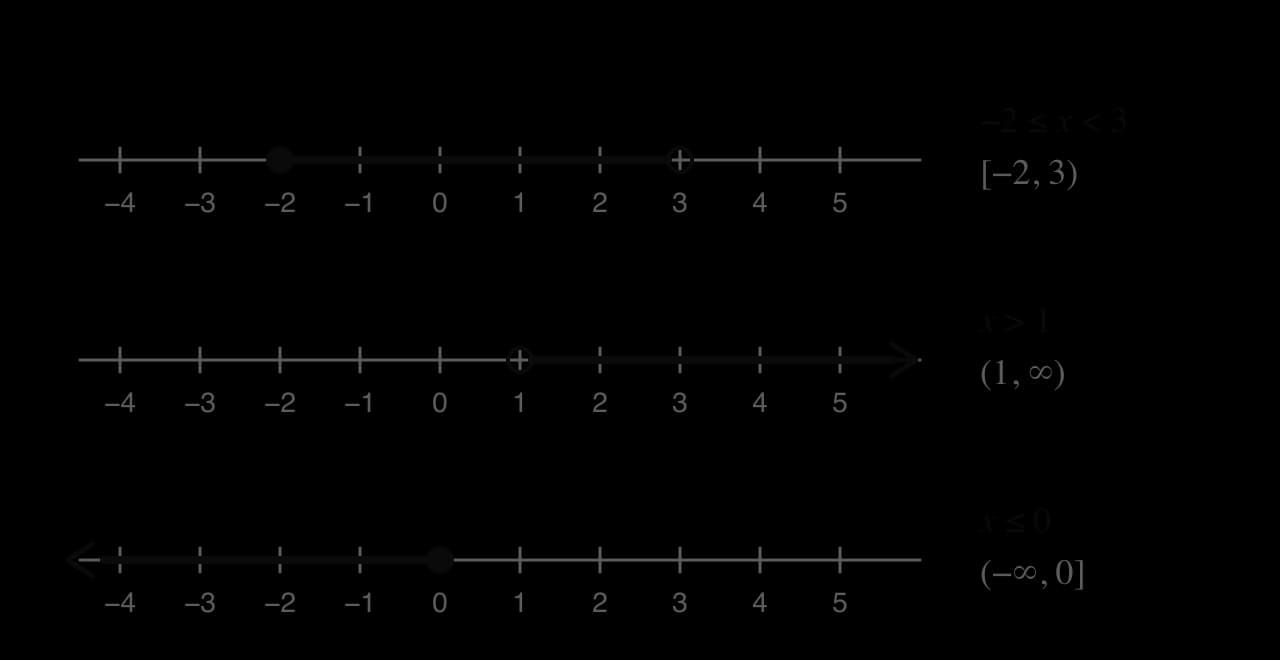
A filled dot and a square bracket include the endpoint; an open dot and a round bracket exclude it.
Inequality
Interval notation
Set notation
−2≤x<3
[−2,3)
{x∣x∈R,−2≤x<3}
x>1
(1,∞)
{x∣x∈R,x>1}
x≤0
(−∞,0]
{x∣x∈R,x≤0}
all real numbers
(−∞,∞)
R
all real numbers except 2
(−∞,2)∪(2,∞)
{x∣x∈R,x=2}
The symbol ∪ (union) joins two intervals. The short form "x∈R, x=2" is the most common way to write the last domain. A domain can also be a set of separate values, such as n∈{1,2,3,4} or n∈N, when only whole numbers make sense.
Finding the range
The range depends on the domain and on the shape of the graph. The safest method is to sketch the graph over the given domain and read off the lowest and highest values of y. Checking only the values at the endpoints of the domain is not enough when the graph turns in between.
The natural domain
When no domain is given, the domain is taken to be the largest set of real numbers for which the formula gives a real output. This is the natural domain. Three operations restrict it.
Part of the formula
Condition
Example
Natural domain
expression
expression ≥0
x−3
x≥3
expression1
expression =0
x+21
ln(expression) or loga(expression)
expression >0
ln(5−x)
When a formula contains more than one of these, every condition must hold at the same time.
Knowing the natural domain also helps with the range. Since x−3 is never negative, the range of f(x)=x−3 is f(x)≥0. Since x+21 can never equal 0, the range of g(x)=x+21 is g(x)=0 (this is explored in 2.8). The range of lnx is all real numbers (2.9).
Functions as mathematical models
A function used to describe a real situation is a mathematical model. The variables stand for real quantities with units, and the formula captures how one depends on the other. The key concept of modelling runs through the whole course, and it starts here: a model is useful only within the set of inputs where it makes sense.
Contexts restrict a domain in several ways. A time, a length or a number of items cannot be negative. A quantity may run out, such as fuel in a tank. A number of people or items must be a whole number, which makes the domain a set of separate values and the graph a set of points rather than a continuous curve.
V(d) = 50 − 0.065d
The model is drawn only between d = 0 and the point where the tank is empty. Beyond that the formula gives negative volumes.
The same ideas apply with other notation. A car that brakes from 24 m s⁻¹ with constant deceleration has velocity v(t)=24−6t, where t is the time in seconds; the model applies only for 0≤t≤4, after which the car has stopped and stays at rest. A cinema that charges €12 per ticket and a €5 booking fee per order has cost C(n)=12n+5 for n tickets, with n∈{1,2,3,…}, so its graph is a set of separate points.
One-to-one and many-to-one functions
Functions fall into two types according to whether outputs can repeat. The type decides whether the function can be reversed.
The function x↦2x+1 is one-to-one. The function x↦x2 on R is many-to-one, since (−3)2=32=9. On a graph, a repeated output appears as a horizontal line meeting the graph more than once.
y = x² − 4x
y = 0.5x³
The line y = 5 meets the parabola twice, so y = x² − 4x is many-to-one. Every horizontal line meets the cubic exactly once, so y = 0.5x³ is one-to-one.
The horizontal line test and the vertical line test answer different questions. The vertical line test decides whether a graph is a function at all; the horizontal line test decides whether that function is one-to-one.
Inverse functions
An inverse function reverses, or undoes, a function. If f takes the input a to the output b, the inverse takes b back to a. For example, f(x)=2x+3 means "multiply by 2, then add 3". To undo it, reverse the steps in the opposite order: "subtract 3, then divide by 2". So
f−1(x)=2x−3
and, for instance, f(4)=11 while f−1(11)=4. A systematic algebraic method for finding f−1(x) is developed in 2.5.
Why only one-to-one functions have inverses
If f is many-to-one, two inputs share an output. For f(x)=x2 on R, both −3 and 3 give 9, so reversing f would send 9 back to two values. That reversed relation is not a function. A many-to-one function can be given an inverse by restricting its domain until it is one-to-one: on the domain x≥0, f(x)=x2 is one-to-one and its inverse is f−1(x)=x.
Values of an inverse without its formula
A value of f−1 can be found without a formula for f−1. Since f−1(b)=a means f(a)=b, finding f−1(b) means solving the equation f(x)=b.
A table of values of f is also a table of values of f−1, read from the bottom row to the top row.
x
0
1
2
3
4
f(x)
3
5
9
17
33
The graph of an inverse function
If the point (a,b) lies on the graph of y=f(x), then f(a)=b, so f−1(b)=a and the point (b,a) lies on the graph of y=f−1(x). Swapping the coordinates of every point is the same as reflecting in the line y=x. So the graph of y=f−1(x) is the reflection of the graph of y=f(x) in the line y=x.
y = f(x) = x² + 1, x ≥ 0
y = f⁻¹(x) = √(x − 1), x ≥ 1
y = x
Each point (a, b) on f matches the point (b, a) on f⁻¹. The two graphs are mirror images in y = x.
The graph shows how the domain and range swap. The function f(x)=x2+1, x≥0, has range f(x)≥1; its inverse f−1(x)=x−1 has domain x≥1 and range f−1(x)≥0.
Exam-style questions on functions and inverses
Questions often combine the domain, the range and an inverse with an equation that has more than one solution, where the domain decides which solution is valid.
Self-check
To do:
I can decide whether a relation is a function from a mapping, a list of pairs or a graph.
To do:
I can evaluate f(x) for numbers and expressions, and solve f(x)=k.
To do:
I can write domains and ranges as inequalities, in interval notation and in set notation.
To do:
I can find the natural domain of a function with square roots, fractions or logarithms.
To do:
I can find the range of a function on a given domain from a sketch of its graph.
To do:
I can choose a sensible domain for a function that models a real situation.
To do:
I can tell whether a function is one-to-one or many-to-one and explain why only one-to-one functions have inverses.
To do:
I can find values of f−1, state its domain and range, and sketch its graph by reflection in y=x.
and
[BC]
. Let
AC=x
m.
(a)
Show that cosCA^B=3x5x−80.
[4]4 marks
Markscheme (a)
BC=50−x(A1)
cosCA^B=2(30)(x)302+x2−(50−x)2
(b)
Find the value of x for which CA^B=90°.
[2]2 marks
Markscheme (b)
5x−80=0
(c)
Find the set of possible values of x.
[2]2 marks
Markscheme (c)
use of the triangle inequality, e.g. x+30>50−x and (50−x)+30>x
(d)
Show that the area of the enclosure, E m2, is given by E=20−x2+50x−400
(e)
Find the maximum area of the enclosure and the value of x for which it occurs.
[3]3 marks
Markscheme (e)
attempt to find the maximum of E (graph, or vertex of −x2+50x−400) (M1)
(f)
Find the values of x for which the area of the enclosure is 200 m2.
[2]2 marks
Markscheme (f)
20−x2+50x−400=200
Question 2 · AA-00191HL only · 7 marks
Consider the function f(x)=3sin(x+6π), where b≤x≤34π.
(a)
Find the smallest value of b for which the inverse function f−1 exists.
(c) A function. Each student has exactly one date of birth, even though several students may share one.
(d) Not a function, in general. Two students born on the same day would make one input give two outputs.
(b) Replace x by (a+1):
f(a+1)=(a+1)2−3(a+1)=a2+2a+1−3a−3=a2−a−2
(c) Here the output is given and the input is unknown:
x2−3x=4⇒x2−3x−4=0⇒(x−4)(x+1)=0
so x=4 or x=−1. Both inputs give the output 4, so f is many-to-one.
gives
y=2
or
y=−2
. The graph is a parabola opening to the right, and the line
x=4
meets it twice.
(c) A function. Every input gives the output 7; the graph is a horizontal line, which meets each vertical line once. A function whose output never changes is called a constant function.
(d) Not a function. The single input 7 is paired with every value of y; the graph is a vertical line.
The range is −3≤f(x)<5, or [−3,5). The endpoint 5 is excluded because x=3 is not in the domain.
(b) Since x2≥0 for every real x, x2+1≥1, with equality at x=0. Every value above 1 is also reached. The range is g(x)≥1, or [1,∞).
(c) Sketch the graph on the domain. The endpoints give h(−2)=4 and h(3)=9, but the graph falls to 0 at x=0 in between. The range is 0≤h(x)≤9, or [0,9].
y = x², −2 ≤ x ≤ 3
The lowest point is at x = 0, not at an endpoint, so the range is 0 ≤ h(x) ≤ 9.
x∈R,x=−2
x<5
, and the denominator must not be zero, so
x=1
. The domain is
x≤4
,
x=1
, or
(−∞,1)∪(1,4]
.
(c) The square root needs 2x+6≥0, but it is also in the denominator, so it must not be zero. Together, 2x+6>0, which gives x>−3. The domain is (−3,∞).
(d) The logarithm needs x2>0, which is true for every real x except 0. The domain is x∈R, x=0.
.
So f−1(11)=2.
(b) Solve x3+3=−5:
x3=−8⇒x=−2
So f−1(−5)=−2.
, and
f(2)=9
. So
f(f−1(9))=9
.
(c) f(1)=5, and f−1(5)=1. So f−1(f(1))=1.
Parts (b) and (c) show the defining property: applying a function and then its inverse, in either order, returns the starting value.
at
x=3
, and it increases without limit. So
f(x)≥0+1
, and the range is
f(x)≥1
.
(b) The domain of f−1 is the range of f: x≥1. The range of f−1 is the domain of f: f−1(x)≥3.
(c) Plot a few points of f: (3,1), (4,2), (7,3). Swap the coordinates to get points of f−1: (1,3), (2,4), (3,7). Reflect the curve in y=x.
y = f(x)
y = f⁻¹(x)
y = x
The graph of f starts at (3, 1) and the graph of f⁻¹ starts at the reflected point (1, 3).
.
(c) Solve f(x)=4:
2x−4=4⇒2x−4=16⇒x=10
So f−1(4)=10.
(d) Domain of f−1: x≥0 (the range of f). Range of f−1: f−1(x)≥2 (the domain of f).
(e) The graph of f starts at (2,0) on the x-axis and passes through (4,2) and (10,4). Reflecting in y=x, the graph of f−1 starts at (0,2) on the y-axis and passes through (2,4) and (4,10).
y = f(x)
y = f⁻¹(x)
y = x
The endpoints (2, 0) and (0, 2) are reflections of each other in y = x. These two graphs never meet.
A sketch earns its marks for the correct shape, the labelled endpoints on the axes, the restricted domains (no curve to the left of x=2 for f, none to the left of x=0 for f−1) and the visible symmetry in y=x.
. Show that
g
does not have an inverse. [2]
, so the range is
f(x)≥1
.
(c) On the domain x≥3, f is increasing, so every horizontal line meets the graph at most once. Hence f is one-to-one and has an inverse.
(d) Solve f(x)=5:
x2−6x+10=5⇒x2−6x+5=0⇒(x−1)(x−5)=0
so x=1 or x=5. Since the domain of f is x≥3, reject x=1. Hence f−1(5)=5.
(e) Part (d) shows that g(1)=5 and g(5)=5. Two different inputs give the same output, so g is many-to-one and has no inverse.
M1
=60x900+x2−2500+100x−x2A1
=60x100x−1600A1
=3x5x−80AG
(M1)
x=16A1
(M1)
10<x<40A1
Note: Award (M1)A0 for non-strict inequalities.
.
[4]4 marks
Markscheme (d)
E=21(30)(x)sinCA^B and sinCA^B=1−(3x5x−80)2M1
E=15x×3x9x2−(5x−80)2
=59x2−25x2+800x−6400=5−16x2+800x−6400
=516(−x2+50x−400)
E=20−x2+50x−400AG
x=25
A1
maximum area =300 m2A1
(M1)
x=13.8 or x=36.2(13.8196…,36.1803…)A1
Note: Accept exact values 25±55.
(c)
For this value of b, find an expression for f−1(x).
[4]4 marks
, stating its domain.
[3]3 marks
(d)
The graph of f, the line x=b and the x-axis enclose a region. Find the area of this region.