2.10 Solving equations · IB Maths AA | Augment Education
2.10 Solving equations
Solve equations analytically where algebra allows and graphically or with a GDC where it does not, count solutions from a graph, and interpret and check solutions of equations that model real situations.
IB Mathematics: Analysis and Approaches
Part of 2 Functions
SL and HL
Key terms introduced here
Each is in the Maths AA glossary, with every other term in the subject.
A solution found approximately, for example from a graph or by a GDC, given as a decimal to a stated accuracy. It is used when no algebraic method can isolate the variable.
Notes on 2.10 Solving equations
23 min readLast reviewed
Questions on 2.10
143 exam-style questions on this subtopic, written in the style of the IB papers. The first has its markscheme open. Counted on
Question 1 · AA-0007017 marks
A glass is in the shape of an inverted right cone with its vertex at the bottom. The radius of the circular rim is 4 cm and the depth of the glass is 12 cm. Ignore the thickness of the glass.
Water is poured into the glass to a depth of h cm.
(a)
Show that the volume of water, V cm3
Try a quick-fire question
One of 28 short multiple-choice questions on 2.10. Pick an answer to see why it's right or wrong.
For which values of m does the line y=mx touch the curve y=x2+1
Carry on with 2.10 in Augment
With a free account, Augment remembers where you stopped and what you have practiced.
Use a GDC to solve equations that have no analytic method, such as ex=3−x2, by the intersection method or the zero method.
Determine the number of solutions of an equation from a graph, including equations that contain a parameter.
Solve equations that arise from models of real situations, interpret the solutions in context and reject those that are impossible.
Check solutions by substitution and give answers to an appropriate accuracy.
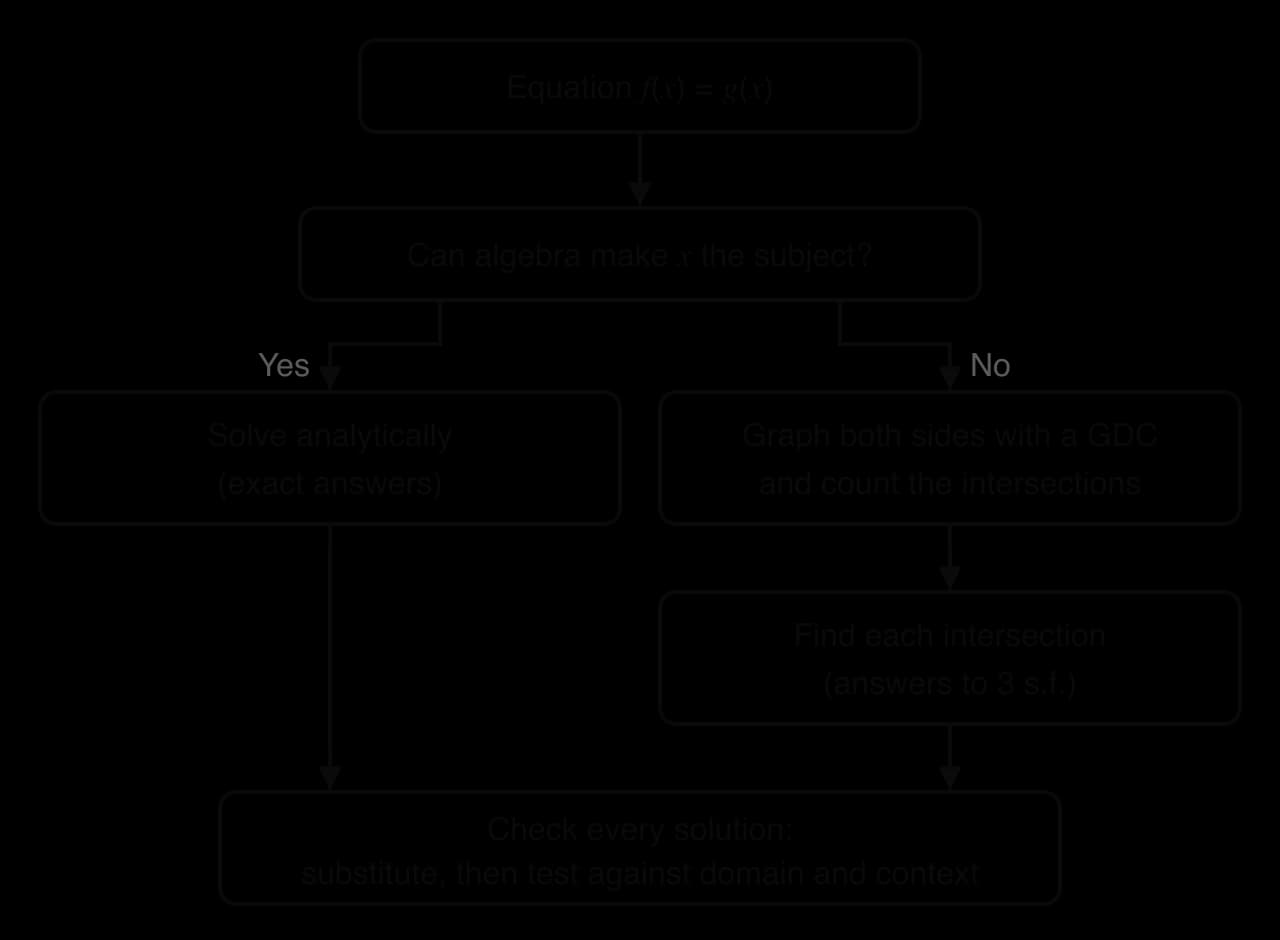
Solving an equation means finding every value of the unknown that makes it true. Some equations, such as 2x+5=11 or x2−5x+6=0, can be solved exactly with algebra. Many others, including some that look simple, such as ex=3−x2 or sinx=2x, cannot be rearranged to make x the subject at all; they can only be solved approximately, by graphs or by technology.
A reliable approach to any equation uses both views. Algebra gives exact answers where it can, and the graph shows how many solutions there are and roughly where they lie, so that none is missed. In applications, the solutions then need to be interpreted: a model may produce values that make no sense in the real situation, and these must be rejected.
Analytic and graphical solutions
What a solution is
A solution (or root) of an equation is a value of the unknown that makes the two sides equal. The set of all solutions is the solution set, and it may contain no values, one value, several values or infinitely many. For example, x2=4 has the solution set {−2,2}, while x2=−4 has no real solutions.
There are two kinds of answer, depending on the method.
An analytic solution is exact and shows the structure of the answer, so it is preferred whenever algebra can produce one. A numerical solution is the only option when no algebraic method can isolate the unknown, and it is often the quicker route when a graphic display calculator (GDC) is available and an exact value is not asked for. In practice the two are used together: the analytic answer x=ln3 can be checked by evaluating it as 1.0986… and comparing with a graph.
The graphical meaning of a solution
Any equation in one unknown can be written as f(x)=g(x), with an expression on each side. Each side defines a graph, y=f(x) and y=g(x), and at a point where the graphs meet, both have the same y-value for the same x-value. So:
the solutions of f(x)=g(x) are the x-coordinates of the points of intersection of y=f(x) and y=g(x);
the number of solutions equals the number of intersection points.
Moving everything to one side gives a second graphical view. The equation f(x)=g(x) is equivalent to f(x)−g(x)=0, so its solutions are the zeros of the function h(x)=f(x)−g(x), the x-intercepts of y=h(x). Both views give the same solutions, as the graphs of the equation x2=x+2 show.
y = x²
y = x + 2
y = x² − x − 2
The curve y = x² meets the line y = x + 2 where x = −1 and x = 2. The same x-values are the zeros of y = x² − x − 2, the difference of the two sides.
The algebra agrees: x2−x−2=(x−2)(x+1)=0 gives x=−1 or x=2. The solutions are the x-coordinates only. The intersection points (−1,1) and (2,4) are not themselves solutions of the equation.
Solving from a given graph
When a graph is printed with a question, solutions can be read from it to the accuracy that the scale allows. The method is to draw (or imagine) the graph of the other side of the equation and read the x-coordinates of the intersections. An equation such as f(x)=3 is solved by drawing the horizontal line y=3; an equation such as f(x)=x by drawing the line y=x.
The graph of y=x3−3x for −2.5≤x≤2.5 has a local maximum at (−1,2) and a local minimum at (1,−2). It is used in the next example.
y = x³ − 3x
The turning points at (−1, 2) and (1, −2) separate the heights that the curve reaches once from those it reaches three times.
The method in part (c) works for any equation of the form f(x)=k: slide a horizontal line up and down the graph and count the intersections. The changes in the number of solutions happen at the turning points and at any asymptotes.
Choosing a method
The first step with any equation is to decide whether algebra can solve it. The table lists the common types and their methods.
Type of equation
Example
Analytic method
Linear
3(x−2)=7−x
Expand and collect terms
Quadratic
2x2+x−6=0
Factorise, complete the square or use the quadratic formula (2.7)
Quadratic in disguise
e2x−5ex+6=0
Substitute u=ex
Exponential
3x+1=20
Take logarithms of both sides (1.7)
Logarithmic
lnx+ln(x−2)=ln3
Combine logarithms, then remove them (1.7)
Rational
x−13=x+1
Multiply by the denominator, then solve (2.8)
Mixed types
ex=3−x2
None: solve with technology
An equation has an analytic solution when the unknown can be isolated, which usually means it appears in only one "kind" of place. In ex=3−x2 the unknown is both in an exponent and in a polynomial; taking logarithms gives x=ln(3−x2), which still has x on both sides, and no algebraic step removes it. Such equations are solved numerically.
Whichever route is taken, every solution is checked at the end, both in the original equation and against the domain or the context.
Solving equations analytically
Exact solutions by algebra
Analytic methods transform an equation into simpler equivalent equations until the unknown is isolated. Each step must be reversible, or every answer checked at the end, because some steps can create or lose solutions.
When the unknown appears in the same expression more than once, a substitution may turn the equation into a familiar type. An equation in e2x and ex is a quadratic in ex, because e2x=(ex)2.
Solutions that must be rejected
Some algebraic steps produce values that do not satisfy the original equation. Combining logarithms is one example: lnx+ln(x−2) is only defined when x>0 and x>2, but the combined form ln(x(x−2)) is also defined when x<0. Squaring both sides of an equation is another: x=3 has one solution, but x2=9 has two.
Solving equations with technology
Equations with no analytic method
Consider the equation ex=3−x2. The graphs of y=ex and y=3−x2 show at once that there are exactly two solutions, one negative and one positive. The exponential curve is always positive and increasing, while the parabola has a maximum of 3 at x=0, so they cross once on each side of the y-axis and never again: for x>0.9 the parabola is already below the exponential and falling, and for x<−1.8 it is negative.
y = eˣ
y = 3 − x²
The curves cross exactly twice, so the equation eˣ = 3 − x² has two solutions: x ≈ −1.68 and x ≈ 0.834.
A GDC finds each intersection to many decimal places: x=−1.67723… and x=0.834487…, so to 3 significant figures x=−1.68 or x=0.834. No algebraic method can give these values exactly.
Three ways to solve with a GDC
A GDC offers three methods. All give the same values; they differ in how much they show and how easily a solution can be missed.
Method
What to enter
Strengths and risks
Intersection
Graph y=f(x) and y=g(x); use the intersect function at each crossing
Shows every solution in the window, so the number of solutions is clear; the window must be wide enough
Zero
Graph y=f(x)−g(x); use the zero (root) function at each x-intercept
Only one curve to read; the expression must be rearranged correctly first
Numerical solver
Enter the equation and an initial guess
Fast, but finds only one solution at a time, the one nearest the guess; others are easily missed
For ex=3−x2, the zero method uses h(x)=ex+x2−3, whose x-intercepts are at the same two values. The numerical solver started from a guess of 1 returns only 0.834…; the negative solution appears only if a second guess, such as −2, is tried. For this reason, always graph first: the graph shows how many solutions to look for, and then each one can be found with whichever method is convenient.
Equations involving trigonometric functions
The same methods apply to equations containing trigonometric functions. Calculations use radians unless the question uses degrees (see 3.4 and 3.8), and the GDC must be set to the matching mode.
Deciding the number of solutions without solving
Sometimes the number of solutions can be found by reasoning about the graphs, without any calculation. Two useful facts are:
an increasing function and a decreasing function meet at most once;
if f(x)−g(x) changes sign between x=a and x=b, and both functions are continuous there, the graphs cross at least once between a and b.
For example, lnx=2−x has exactly one solution: lnx is increasing, 2−x is decreasing, and at x=1 the left side is smaller (0<1) while at x=2 it is larger (0.693>0). The GDC gives the solution x≈1.56.
Equations in context
Solving, interpreting and checking
When an equation comes from a model, solving it is only part of the work. The process has four stages:
Form the equation from the model and the condition in the question ("when does the population reach 50 000?" becomes P(t)=50 if P is in thousands).
Solve it, analytically or with technology.
Interpret each solution in the context: what it means, in the right units, and to a sensible accuracy.
Reject solutions that are impossible: negative times or lengths, values outside the domain of the model, or values beyond the range where the model is valid.
The domain of a model is often set by the context rather than by the algebra, so every solution should be compared with it. A model of a ball's flight is valid only while the ball is in the air; a model of a business is valid only for whole numbers of items sold, and only up to the capacity of the factory.
Break-even and intersection models
A common application compares two quantities modelled by different functions: cost and revenue, supply and demand, or two competing populations. The values at which they are equal are the solutions of an equation, and the graphs show which quantity is larger on each side of these values.
The next model cannot be solved with algebra, because time appears both in an exponent and in a linear term.
This comparison of linear and exponential growth is a pattern that appears in many models: whatever the starting values, an exponentially growing quantity eventually overtakes any linearly growing one.
Rejecting impossible solutions
Geometry and measurement models often produce solutions that are mathematically correct but physically impossible. A length or a time must be positive, and the dimensions of an object must all be positive at once.
Equations with two meaningful solutions
When a quantity rises and then falls, it passes through most values twice, and both solutions can be meaningful. Together they usually describe an interval of time during which some condition holds.
Exam-style questions on solving equations
The first question can be answered without a GDC and uses a "hence" link between parts; the second is a typical GDC question on intersections.
Self-check
To do:
I can explain why the solutions of f(x)=g(x) are the x-coordinates of the intersections of y=f(x) and y=g(x).
To do:
I can decide whether an equation can be solved analytically, and choose a suitable method.
To do:
I can solve equations that reduce to quadratics, including those in ex or 2x, and give exact answers.
To do:
I can recognise and reject solutions that fall outside the domain of the original equation.
To do:
I can solve an equation with a GDC by the intersection method or the zero method, and find every solution.
To do:
I can find the number of solutions of f(x)=k from a graph, including the values of a parameter k that give a certain number of solutions.
To do:
I can form an equation from a model, solve it, interpret the solutions in context and reject impossible ones.
, is given by
V=27πh3
.
[3]3 marks
Markscheme (a)
radius of water surface =r, with hr=124 (similar triangles) M1
r=3hA1
V=31π(3h)2h
V=27πh3AG
(b)
The glass contains 150 cm3 of water. Find the depth of the water.
[2]2 marks
Markscheme (b)
27πh3=150(M1)
h=10.9 (cm) (10.8834…)A1
(c)
Let α be the angle between the side of the glass and its vertical axis. Show that sinα=101.
[2]2 marks
Markscheme (c)
tanα=124 OR slant height =42+122=160
(d)
A solid ball of radius 1.5 cm is dropped into the glass. The ball rests against the side of the glass, with its centre on the axis of the glass.
Show that the centre of the ball is 1.510 cm above the vertex of the glass.
[2]2 marks
Markscheme (d)
the radius to a point of contact is perpendicular to the side, forming a right-angled triangle with hypotenuse d from the vertex to the centre M1
sinα=d1.5A1
d=1.510AG
(e)
Find the new depth of the water, assuming the ball is completely under the water.
[4]4 marks
Markscheme (e)
volume of ball =34π(1.5)3=14.1371…(A1)
27πh3=150+14.1371…(M1)(A1)
h=11.2 (cm) (11.2151…)A1
(f)
Verify that the ball is completely under the water.
[2]2 marks
Markscheme (f)
top of ball is 1.510+1.5=6.24341… cm above the vertex A1
6.24<11.2, so the ball is completely under the water R1
Note: Award A1R1FT for comparison with their depth from part (e).
(g)
Find the volume of water that must be added for the water to reach the rim of the glass.
[2]2 marks
Markscheme (g)
capacity of glass =27π(12)3=64π=201.061…(A1)
201.061…−164.137…=36.9 cm3(36.9247…)A1
Note: Award (A1)A0 for 51.1 cm3 (ball ignored).
Question 2 · AA-0009317 marks
A straight wall [AB] has length 30 m. A triangular enclosure ABC is made using the wall as one side and 50 m of fencing for the other two sides, [AC] and [BC]. Let AC=x m.
(b) Factorise: x(x2−3)=0, so x=0 or x2=3. The solutions are x=−3, 0 and 3.
(c) The solutions of x3−3x=k are where the horizontal line y=k meets the curve. The line meets the curve three times when it lies strictly between the local minimum and local maximum values. At k=2 or k=−2 the line touches a turning point and there are only two solutions; for k>2 or k<−2 there is one. So there are exactly three solutions when −2<k<2.
y = x³ − 3x
A horizontal line y = k meets the cubic three times only while it lies strictly between the turning points, so −2 < k < 2.
and solve the quadratic (2.7)
. The solutions are
x=−2
and
x=2
.
gives
x=ln3
. Both values of
u
are positive, so both give real solutions. (If a value of
u
had been negative or zero, it would have been rejected, because
ex>0
for every
x
.)
), reject it. The only solution is
x=3
. Check:
ln3+ln1=ln3+0=ln3
.
, so
x=2
and
x=4
. The third solution has no exact form; the GDC gives
x=−0.76666…
.
y = 2ˣ
y = x²
The exponential and the parabola meet three times. The negative solution is easy to miss with a narrow window or a single guess in a solver.
, since
sin0=0
. The GDC gives the positive solution
x=1.89549…
, and because both graphs have rotational symmetry about the origin (
sin(−x)=−sinx
), the negative solution is its opposite.
y = sin x
y = x/2
The line y = x/2 leaves the band −1 ≤ y ≤ 1 at x = ±2, so the three intersections inside that interval are the only solutions.
Multiply by 20 to clear the decimals: x2−500x+40000=0, which factorises as (x−100)(x−400)=0. So x=100 or x=400; both lie in the domain. The company breaks even when it makes 100 items or 400 items.
(b) The company makes a profit where R(x)>C(x), that is where the revenue curve lies over the cost line. Between the break-even points, at x=200 for example, R=6000 and C=5000, so the profit region is 100<x<400: from 101 to 399 items.
C(x) = 2000 + 15x
R(x) = 40x − 0.05x²
The company makes a profit between the two break-even points, where the revenue curve is higher than the cost line.
with the GDC, using the intersection of
y=20e0.03x
and
y=30+0.8x
for
x≥0
. The intersection is at
t=35.90…
, so after about 35.9 years the population (about 58 700) reaches the number that the food supply can support. After this, the exponential growth overtakes the linear growth of the food supply.
(c) The study starts at t=0, so the domain of the model is t≥0. A negative value of t refers to a time before the study began, where the model was not intended to apply, so it is rejected.
P(t) = 20e^(0.03t)
F(t) = 30 + 0.8t
Linear growth stays ahead at first, but exponential growth always overtakes it eventually; here the curves cross after about 35.9 years.
.
(b) V=3(10−6)2=3×16=48 cm³.
(c) Solve x(10−2x)2=48. Expanding gives x(100−40x+4x2)=48, so
4x3−40x2+100x−48=0⟹x3−10x2+25x−12=0
Part (b) shows that x=3 is a solution, so x−3 is a factor. Dividing, x3−10x2+25x−12=(x−3)(x2−7x+4), and the quadratic formula gives
x=27±49−16=27±33
so x≈0.628 or x≈6.37. (A GDC gives the same three solutions of the cubic directly.) The value 6.37 is rejected because it is not less than 5: the base would have side 10−2(6.37)<0. The volume is 48 cm³ when x=3 or x=27−33≈0.628.
V(t) = 600te^(−0.4t)
The rate of visits rises quickly after the advertisement and then falls away; it is over 500 per hour between the two solutions.
, the equation becomes
u2−6u+8=0
. In a "show that" part, the step
4x=(2x)2
must be written down.
(b) Factorise: (u−2)(u−4)=0, so u=2 or u=4. Then 2x=2 gives x=1, and 2x=4 gives x=2.
(c) The equation 4x+8=6×2x is the equation in part (a) rearranged, so the graphs meet where x=1 and x=2. Substituting into y=6×2x: when x=1, y=12; when x=2, y=24. The points are (1,12) and (2,24). Check in the other equation: 4+8=12 and 16+8=24.
and
x=2
and its vertex at
(1,−1)
.
y = ln(x + 3)
y = x² − 2x
The logarithmic curve lies over the parabola between the two intersections, at x ≈ −0.399 and x ≈ 2.65.
(b) The graphs meet twice, so there are 2 solutions.
(c) Using the intersect function of the GDC: x=−0.39859… and x=2.65293…, so x=−0.399 or x=2.65 (3 s.f.).
(d) f(x)>g(x) where the graph of f is higher than the graph of g, which is between the intersections: −0.399<x<2.65.
A1
M1
sinα=1604A1
sinα=101AG
Find the value of x for which CA^B=90°.
[2]2 marks
(c)
Find the set of possible values of x.
[2]2 marks
(d)
Show that the area of the enclosure, E m2, is given by E=20−x2+50x−400.
[4]4 marks
(e)
Find the maximum area of the enclosure and the value of x for which it occurs.
[3]3 marks
(f)
Find the values of x for which the area of the enclosure is 200 m2.