Explain what marketing is, distinguish market orientation from product orientation, calculate and interpret market share and market growth, and (HL) evaluate the importance of market share and market leadership.
Each is in the Business glossary, with every other term in the subject.
A market in which businesses sell goods or services to other businesses, such as machinery, raw materials or accounting services, rather than to final consumers.
A market in which businesses sell goods or services directly to individual consumers for their own use, such as food, clothing or streaming subscriptions.
The combined market share of a stated number of the largest businesses in a market, such as the three-firm concentration ratio, used to measure market concentration.
Any place or system, physical or online, where buyers and sellers come together to exchange a particular good or service.
The degree to which sales in a market are controlled by a small number of the largest businesses, often measured by a concentration ratio.
The percentage change in the size of a market over a period, calculated by comparing current market size with market size in the previous period.
The business or brand with the largest market share in a particular market, measured by value or by volume of sales.
An outward-looking approach in which a business uses market research to find out what customers want and then develops and markets products to meet those needs.
Define marketing and explain its role in a business.
Describe different types of market, including consumer (B2C) and industrial (B2B) markets.
Distinguish between market orientation and product orientation, with examples.
Explain the advantages and disadvantages of each orientation, and of societal marketing.
Calculate market size, market share and market growth from given data.
Explain what market share, market concentration and market growth show about a market.
Evaluate the importance of market share and market leadership (HL).
Marketing is the part of a business that identifies what customers need and want and makes sure the business offers products that satisfy them, at a profit. It connects a business with its customers: a product that nobody wants to buy will fail however well it is made, so every business depends on marketing to survive and grow.
The global smartphone market shows how quickly fortunes in a market can change. Nokia was the world's largest maker of mobile phones from 1998 to 2012, yet within a few years of the first iPhone it had sold its phone business to Microsoft, while Apple and Samsung became the two market leaders.
Key concept | How it applies to marketing |
|---|---|
Change | Social, cultural and technological change alters what customers want and how they can be reached, from mobile phones to social media. |
64 exam-style questions on this subtopic, written in the style of the IB papers. The first has its markscheme open. Counted on
Kirima and Mlima dairy co-operatives
Kirima Dairy Co-operative and Mlima Milk Co-operative are farmer-owned co-operatives in central Kenya. Each collects milk from its members, small-scale farmers with three to ten cows, then processes it into fresh milk, yoghurt and mala (fermented milk). Profits are shared among members according to how much milk they supply.
Both co-operatives struggle to compete with Brookfresh plc, the largest processor in the region. Brookfresh pays farmers less per litre, but its modern plant processes milk at a lower cost and it supplies supermarkets across Kenya. The boards of Kirima and Mlima have proposed a merger to form Mlima-Kirima Dairies. The merged co-operative would close Mlima’s older plant and invest KES 300 million in Kirima’s site.
Some Mlima members are unhappy: their collection centres would be further away, and they fear that one combined board would pay more attention to Kirima’s larger membership.
Table 1: Annual sales revenue of milk processors in the region, 2025
Processor | Sales revenue (KES million) |
|---|---|
Brookfresh plc | 14 400 |
Kirima Dairy Co-operative | 6 600 |
Mlima Milk Co-operative | 4 200 |
Other processors | 10 800 |
Table 2: Processing cost per litre (KES)
Cost per litre | |
|---|---|
Kirima (current) | 14 |
The official deck for this part of the syllabus.
Define marketing.
In the definition of marketing, state what each of these words means: identifying, anticipating, satisfying.
With a free account, Augment remembers where you stopped and what you have practiced.
The percentage of the total sales in a market that is accounted for by one business or brand over a given period, measured by value or by volume.
The total sales of all businesses in a market over a given period, measured either by value (sales revenue) or by volume (units sold).
The management process of identifying, anticipating and satisfying customers' needs and wants profitably, by deciding what to offer, at what price, where and how to promote it.
An inward-looking approach in which a business focuses on developing and making products it believes are good, then tries to persuade customers to buy them.
An approach to marketing that meets customers' wants profitably while also protecting or improving the long-term well-being of consumers, society and the environment.
Creativity
New products, new ways of reaching customers and new ways of seeing a market can give a business an advantage over its rivals. |
Ethics | Honest marketing builds trust in a brand; misleading claims, pressure selling and the misuse of customer data damage it. |
Sustainability | Customers increasingly expect products and promotion that consider the environment and society, which shapes the approach of societal marketing. |
Marketing is often confused with advertising or selling, but it is much wider. It begins before a product exists, with finding out what customers need, and continues after the sale, with service and building loyalty. Advertising is one small part of it.
Each part of the definition matters. "Identifying" means finding out what customers want now, usually through market research. "Anticipating" means predicting what they will want in the future, which matters in markets that change quickly. "Satisfying" means meeting those needs well enough that customers buy and come back. "Profitably" shows that, for most businesses, marketing must earn more than it costs; for a charity or a social enterprise, the equivalent aim is to meet the organisation's purpose efficiently.
A need is something people must have to live, such as food, water, shelter and clothing. A want is a particular way of satisfying a need that a person would like to have, such as a meal at a favourite restaurant or a branded jacket. Marketing works mainly with wants: businesses try to persuade customers that their product is the best way to satisfy a need.
Marketing decisions affect every other function, and depend on them. A plan to sell more must be matched by operations that can produce more, by finance that can fund the extra stock and promotion, and by human resource management that can recruit and train the staff needed. The decisions marketers make about the product, its price, its promotion and its distribution are known as the marketing mix, or the seven Ps once people, processes and physical evidence are added.
Marketing applies to goods and services, to private businesses and to public and non-profit organisations. A hospital marketing a vaccination programme, a university attracting international students and a charity raising donations all identify the needs of a group of people and plan how to meet them.
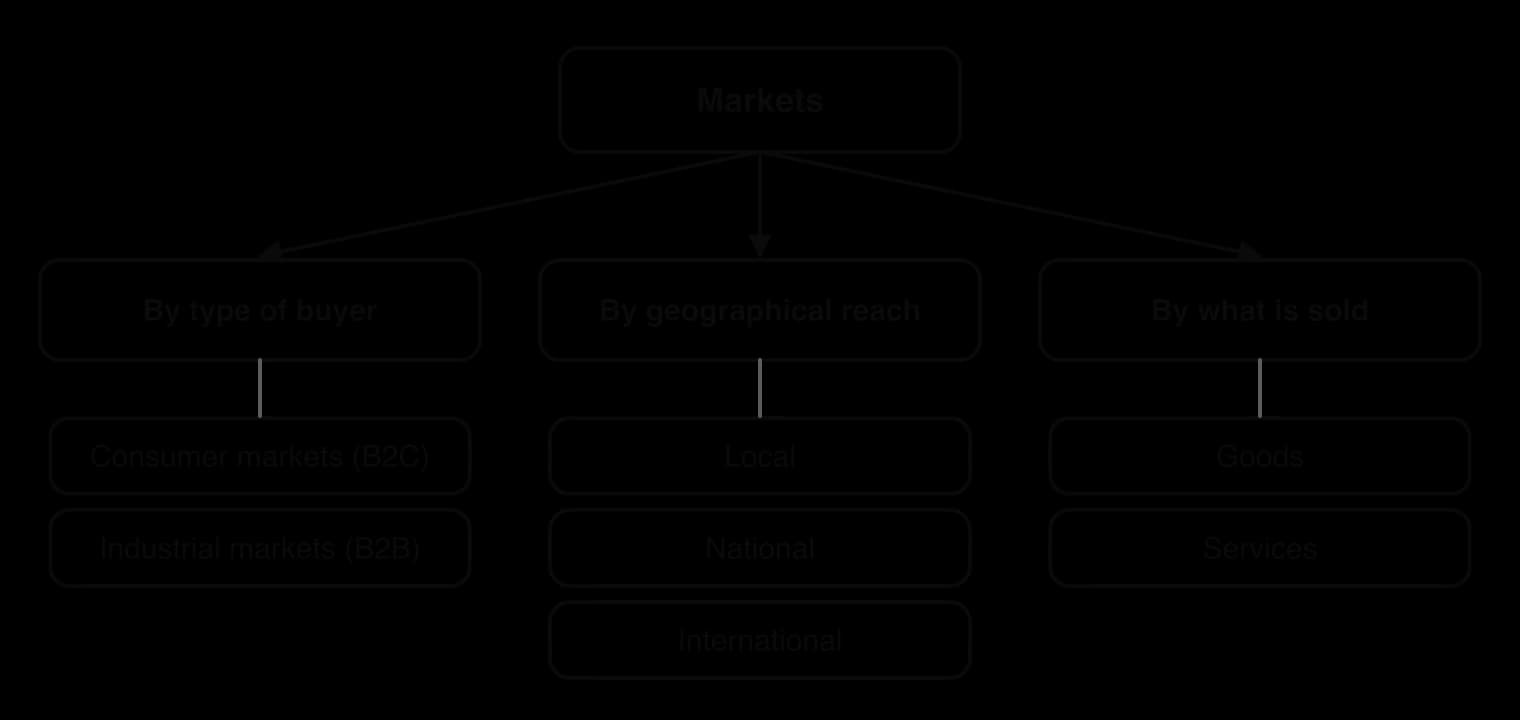
A market is where buyers and sellers meet to exchange a product. It can be a physical place, such as a fish market or a shopping centre, or a system with no single location, such as the world market for oil or the online market for second-hand clothes. In marketing, "the market" also means the people and organisations who buy a particular product, as in "the market for electric cars".
The classification shows three common ways of describing a market. The same business can operate in several kinds of market: a coffee roaster may sell bags of coffee to shoppers (a consumer market) and supply beans to restaurants (an industrial market), both nationally and abroad.
The most important distinction is between consumer markets, where the buyers are individual consumers, and industrial markets, where the buyers are other businesses. These are also called business-to-consumer (B2C) and business-to-business (B2B) markets.
Consumer markets usually have very many buyers, each making fairly small purchases. Consumers often buy on impulse or emotion and are influenced by brands, advertising, friends and social media. Nestlé, which sells coffee, chocolate and pet food to households in almost every country, operates mainly in B2C markets.
Industrial or B2B markets usually have fewer buyers making larger, more technical purchases. Decisions are made by trained buyers or committees, often after comparing quotations, and long-term relationships matter. ASML, a Dutch company, sells machines that print the patterns on computer chips to a small number of chipmakers around the world. It is a typical B2B market, in which each sale is worth millions of euros and depends on years of technical cooperation.
Feature | Consumer market (B2C) | Industrial market (B2B) |
|---|---|---|
Buyers | Many individual consumers | Fewer businesses or organisations |
Size of purchase | Usually small and frequent | Often large and less frequent |
How decisions are made | Quickly; influenced by emotion, brand and price | By professional buyers or committees, based on specifications, cost and reliability |
Relationship | Often short and impersonal | Often long-term, with contracts and personal contact |
Typical promotion | Mass advertising, social media, in-store displays | Personal selling, trade fairs, specialist publications |
Examples | Groceries, phones, holidays, haircuts | Steel, office cleaning, software for companies, aircraft engines |
Markets also differ in their geographical reach. A hairdresser or a plumber serves a local market. A national supermarket chain serves customers across one country. Many businesses now sell internationally, helped by e-commerce and lower transport costs, which gives them more customers but exposes them to more competitors and to different cultures, laws and currencies.
Businesses differ in where they start when they decide what to sell. Some start with the product: what they are good at making. Others start with the market: what customers want. These two approaches are called product orientation and market orientation.
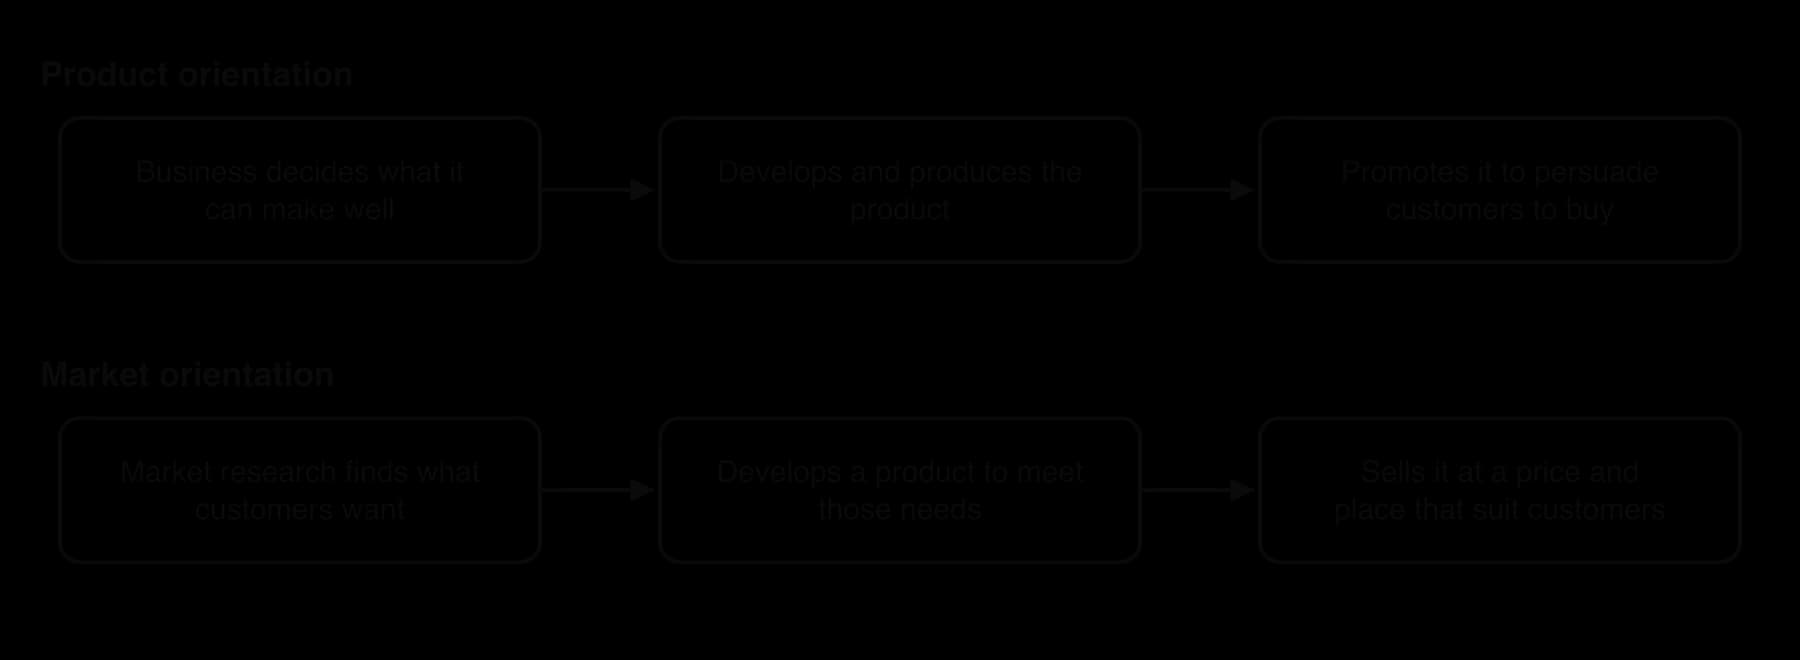
The flow diagram shows the order of decisions in each approach. In product orientation, persuading customers comes last, after the product has been made. In market orientation, research into customers comes first, and every later decision follows from it.
A product-oriented business concentrates on the quality, design and technology of its products. It assumes that a good enough product will find buyers, so it spends relatively little on market research. Product orientation is common where expertise and invention drive the market, such as pharmaceuticals, engineering, scientific instruments, luxury goods and fine art, and in businesses run by inventors or craftspeople.
Product orientation can lead to products that customers did not know they wanted, but it can also lead to costly failures. The Segway, a self-balancing two-wheeled personal transporter launched in 2001 with great publicity, was technically impressive, but it never became the mass-market product its makers hoped for, and production of the original model ended in 2020. Google Glass, smart glasses offered to early users from 2013, met concerns about price, usefulness and privacy and never reached the mass market.
Advantages of product orientation | Disadvantages of product orientation |
|---|---|
Focus on quality and technical excellence can build a strong reputation. | Products may not match what customers want, so sales can be low. |
Can produce genuine innovations that customers could not have described in advance. | High risk: large sums may be spent developing products that fail. |
Less spending on market research. | The business may miss changes in tastes and lose customers to rivals. |
Suits markets where expertise matters more than customer opinion (medicines, specialist equipment). | Promotion must work harder to persuade customers, which can be expensive. |
Can give a unique selling point that is hard to copy. | Inward-looking culture may resist change. |
A market-oriented business starts with the customer. It carries out market research, studies competitors and trends, and designs its products, prices, promotion and distribution around what it finds. It keeps listening after launch, adapting its products as customers' needs change. Most businesses in competitive consumer markets aim to be market-oriented.
Xiaomi, the Chinese electronics company, built its early reputation on market orientation. When it launched its MIUI phone software in 2010, it released updates every week and invited users on its online forums to suggest and vote on changes, so that customers helped shape the product before Xiaomi made its first phone. Fashion retailers that change their ranges quickly in response to sales data follow the same principle.
Advantages of market orientation | Disadvantages of market orientation |
|---|---|
Products are designed to meet identified needs, so they are more likely to sell. | Market research is expensive and takes time. |
Lower risk of product failure. | Customers cannot always describe needs they do not yet know they have, so radical innovation is less likely. |
The business can respond quickly to changes in tastes and to competitors. | Constant changes to products can raise costs and confuse the brand. |
Builds customer loyalty, because customers feel listened to. | Research may be unreliable: what people say they want is not always what they buy. |
Helps the business find gaps in the market. | Following the market can make products similar to rivals' products. |
 YouTube
Neither approach is better in every case. Market orientation suits competitive consumer markets where tastes change quickly and customers can easily switch to rivals, such as fashion, food and mobile apps. Product orientation suits markets driven by expertise or technology, where customers rely on the producer's knowledge (a new medicine, a jet engine), and luxury and craft markets where the maker's vision is part of the product's appeal.
In practice, most businesses combine the two. A technology company may invent a product from its own research and then use market research to decide how to price, promote and improve it. Some writers call this asset-led marketing: building on what the business is good at while checking that customers want the result. The balance a business chooses depends on several factors.
The type of market and the pace of change. Fast-changing consumer markets favour market orientation.
The level of competition. In a market with many close rivals, a product that ignores customers will quickly lose sales.
The nature of the product. Highly technical or innovative products rely more on the producer's expertise.
Resources. Market research costs money, which a small start-up may not have; equally, product development without research can waste much more.
Organisational culture and objectives. An engineering-led culture tends towards product orientation; a sales-led culture towards market orientation.
Market orientation asks what customers want. Societal marketing adds a further question: whether satisfying those wants is good for customers and society in the long run. A product can meet a customer's wish today, such as cheap fast fashion or sugary drinks, while harming health, workers or the environment.
Businesses that use societal marketing consider all their stakeholders, not only customers and owners. The Body Shop, the UK cosmetics retailer, built its brand on campaigns against testing cosmetics on animals and on buying ingredients through community trade schemes. Food companies that reduce sugar and salt in their recipes before regulation forces them to are also applying the idea.
Societal marketing links marketing to corporate social responsibility and to the triple bottom line of people, planet and profit. It can build trust, attract customers and employees who share the business's values, and reduce the risk of future regulation or boycotts. Its costs can be higher, and its claims must be genuine: a business that exaggerates its social or environmental benefits risks accusations of greenwashing, which can damage its reputation more than saying nothing.
Before a business can judge how well it is doing in a market, it needs to know how big the market is. Market size is the total sales of all the businesses in a market over a period, usually a year.
Market size can be measured in two ways. By value, it is the total revenue from sales, such as $10 million a year. By volume, it is the number of units sold, such as 2 million cups of coffee a year. The two measures can move differently: if prices rise, a market can grow by value while shrinking by volume.
Market size matters for several decisions. A large market offers more potential customers and may support several competitors and economies of scale; a small market may support only a few specialist firms. Managers use market size to judge whether to enter a market, how much to invest and how many staff to employ.
Market share measures how much of a market one business or brand controls. It shows a business's position compared with its competitors, which sales figures alone cannot show: a firm whose sales rise by 5% is losing ground if the whole market grows by 10%.
The firm's sales and the total market sales must be measured in the same way and over the same period: both by value or both by volume, and both for the same year or quarter. Market share is given as a percentage, usually to two decimal places.
A business's share by value and its share by volume are often different. A premium brand sells fewer units at higher prices, so its share by value is higher than its share by volume; a budget brand is the reverse. In the smartphone market, Apple's share of revenue is much larger than its share of units shipped, because its phones sell at high prices.
Chocolate brand (hypothetical) | Units sold (000) | Price ($) | Sales revenue ($000) | Share by volume | Share by value |
|---|---|---|---|---|---|
Brand A (budget) | 600 | 1.00 | 600 | 60.00% | 34.29% |
Brand B (mid-range) | 300 | 2.50 | 750 | 30.00% | 42.86% |
Brand C (premium) | 100 | 4.00 | 400 | 10.00% | 22.86% |
Market total | 1,000 | 1,750 | 100% | 100% |
Brand A leads the market by volume with 60% of units, but Brand B leads by value with 42.86% of revenue. Which measure matters depends on the business's objectives: a business aiming for scale and economies of scale watches volume share, while one aiming for profit and a premium image watches value share.
 YouTube
A high market share usually signals a strong brand, wide distribution and loyal customers, and it can bring the benefits of size. A falling share is a warning that competitors are winning customers, even if the business's own sales are rising. Market share data is therefore most useful when compared over time and with the shares of rivals.
Market share also has limits as a measure of success. A business can buy market share by cutting prices or spending heavily on promotion, which raises share but lowers profit. A small share of a large or fast-growing market may be worth more than a large share of a small or shrinking one. Share figures also depend on how the market is defined: a brand of sparkling water has a large share of "sparkling water" but a small share of "soft drinks".
Market shares also show how competitive a market is. In some markets, a few large firms make most of the sales; in others, sales are spread across many small businesses. This is described as market concentration.
A concentration ratio adds up the market shares of the largest firms. The three-firm concentration ratio (CR3) is the combined share of the three largest firms; the five-firm ratio (CR5) adds the top five. The higher the ratio, the more concentrated the market.

The two bars show the difference. In the concentrated market, three firms dominate, so each must watch the others closely and new firms find it hard to enter. In the fragmented market, many small firms compete, so no business can easily influence prices. Markets for large passenger aircraft, dominated by Airbus and Boeing, are extremely concentrated; markets for hairdressing, restaurants and taxis in most cities are fragmented.
Concentration affects strategy. In a concentrated market, firms often avoid price competition and compete through branding and new products, because a price cut is quickly matched. In a fragmented market, small firms can compete by serving local or niche markets well. Governments watch highly concentrated markets because a few dominant firms may raise prices or block new competitors.
Markets grow and shrink over time. Market growth measures the percentage change in the size of a market from one period to the next, which shows whether demand is rising or falling.
A positive figure means the market is growing; a negative figure means it is shrinking. Growth can be measured by value or by volume, and the two can differ when prices change. Market growth is the measure behind one axis of the BCG matrix, where it is called the market growth rate.
The example shows why market share and market growth must be read together. The combinations give four different pictures of a business's position.
Firm's market share rises | Firm's market share falls | |
|---|---|---|
Market grows | Strong position: the firm is growing faster than a growing market. | Sales may still rise, but rivals are growing faster. |
Market shrinks | The firm is winning customers from rivals in a declining market; sales may still fall. | Weak position: falling sales in a declining market. |
Market growth influences many business decisions. In a fast-growing market, a business can increase its sales without taking customers from rivals, so competition may be less intense and new entrants are attracted. In a mature or shrinking market, a business can grow only by winning share from competitors, which often leads to price competition, mergers and cost-cutting. Growth also affects investment: managers are more willing to build new capacity when the market is expanding.
A market leader is the business or brand with the largest share of a market. Many businesses set market share objectives, such as becoming the leading brand in a country within five years, because leadership can bring lasting advantages. Leadership can be measured by value or by volume, and a business can lead one segment of a market without leading the whole market.
Economies of scale. The largest firm usually produces the most, so it can buy materials more cheaply and spread its fixed costs over more units. Lower unit costs allow higher profit margins or lower prices than rivals can match.
Brand recognition and customer loyalty. A leading brand is the one customers know best and often see as the safe choice, which lowers the cost of winning each customer and supports brand loyalty.
Pricing power. A leader can often charge a premium price, or set the price that other firms follow, because customers trust its products.
Bargaining power with retailers and suppliers. Retailers want to stock the brand customers ask for, so a leader gains better shelf space and terms; suppliers want its large orders, so it negotiates lower prices.
Attracting investment and talent. Investors and lenders see a market leader as less risky, so it raises finance more easily and cheaply, and it attracts skilled employees.
Higher profits to reinvest. Profits from leadership can fund research and development, promotion and distribution, which help to defend the lead.

The diagram shows why leadership tends to last. A leader's lower costs and higher profits fund more spending on its brand and products, which win more customers and protect its share. This cycle explains why leading brands in many markets, from soft drinks to search engines, often keep their position for decades.
Regulatory scrutiny. Governments and competition authorities investigate dominant firms that may abuse their position. In August 2024 a US federal court ruled that Google had illegally maintained a monopoly in online search, and the European Commission has fined Google several times over its conduct in search and mobile software.
Complacency. A leader may stop listening to customers or stop innovating, assuming its position is safe. Market leaders such as Nokia in mobile phones have lost their lead when a new technology changed the market.
The cost of defending share. Holding a large share against determined rivals can require heavy promotion and price cuts, which reduce profit.
Share is not profit. A share won by low prices may bring little profit; a smaller firm serving a profitable niche may earn higher returns.
Less room to grow. A firm with most of a market can grow mainly by expanding the market or entering new ones, which is harder than winning customers from rivals.
A target for competitors. Rivals and new entrants often position themselves directly against the leader, and any mistake by the leader is widely reported.
Market leadership is usually most valuable in markets with large economies of scale and strong brand effects, such as consumer goods, telecommunications and digital platforms. In these markets, the benefits of being the largest firm feed on each other and are hard for smaller rivals to overcome. In markets where customers want variety and personal service, such as restaurants or fashion boutiques, size gives fewer advantages and many small firms succeed.
The importance of leadership also depends on the business's objectives. A business aiming for long-term growth and scale values share; one aiming for profitability or a premium image may prefer a smaller share at higher margins. Leadership also lasts only as long as the business adapts to change in technology and tastes, as Nokia's loss of its lead in mobile phones shows. On balance, market share and leadership are important sources of advantage, but most businesses pursue them as a way to achieve profitable and sustainable growth rather than as objectives in their own right.
The smartphone market shows the ideas of orientation, market share, market growth and market leadership at work in one global industry. Nokia, a Finnish company, was the world's largest mobile phone manufacturer from 1998 until 2012, selling phones in every price range and in almost every country. In 2007, Nokia smartphones made up 50.9% of all smartphones sold worldwide, and Symbian, the operating system Nokia used, ran most of the world's smartphones.
Apple launched the iPhone in 2007, a touchscreen phone built around a simple user experience, and opened its App Store in 2008, allowing outside developers to sell apps to iPhone users. Google's Android, adopted by Samsung and other manufacturers, followed. Nokia's share of smartphone sales fell to 40.8% in 2008, and Symbian's share of the smartphone market fell from 52.4% in 2008 to 4.4% in the second quarter of 2012.
In February 2011 Nokia's chief executive, Stephen Elop, told employees that the company was standing on a "burning platform" and announced a partnership with Microsoft to use Windows Phone as Nokia's main smartphone software. The change came too late: between 2011 and 2013 Nokia fell from first to tenth place in smartphone sales. In April 2014 Microsoft completed its purchase of Nokia's phone business for about €5.44 billion, including a ten-year licence to Nokia's patents, and in July 2015 it wrote down most of the value of the purchase and announced up to 7,800 job cuts.
Year | Nokia's share of worldwide smartphone sales |
|---|---|
2007 | 50.9% |
2008 | 40.8% |
2011–2013 | Fell from first to tenth place among smartphone makers |
Market leadership today belongs to Samsung and Apple. In the second quarter of 2026 the world smartphone market shrank by 7.4% compared with a year earlier, from 298.3 million to 276.3 million phones shipped, yet both leaders shipped more phones than before. Samsung's shipments rose by 8.1% and Apple's by 14.9%, while Xiaomi, OPPO and vivo all shipped fewer.
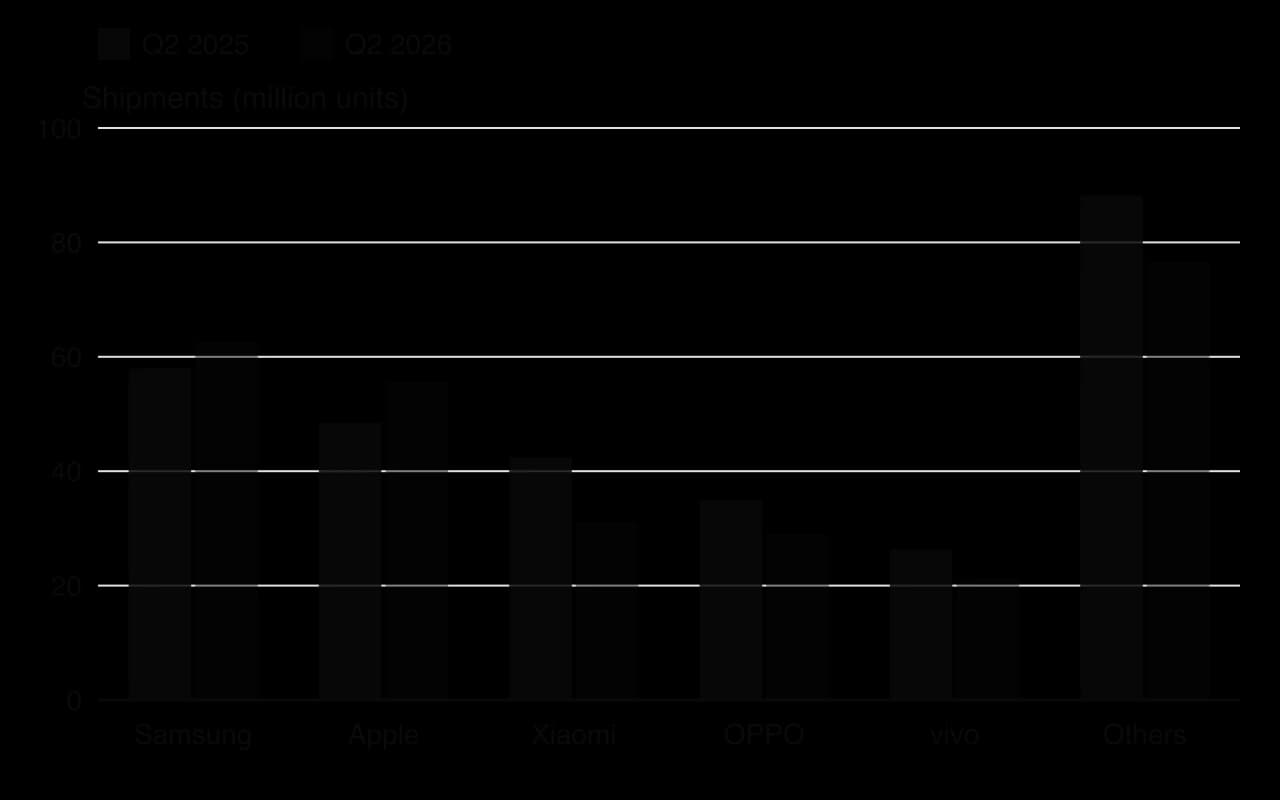
Company | Q2 2025 shipments (m) | Q2 2026 shipments (m) | Q2 2025 share | Q2 2026 share |
|---|---|---|---|---|
Samsung | 58.0 | 62.7 | 19.44% | 22.69% |
Apple | 48.5 | 55.7 | 16.26% | 20.16% |
Xiaomi | 42.4 | 31.2 | 14.21% | 11.29% |
OPPO | 34.9 | 28.9 | 11.70% | 10.46% |
vivo | 26.3 | 21.2 | 8.82% | 7.67% |
Others | 88.2 | 76.6 | 29.57% | 27.72% |
Total market | 298.3 | 276.3 | 100% | 100% |
The figures show the four-box logic of share and growth. Samsung and Apple increased both their sales and their shares in a shrinking market, taking customers from rivals: together they held 42.85% of shipments in Q2 2026, up from 35.70% a year earlier. Xiaomi, OPPO and vivo lost sales and share at the same time, the weakest position. The market as a whole was becoming more concentrated, with the five-firm concentration ratio at 72.28%.
The case also shows the limits of the two orientations as labels. Nokia was a skilled engineering company with strong market research, but it remained focused on its own hardware and software strengths while customers' expectations shifted to touchscreens, apps and ease of use. Apple is often described as product-oriented, because it designs products that customers had not asked for, yet its success came from understanding what users would value. The case suggests that a successful business combines technical strength with research into where the market is going.
Several limits apply to the case. Shipments are not the same as sales to final customers, quarterly figures can be affected by product launch dates, and share by volume understates Apple's position by value. The reasons for Nokia's decline were also complex, including its software platform and its management structure, not orientation alone.
Using the data, explain how Samsung and Apple increased their market shares in Q2 2026 although the market shrank.
Explain whether Nokia's decline is better described as a failure of market orientation or a failure to respond to change.
Discuss whether a market leader such as Samsung can rely on its leadership to protect it from the kind of decline Nokia experienced (HL).
Sources: IDC Worldwide Quarterly Mobile Phone Tracker, Q2 2026 (idc.com, August 2026); Gartner (2009, 2013), Canalys (2009) and IDC (2012) data, and Nokia and Microsoft announcements (2011, 2013–2015), as cited in Wikipedia, "History of Nokia", "Symbian" and "Microsoft Mobile", 2026. Shares calculated from IDC shipments.
Quantitative questions on market share often give data for two years and ask for both market growth and the change in a firm's share.
HL Paper 2 questions can ask for an evaluation of market leadership using data on a market's leading firms.
Marketing identifies, anticipates and satisfies customers' needs and wants profitably.
Markets can be consumer (B2C) or industrial (B2B), and local, national or international.
Product orientation starts with what the business can make; market orientation starts with what customers want. Each suits different markets, and most businesses combine them.
Societal marketing considers the long-term well-being of consumers, society and the environment as well as customers' wants.
Market share = firm's sales ÷ total market sales × 100; market growth = (current − previous market size) ÷ previous market size × 100.
Market share and market growth must be read together; concentration ratios show how far a few firms dominate a market.
A high market share and market leadership bring economies of scale, brand strength and bargaining power, but also regulatory scrutiny and the risk of complacency (HL).
I can define marketing and explain its role in a business.
I can distinguish between B2C and B2B markets, with examples.
I can distinguish between market orientation and product orientation and explain the advantages and disadvantages of each.
I can explain what societal marketing is and why businesses use it.
I can calculate market size and market share, by value and by volume.
I can calculate market growth and comment on a firm's performance using market share and market growth together.
I can explain market concentration and calculate a concentration ratio.
I can evaluate the importance of market share and market leadership (HL).
Mlima (current)
17 |
Brookfresh (current) | 12 |
Mlima-Kirima Dairies (forecast after the merger) | 12.50 |
Define the term merger.
2 marks
Award [1] for a partial definition that shows some understanding, e.g. “two businesses join together”.
Award [2] for a full definition, e.g. the agreement of two (or more) businesses, usually of similar size, to combine and form a new, single organization with joint ownership.
Candidates are not expected to word their definition exactly as above.
Using Table 1, calculate the market share of Mlima-Kirima Dairies after the merger (show all your working).
2 marks
Total market = 14 400 + 6 600 + 4 200 + 10 800 = KES 36 000 million
= 30.00 % (or 30 %)
Award [1] for correct working (including the total market) and [1] for the correct answer. Award a maximum of [1] if the % sign is missing.
Using Table 2, explain two economies of scale that could reduce Mlima-Kirima Dairies’ processing cost per litre.
4 marks
Technical economies: concentrating production on one site with KES 300 million of new investment means larger, more modern equipment running closer to capacity; Mlima’s older plant (KES 17 per litre) is closed.
Purchasing economies: buying packaging, cultures for yoghurt and fuel for a larger combined volume brings discounts.
Marketing economies: one brand and one sales team can win supermarket contracts across Kenya, spreading marketing costs over more litres.
Financial economies: a larger co-operative with more assets may borrow at lower rates.
The forecast cost of KES 12.50 is below both co-operatives’ current costs and close to Brookfresh’s KES 12.
Mark as 2 + 2: [1] for identifying a relevant economy of scale and [1] for explaining it with reference to the co-operatives or Table 2.
Using the case and Tables 1 and 2, to what extent will the merger benefit the members of the two co-operatives?
10 marks
Benefits to members:
Market share rises to 30 %, closer to Brookfresh’s 40 %, giving more bargaining power with supermarkets and a stronger brand.
Processing cost per litre falls to a forecast KES 12.50 (from 14 at Kirima and 17 at Mlima); lower costs mean a larger surplus to share among members, or a higher price paid per litre.
Investment of KES 300 million in a modern plant improves quality and allows sales across Kenya.
Greater security for farmers’ incomes against competition from Brookfresh.
Limits to the benefits:
Mlima members face longer journeys to collection centres: extra time and transport costs, and milk may spoil.
Loss of democratic voice: one board, dominated by Kirima’s larger membership, may put their interests second.
The KES 12.50 is only a forecast; integration costs, job losses at Mlima’s plant and the cost of the KES 300 million investment could reduce the gains.
Diseconomies of scale: managing a much larger co-operative may cause communication and coordination problems.
Brookfresh may respond aggressively (e.g. price cuts) to protect its 40 % share.
Possible judgement: the merger is likely to benefit members overall through lower costs and a stronger market position, but benefits are unequal: Kirima members gain most, while Mlima members bear the costs, unless the board guarantees representation and collection routes. Any well-supported judgement can achieve full marks.
Limitations: market share is by revenue only; no information on the price paid to farmers per litre, the financing of the KES 300 million, or how long savings will take.
Marks should be allocated according to the markbands below.
Additional guidance: an answer that makes no use of the data in Tables 1 and 2 (e.g. the 30 % market share or the cost per litre) can achieve a maximum of [4]. Answers that treat members as one group, without considering the different effects on Kirima and Mlima members, should not usually go beyond [8]. An answer without a judgement is typically limited to [6].
Loxley Acoustics
[1] Loxley Acoustics (LA) is a private limited company in Sheffield, United Kingdom, founded in 2012 by two acoustic engineers, Owen Pryce and Hamid Qureshi. LA designs and assembles wired studio headphones. Its products have won several engineering awards, and Owen describes LA’s approach as “build the best headphone we can, then find the people who appreciate it”. LA spends 11 % of its revenue on research and development (R&D) but has never carried out any formal market research.
[2] For many years LA sold most of its output to recording studios and professional musicians. Since 2022, however, sales have been flat. Retailers report that younger buyers want wireless headphones with noise cancelling, long battery life and a choice of colours. LA’s headphones are available only in black and only with a cable.
[3] In 2025 the board appointed Lerato Mokoena, previously a marketing director at a consumer electronics firm, as chief executive officer (CEO). Lerato wants LA to become market oriented. She has proposed spending £180 000 on a programme of primary market research, including surveys of 2 000 headphone buyers and focus groups in five cities, before LA designs its first wireless range.
[4] Owen and Hamid are worried. They argue that customers “do not know what they want until they hear it”, that the research would take six months and that £180 000 is almost half of LA’s annual profit. Hamid suggests that LA could instead use secondary data from market analyses and online product reviews, which would cost less than £10 000.
Define the term primary market research.
2 marks
Explain two advantages to LA of being product oriented (paragraph 1).
4 marks
Explain two reasons why LA’s sales may have been flat since 2022 (paragraph 2).
4 marks
Discuss whether LA should spend £180 000 on Lerato’s programme of primary market research before designing its wireless range.
10 marks
Kothrud Masala Co.
Kothrud Masala Co. is a family-owned business in Pune, India, that produces packaged spice blends for home cooking. In 2024 it changed its approach: before launching any new blend, it now tests recipes with groups of home cooks in different regions of Maharashtra and adapts them to local tastes. In 2025 it launched three regional blends developed in this way.
Table 1: Sales revenue in the packaged spice-blend market in Maharashtra (₹ million)
Brand | 2024 | 2025 |
|---|---|---|
Kothrud Masala | 420 | 495 |
Rasoi Gold | 880 | 900 |
Masala Mahal | 610 | 650 |
Other brands | 1 090 | 1 255 |
Define the term market share.
2 marks
Using Table 1, calculate the growth of the packaged spice-blend market between 2024 and 2025 (show all your working).
2 marks
Using Table 1, calculate Kothrud Masala’s market share in 2024 and in 2025 (show all your working).
2 marks
Using your answers to (b) and (c), comment on Kothrud Masala’s sales performance in 2025.
3 marks
Explain two benefits to Kothrud Masala of testing recipes with groups of home cooks before launching new blends.
4 marks
Markbands (10-mark extended response, Papers 1 and 2)
Marks | Level descriptor |
|---|---|
0 | The response does not reach the standard described below. |
1–2 | Little understanding of what the question demands. Business management tools and theories are barely used, or are irrelevant or inaccurate. Little or no reference to the stimulus material. No arguments are made. |
3–4 | Some understanding of what the question demands. Some use of tools and theories, but mostly inaccurate or not relevant. Use of the stimulus is superficial, often no more than the name of the organisation or person. Arguments are mostly unsubstantiated. |
5–6 | Understands what the question demands but addresses it only partially. Some relevant, accurate use of tools and theories. Some relevant use of the stimulus beyond names, but it does not effectively support the argument. Arguments are substantiated but mostly one-sided. |
7–8 | Mostly addresses what the question demands. Mostly relevant, accurate use of tools and theories. The stimulus generally supports the argument, with some lapses in clarity or relevance. Arguments are substantiated and show some balance. |
9–10 | Clear focus on what the question demands. Relevant, accurate use of tools and theories. Relevant stimulus material is integrated effectively to support the argument. Arguments are substantiated and balanced, and the limitations of the case or stimulus material are explained. |
A response with no judgement or conclusion is unlikely to reach the top band of a discuss, evaluate, examine or recommend question.