1.1 What is economics? · IB Economics | Augment Education
1.1 What is economics?
Explain what economics studies, why scarcity forces choices with opportunity costs, how economic systems answer the basic economic questions, and use the PPC and circular flow models.
IB Economics
Part of 1 Introduction to economics
SL and HL
Key terms introduced here
Each is in the Economics glossary, with every other term in the subject.
An increase in real output from using unemployed or inefficiently used resources, shown on a PPC as a movement from a point inside the curve towards the curve.
The three questions every economy must answer because of scarcity: what goods and services to produce and in what quantities, how to produce them, and for whom.
A factor of production made up of man-made goods used to produce other goods and services, such as machinery, tools, buildings and infrastructure; its factor income is interest.
The key concept that the economy is never static: economic variables, institutions, technology and society constantly change, and economics studies the causes and effects of those changes.
The need to decide between alternative uses of scarce resources; because not every want can be met, every choice involves giving something up, which is its opportunity cost.
A model of the economy showing how money flows between households and firms as spending and factor incomes, with leakages from and injections into the flow.
The situation where each extra unit of one good costs the same amount of the other good given up, because resources are equally suited to both; shown by a straight-line PPC.
Explain why economics is a social science and distinguish between microeconomics and macroeconomics.
Describe the four factors of production and the income each one earns.
Explain scarcity, choice and opportunity cost, and the link between scarcity and sustainability.
Explain how free market, planned and mixed economies answer the three basic economic questions.
Draw a production possibilities curve (PPC) and use it to explain scarcity, choice, opportunity cost, unemployment of resources and efficiency.
Distinguish between increasing and constant opportunity cost, and between actual growth and growth in production possibilities, using PPC diagrams.
Draw the circular flow of income model with leakages and injections and explain the interdependence it shows.
Apply the nine key concepts to a real economic issue.
Introduction
Economics studies how people, firms and governments choose to use limited resources to satisfy their needs and wants. Every society, from a household planning its weekly shopping to a city deciding who gets water in a drought, faces the same problem: there is never enough to do everything, so choices have to be made, and every choice has a cost.
The core ideas of economics are scarcity, choice and opportunity cost, the basic economic questions every society must answer, and the economic systems that answer them. Two simple models, the production possibilities curve and the circular flow of income, are used across the whole subject, and nine key concepts link every part of it.
Questions on 1.1
137 exam-style questions on this subtopic, written in the style of the IB papers. The first has its markscheme open. Counted on
Question 1 · ECON-0000425 marks
Every economy must decide how to use limited resources to satisfy the needs and wants of its population.
(a)
Using a production possibilities curve (PPC), explain the concepts of scarcity, choice and opportunity cost.
[10]10 marks
Markscheme (a)
Answers may include:
Terminology: definitions of scarcity (limited resources relative to unlimited needs and wants), choice (selecting between competing alternatives uses of resources), opportunity cost (the value of the next best alternative forgone), production possibilities curve (the maximum combinations of two goods that can be produced with all resources fully and efficiently employed, given technology).
Explanation: because factors of production are limited, the economy cannot produce beyond its PPC, so combinations outside the curve are unattainable (scarcity); society must choose a point on (or within) the curve, deciding which combination of the two goods to produce (choice); moving along the curve to produce more of one good requires resources to be transferred away from the other, so output of that good must be given up (opportunity cost); a concave curve shows that the opportunity cost rises as more of one good is produced because resources are not equally suited to both goods.
Diagram: a PPC with two goods on the axes; a point outside the curve labelled unattainable; a movement along the curve from point A to point B showing the gain in good X (ΔX) and the loss of good Y (ΔY) as the opportunity cost; may show a point inside the curve to contrast with efficient points.
A maximum of [6] should be awarded if only one or two of the three concepts are explained.
Try a quick-fire question
One of 56 short multiple-choice questions on 1.1. Pick an answer to see why it's right or wrong.
Which diagram shows the effect of a more educated and skilled labour force?
Flashcards for 1.1
The official deck for this part of the syllabus.
1.1 What is economics? · front
What is a social science?
1.1 What is economics? · front
Name three social sciences other than economics.
1.1 What is economics?250 cards
Carry on with 1.1 in Augment
With a free account, Augment remembers where you stopped and what you have practiced.
The way a society organises the ownership of resources and makes decisions about what, how and for whom to produce, ranging from free market to planned economies.
The level of prosperity and quality of life of people, including financial security, the ability to meet basic needs and to make choices that bring satisfaction.
The social science that studies how individuals, firms, governments and societies choose to use scarce resources to satisfy their needs and wants, and the consequences of those choices.
Making the best possible use of scarce resources, so that the greatest useful output is obtained from given inputs, or the output society values most is produced with the least waste.
A factor of production consisting of the ability to organise the other factors of production, take risks and start new businesses or ideas; its factor income is profit.
Fairness in the distribution of income, wealth or opportunities; a normative idea that is different from equality, which means everyone having the same.
The payments households receive for supplying factors of production: rent for land, wages for labour, interest for capital and profit for entrepreneurship.
An economic system in which resources are privately owned and the basic economic questions are answered by consumers and firms through the price mechanism, with little government intervention.
An increase in an economy's capacity to produce, from more or better factors of production or improved technology, shown as an outward shift of the PPC.
Individuals or groups of people living together who own the factors of production, sell their services to firms for factor incomes and buy goods and services as consumers.
Goods and services produced in other countries and bought by residents of the home country; spending on imports is a leakage from the circular flow of income.
The situation where each extra unit of one good costs more and more of the other good given up, because resources are not equally suited to both; shown by a PPC bowed outwards.
The way individuals, firms, governments and countries depend on each other, so that the decisions of one economic actor affect others, often in ways they did not intend.
Government involvement in markets or the economy, through laws, regulations, taxes, spending or direct provision, usually to correct market outcomes or pursue goals such as equity.
The nine central ideas that run through IB Economics: scarcity, choice, efficiency, equity, economic well-being, sustainability, change, interdependence and intervention.
A factor of production covering all natural resources, including the land surface, minerals, forests, fish stocks, water and the climate; its factor income is rent.
The branch of economics that studies the economy as a whole, including total output, unemployment, inflation, economic growth and the effects of government policies on them.
The branch of economics that studies the behaviour of individual decision-makers, such as consumers, firms and workers, and how individual markets and industries work.
An economic system that combines a market sector, where private firms and consumers make decisions through prices, with a public sector, where the government owns resources, provides services and regulates markets.
An economic system in which the government owns most resources and central planners decide what, how and for whom to produce, rather than market prices.
A curve showing the maximum combinations of two goods or services an economy can produce when all its resources are fully and efficiently employed, with given resources and technology.
The situation where goods are produced at the lowest possible cost, so that no more of one good can be produced without producing less of another; shown by any point on the PPC.
An academic discipline that studies human behaviour and the relationships between people in society, such as economics, psychology, sociology and political science.
Meeting the needs of the present generation without reducing the ability of future generations to meet their own needs, by limiting resource depletion and environmental damage.
The situation where some factors of production, such as workers, machines or land, are not being used to produce, so output is below the economy’s potential; shown by a point inside the PPC.
Scope: This subtopic is the same at SL and HL, with no HL extension. It covers what economics studies, scarcity, choice and opportunity cost, economic systems, the PPC model and the circular flow of income model; these ideas are then used throughout the rest of the syllabus.
Economics as a social science
Why economics is a social science
A social science studies human behaviour and the relationships between people in society. Psychology, sociology, political science and anthropology are social sciences, and so is economics. Its subject is people: how they decide what to buy, where to work, how much to save, and how those decisions combine to shape markets, countries and the world economy.
Economics differs from a natural science such as physics because people are not atoms. They learn, change their minds, react to what others do and respond to new laws or prices in ways that are hard to predict. A rise in the price of bread affects millions of buyers and bakers, each with different incomes, tastes and expectations. Economists therefore build simplified models of behaviour and test them against evidence, knowing that real behaviour is more varied than any model.
Economics is social in a second sense: decisions are interconnected. A worker’s wage is a firm’s cost; a household’s spending is a firm’s revenue; one country’s imports are another country’s exports. This web of connections is called interdependence, and it means that a decision taken in one place often has effects, intended or not, somewhere else.
Microeconomics and macroeconomics
Economics is divided into two main branches. Microeconomics looks at the individual parts of the economy: single consumers, firms, workers and markets. It asks, for example, why the price of coffee rose, how a tax on sugary drinks changes what people buy, or why a few large firms dominate the market for smartphones.
Macroeconomics looks at the economy as a whole. It studies total output, the general level of prices, the number of people out of work, the rate of economic growth, and how government and central bank policies affect them. A third area, the global economy, extends these ideas to trade, exchange rates and development between countries.
Question
Branch
Why
Why did the price of cocoa rise sharply in 2024?
Microeconomics
It concerns one market and the decisions of its buyers and sellers.
How does a minimum wage affect employment in restaurants?
Microeconomics
It concerns one labour market and the firms in it.
Why did inflation rise in many countries in 2022?
Macroeconomics
It concerns the general price level across the whole economy.
Should the government cut income tax to raise economic growth?
Macroeconomics
It concerns total spending and output in the whole economy.
Why does a country export more than it imports?
Global economy (macro)
It concerns a country’s transactions with the rest of the world.
The two branches are closely linked. Total spending in the economy is the sum of millions of individual spending decisions, and a recession in the whole economy changes the conditions every individual firm faces. Many issues, such as unemployment or climate change, need both a microeconomic and a macroeconomic view.
The nine key concepts
Nine key concepts run through every topic in economics. They are ideas that help to organise thinking about any economic issue, from the market for coffee to the growth of a whole country. Each is defined fully where it is first needed; the table gives a first introduction.
Key concept
Meaning
A first example
Scarcity
Resources are limited, while needs and wants are not.
A city has a fixed amount of water stored in its dams.
Choice
Because of scarcity, decision-makers must choose between alternatives, and every choice has an opportunity cost.
A government chooses between building a hospital and a motorway.
Efficiency
Getting the most useful output from scarce resources, with as little waste as possible.
A factory produces more cars with the same workers after reorganising its production line.
Equity
Fairness, especially in how income, wealth and opportunities are shared. It is a normative idea, different from equality (everyone having the same).
Free school meals for children from low-income families.
Economic well-being
Prosperity and quality of life: financial security, meeting basic needs, being able to make satisfying choices.
Access to healthcare, education and a secure income.
Sustainability
Meeting present needs without reducing the ability of future generations to meet theirs.
Limiting fishing so that fish stocks can recover.
Change
The economy is always changing: prices, technology, institutions and society.
Online shopping replacing many high-street shops.
Interdependence
Economic actors depend on each other, so one actor’s decisions affect others.
A drought in Brazil raises coffee prices for cafés in Europe.
Intervention
Government involvement in markets, usually because markets fail to achieve goals such as equity or sustainability.
A tax on cigarettes or a ban on single-use plastic bags.
The problem of choice
Needs and wants
People have needs and wants. Needs are the things required for survival: food, clean water, shelter, clothing and basic healthcare. Wants are everything people desire beyond these needs, such as a faster phone, a holiday abroad or a meal in a restaurant. The line between them is not always sharp, and it shifts over time: internet access was a luxury in 1995 but is close to a need today for work and education in many countries.
Economists assume that wants are unlimited. Once one want is satisfied, another appears: a household that buys its first car may soon want a second one, a bigger home or better schooling for its children. Society as a whole also has endless wants, such as better hospitals, cleaner energy, more police and lower taxes, all at the same time.
The factors of production
Goods and services are produced with resources, which economists call factors of production. They are grouped into four categories, and each one earns a payment, called a factor income, when it is used in production.
Factor of production
What it includes
Examples
Factor income
Land
All natural resources: what is on, under or above the land, and in the sea.
Farmland, oil and copper deposits, forests, fish stocks, rivers, the climate.
Rent
Labour
The physical and mental effort people put into production.
A nurse, a software engineer, a farm worker, a teacher.
Wages
Capital
Man-made goods used to produce other goods and services.
Machinery, tools, factories, delivery vans, computers, roads and ports.
Interest
Entrepreneurship
The ability to organise the other factors, take risks and start new businesses or ideas.
The founder of a start-up; a farmer who switches to a new crop.
Profit
The quantity and the quality of each factor both matter. Labour depends not only on the number of workers but also on their education, skills and health; land includes both its area and its fertility. Economists call the skills and knowledge of the workforce human capital, which grows through education and training.
Scarcity
Every factor of production is limited. There is a fixed amount of land, a limited number of workers with limited hours, and only so many machines at any moment. Because unlimited wants meet limited resources, not every want can be satisfied. This is the basic economic problem, scarcity.
Scarcity affects everyone, rich and poor. A billionaire still has only 24 hours a day and must choose how to spend them. A rich country still has a limited number of doctors and must decide which patients are treated first. Scarcity is a relationship between wants and resources, so it never disappears: as incomes rise, wants rise too.
Because of scarcity, every individual, firm and government faces a choice about how to use the resources available. A household chooses how to divide its income between rent, food and saving. A firm chooses which products to make and which machines to buy. A government chooses how to divide its budget between health, education, defence and other uses.
Goods that are scarce are economic goods: producing them uses resources that could have produced something else. A small number of goods are not scarce. These free goods, such as the air people breathe or seawater, exist in such quantities that using more of them does not mean anyone has to go without.
Whether a good is free depends on circumstances, not on its price. Clean air in a large city with heavy traffic is scarce, because keeping it clean requires giving up some car journeys or paying for cleaner engines. Seawater is free, but the desalinated drinking water made from it is an economic good, because desalination plants use land, labour, capital and energy. A good can also have a zero price and still be an economic good: a state school charges no fees, but the teachers and buildings it uses have other uses.
Scarcity and sustainability
Some resources are used up when they are used. Oil, gas, coal and metal ores are non-renewable: once extracted and used, they are gone. Others, such as forests, fish stocks, groundwater and fertile soil, are renewable, but only if they are used no faster than nature can replace them. When a renewable resource is used faster than it renews, it too becomes depleted.
This links scarcity to sustainability. Using resources to satisfy wants today can reduce the resources available to future generations. Overfishing can collapse a fish stock for decades; pumping groundwater faster than rain refills it can leave farmers without water; burning fossil fuels changes the climate on which future production depends.
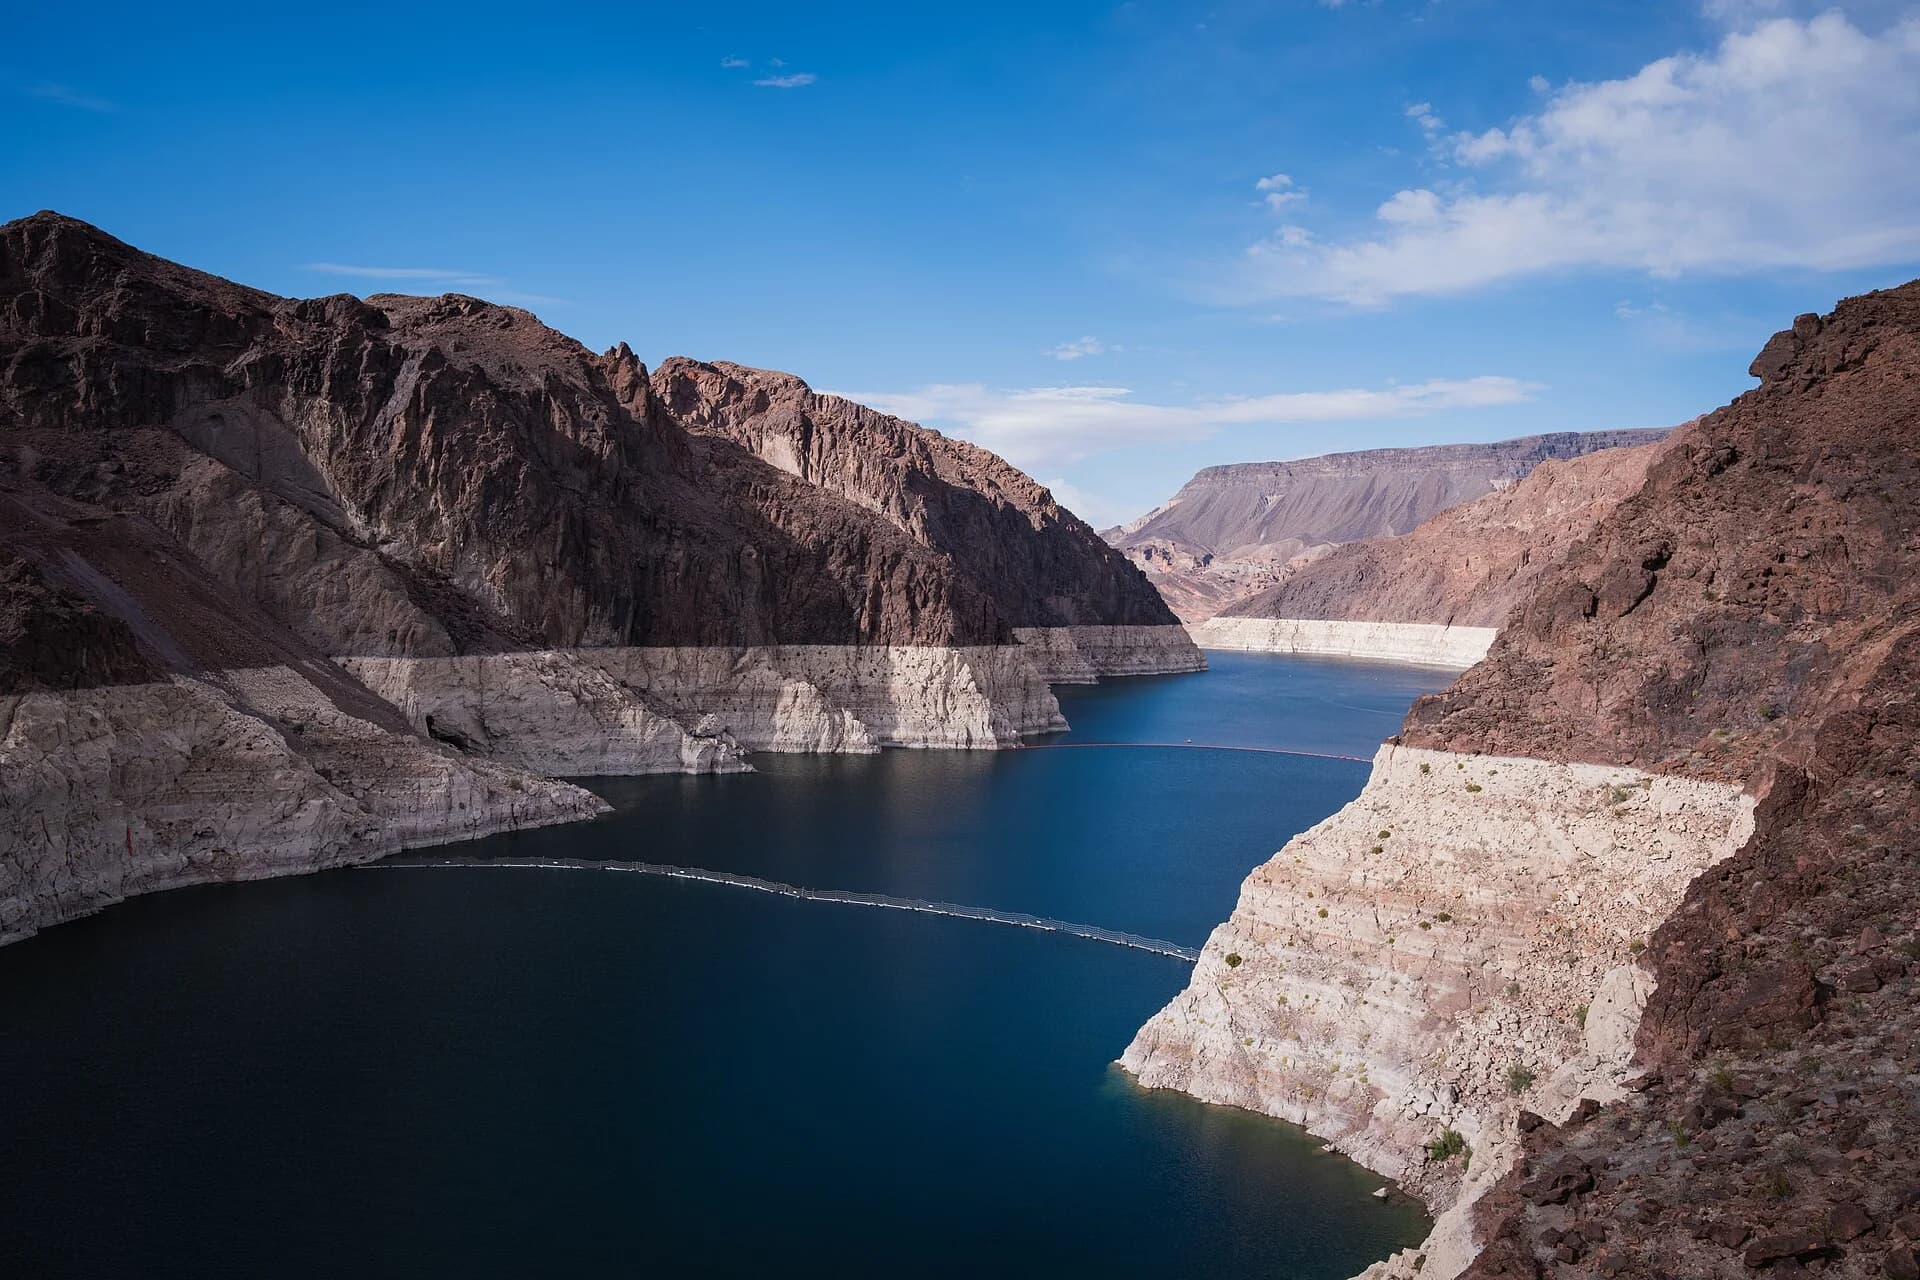
The pale band of rock around Lake Mead, a reservoir on the Colorado River in the United States, marks where the water once reached: water drawn faster than rain and snow replace it is a renewable resource used unsustainably. Photo: Christian David, CC BY-SA 4.0, via Wikimedia Commons.
Sustainability adds a time dimension to the problem of choice. A society chooses not only between different goods today, but also between consumption today and the resources it leaves for the future. Many of the hardest choices in economics, from carbon taxes to water rationing, involve this trade-off between present and future economic well-being.
Opportunity cost
The real cost of a choice
When resources are used for one purpose, they cannot be used for another. The cost of any choice is therefore what has to be given up to make it. Economists call this the opportunity cost: the value of the next best alternative that is forgone.
Opportunity cost is the next best alternative only, not every possible alternative. A student with a free Saturday might choose between working a shift at a café, revising for a test and playing football. If the student works, and revising was the second choice, the opportunity cost of working is the revision time lost, not the football as well, because the student could only have done one of them with those hours.
The same idea applies to every decision-maker. For a firm, the opportunity cost of building a new factory might be the research project it can no longer afford. For a government, the opportunity cost of a new aircraft carrier might be the hospitals that the same money, workers and materials could have built. For a farmer, planting cotton on a field means not planting wheat on it.
Opportunity cost for a whole country
Opportunity cost matters most clearly at the level of a whole economy, where a country’s factors of production are switched from one use to another. Between 1942 and 1945, the United States turned its car industry over to war production. All passenger car production in the United States had stopped by February 1942, and car plants built jeeps, trucks, tanks and aircraft engines instead. The opportunity cost of the military equipment was the cars American households could not buy until the war ended.
Governments face the same trade-off in every budget. Money, staff and equipment spent on defence cannot also be spent on schools or hospitals, so a choice to raise one is, in effect, a choice not to raise the others. A government that cuts taxes gives up the public services the tax revenue could have paid for.
The basic economic questions
Scarcity forces every society to answer three basic economic questions. They apply to every economy, whatever its size, wealth or political system.
Question
What it asks
Examples of the choices involved
What (and how much) to produce?
Which goods and services are made, and in what quantities, given that resources are limited.
Housing or offices; electric cars or petrol cars; more doctors or more engineers.
How to produce?
Which combination of factors of production and which technology is used.
A farm can use many workers and few machines, or few workers and many machines; electricity can come from coal or solar panels.
For whom to produce?
How the output is distributed among the people in the economy.
Who receives healthcare first; whether output goes to those who can pay most or is shared by need.
The first question is about choice and opportunity cost: producing more of one thing means producing less of another. The second is about efficiency: producing in a way that wastes as few resources as possible, and in a way that is sustainable. The third is about equity, because it decides who gains from what is produced.
The “for whom” question is usually answered by income: people with higher incomes can buy more. Some goods, however, are allocated by rules instead. During the COVID-19 pandemic, the first vaccines in the United Kingdom went to care home residents and their carers, then to people aged 80 and over and frontline health and care workers, following a priority list of nine groups set by expert advisers. The vaccines were scarce, and the government chose to share them by medical need and risk rather than by willingness to pay.
How economies answer the basic questions: economic systems
Societies answer the basic economic questions in different ways. The main difference is who decides: individual consumers and firms acting through a market, or the government. An economic system is the way a society organises the ownership of resources and makes these decisions.
A market is any arrangement in which buyers and sellers exchange a good, service or factor of production at a price. It can be a physical place, such as a fruit market, or an online platform, or simply a network of buyers and sellers who never meet, as in the market for oil. Economic systems can be placed on a spectrum, with the free market economy at one end, the planned economy at the other, and mixed economies in between.
The free market economy
In a free market economy, the factors of production are owned privately, by households and firms. Consumers decide what to buy and firms decide what to produce, each pursuing their own interests. The government’s role is limited to protecting property rights, enforcing contracts and keeping order.
The basic questions are answered by prices, through the price mechanism. What to produce is decided by consumer demand: if many people want a product, its price rises, it becomes more profitable, and firms make more of it. How to produce is decided by firms seeking the lowest cost, which rewards efficient methods. For whom is decided by who can pay: goods go to the consumers with the income and the willingness to buy them.
Supporters of free markets point to strong incentives to work, invest and innovate, wide consumer choice, and fast responses to changes in what people want. Critics point to the problems markets do not solve on their own. Some people have very low incomes and cannot afford basic needs; some goods, such as street lighting or national defence, are not provided at all because firms cannot charge for them; and firms may ignore the costs they impose on others, such as pollution. No country in the world is a pure free market economy.
The planned economy
In a planned economy (also called a command or centrally planned economy), the state owns most land and capital, and central planners decide what is produced, how and for whom. Production targets are set for each factory and farm, prices are fixed by the state, and workers may be assigned to jobs.
A planned economy can direct resources quickly towards national goals, such as heavy industry or defence, and can aim to give everyone access to basic goods, jobs, housing and healthcare. The Soviet Union industrialised rapidly in the 1930s in this way. The weaknesses are serious, however. Planners need enormous amounts of information about millions of products and the preferences of millions of people, which they rarely have. Without prices to signal what is wanted, planned economies often produce too much of some goods and too little of others, leading to queues and shortages. With little reward for effort or new ideas, incentives to work hard and innovate are weak.
A natural comparison is the Korean peninsula, divided in 1945 into two states that chose very different systems. North Korea kept a centrally planned economy; South Korea developed a market-based mixed economy. In 2024, South Korea’s gross national income per person was estimated at about 29 times North Korea’s. The comparison is not a controlled experiment, since many other factors differ, but it shows how much the choice of system can matter over several decades.
Sources: Bank of Korea estimates of North and South Korean GNI per capita (2025), as reported by the Korea Economic Institute of America (2025).
The mixed economy
Every real economy is a mixed economy: it combines a market sector, where private firms and consumers make most decisions through prices, with a public sector, where the government owns some resources, provides some goods and services, and regulates markets. The difference between countries is the balance between the two.
Governments in mixed economies typically provide or fund education, healthcare, roads and defence, pay pensions and unemployment benefits, tax incomes and spending, and set rules on safety, competition and the environment. Most other goods, from food and clothes to cars and phones, are produced by private firms and sold in markets. One way to measure the size of the government’s role is government spending as a percentage of a country’s total output (GDP).
Country
General government expenditure, % of GDP, 2024
France
57.2
Germany
49.4
Sweden
49.3
Brazil
45.7
United Kingdom
44.0
Japan
39.1
United States
37.9
South Africa
33.0
China
32.9
India
28.4
Nigeria
12.3
Sources: IMF, Fiscal Monitor data via IMF DataMapper, general government expenditure (accessed October 2026).
The table shows that even the United States, often described as a market economy, has government spending of over a third of its output, while France, with spending above half of GDP, still relies on private firms to produce most goods. Spending is only a partial measure: governments also influence the economy through laws and regulation, and some countries, such as China, keep large state-owned firms whose output is not counted as government spending.
Economies also move along the spectrum over time, which illustrates the key concept of change. From 1978, China began to replace central planning with market incentives: farm households were allowed to sell output above their quotas, private firms were permitted, and foreign investment was invited into special economic zones. China’s real GDP per person rose from $386 in 1978 to $13,119 in 2024 (constant 2015 US$), about 34 times higher. In the other direction, many market economies widened the government’s role during the COVID-19 pandemic, paying wages and supporting firms directly.
Sources: World Bank, World Development Indicators, GDP per capita (constant 2015 US$), China (2026).
Markets or intervention?
The debate over how far governments should intervene in markets runs through all of economics. Markets are good at coordinating the decisions of millions of people through prices and at rewarding efficiency and innovation. Governments can correct some of the things markets do badly: providing goods that markets underprovide, protecting the environment, and making the distribution of income fairer. Government intervention has costs and risks of its own, however, such as poor information, high administrative costs and decisions influenced by political pressure.
Free market economy
Planned economy
Mixed economy
Who owns resources?
Private households and firms
Mainly the state
Both: a private sector and a public sector
Who decides what to produce?
Consumers and firms, through prices
Central planners
Mainly markets, with government provision of some goods and services
How is output shared?
By ability to pay
By the state, often by need or by rule
Mainly by ability to pay, with taxes, benefits and free public services adjusting the outcome
Main strengths
Incentives, choice, efficiency, innovation
Can direct resources to national goals; access to basic goods
Combines market incentives with a safety net and public services
Main weaknesses
Inequality; some goods not provided; external costs ignored
Poor information, shortages and waste; weak incentives; little choice
The right balance is disputed; intervention can fail too
How much intervention is right depends partly on facts, such as whether a particular policy works, and partly on values, such as how much weight to give to equity relative to efficiency. These questions recur in every later topic, from price controls and carbon taxes to the role of governments in economic development.
The production possibilities curve (PPC) model
What the PPC shows
Economists use simplified models to explain how the economy works. The first is the production possibilities curve (PPC). It shows the different combinations of two goods or services that an economy can produce when it uses all its resources fully and efficiently.
The PPC is built on a set of assumptions that keep the model simple:
Two goods only. The economy produces just two goods (or two groups of goods, such as capital goods and consumer goods), so they can be drawn on two axes.
Fixed quantity and quality of resources. The amount of land, labour, capital and entrepreneurship does not change.
Fixed technology. The methods of production available do not change.
A fixed time period. The curve shows what can be produced in a given period, such as a year.
Full and efficient use of resources at every point on the curve: no factor of production is unemployed or wasted.
Real economies produce millions of goods, and their resources and technology change all the time, so the PPC is not a description of any real economy. Its value is that, by holding everything else fixed, it shows clearly how scarcity, choice and opportunity cost work.
Scarcity, choice and efficiency on the PPC
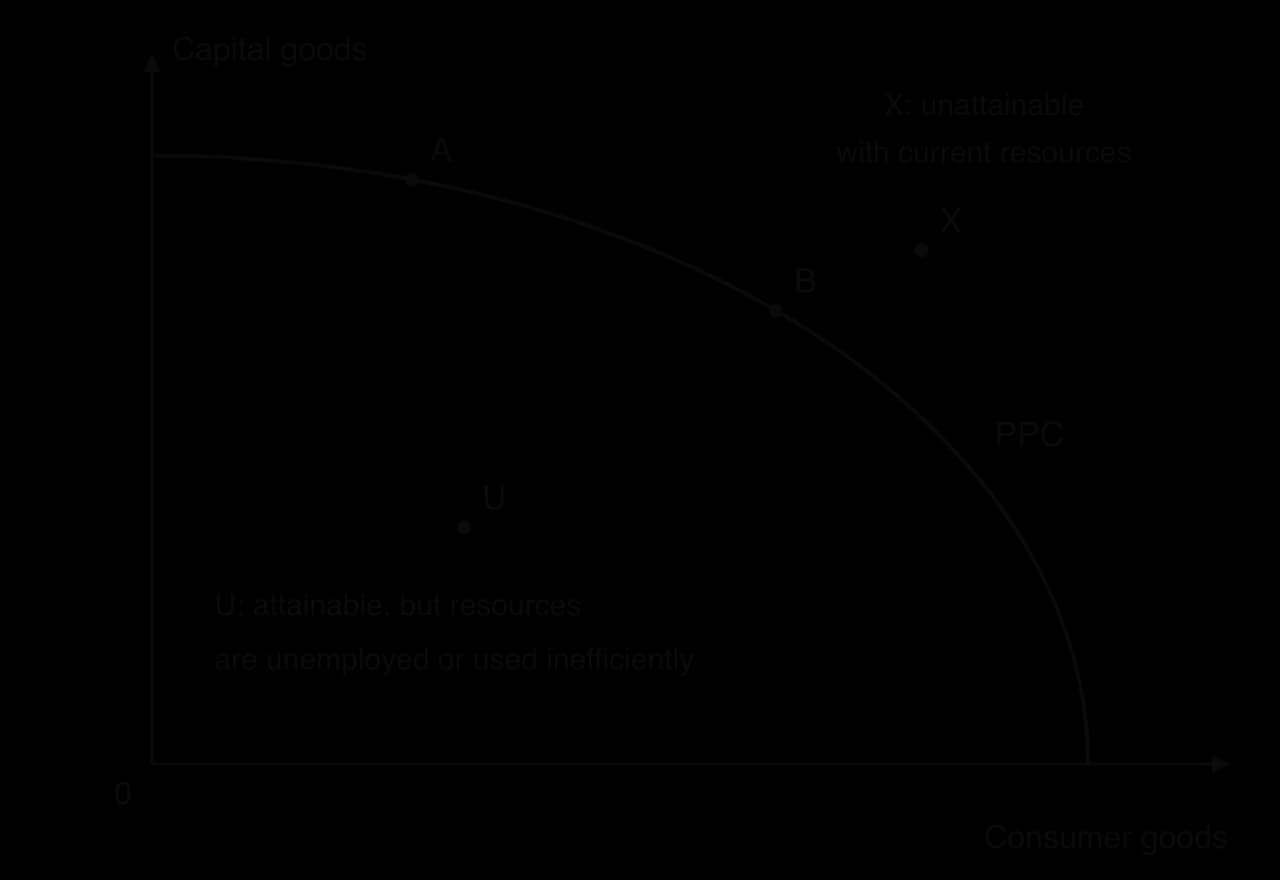
Points on the PPC (A, B) use all resources efficiently; a point inside it (U) means unemployed or wasted resources; a point outside it (X) cannot be reached with today’s resources and technology.
The diagram shows a PPC for capital goods (machines, factories, infrastructure) and consumer goods (food, clothes, phones). Each point on the curve is a combination the economy can just produce when all resources are used efficiently. Together, the points show the economy’s production possibilities.
The PPC illustrates scarcity because the economy cannot produce beyond the curve. Point X, outside the curve, would give more of both goods than A or B, but it is unattainable with current resources and technology. The curve is a boundary, set by the limited quantity of resources.
It illustrates choice because the economy must pick one point on (or inside) the curve. At A, it produces many capital goods and few consumer goods; at B, more consumer goods and fewer capital goods. Which point is chosen is the society’s answer to the “what to produce” question.
It illustrates efficiency because every point on the curve uses all resources in the best possible way. At A or B, it is impossible to produce more of one good without producing less of the other. This is productive efficiency.
Point U, inside the curve, shows unemployment of resources: some workers are out of work, machines stand idle or land is unused, or resources are used inefficiently. The economy could produce more of both goods, moving towards the curve, without giving anything up. Points inside the PPC therefore show productive inefficiency. A recession, when firms cut output and lay off workers, moves an economy to a point inside its PPC.
Being on the PPC does not mean that the economy produces the best combination for society. Every point on the curve is productively efficient, but only one combination matches what society values most. Producing the mix of goods that society wants most is called allocative efficiency, an idea developed further in the study of markets.
Opportunity cost on the PPC
Because the economy is fully using its resources on the curve, producing more of one good requires moving resources away from the other. The downward slope of the PPC therefore shows opportunity cost.
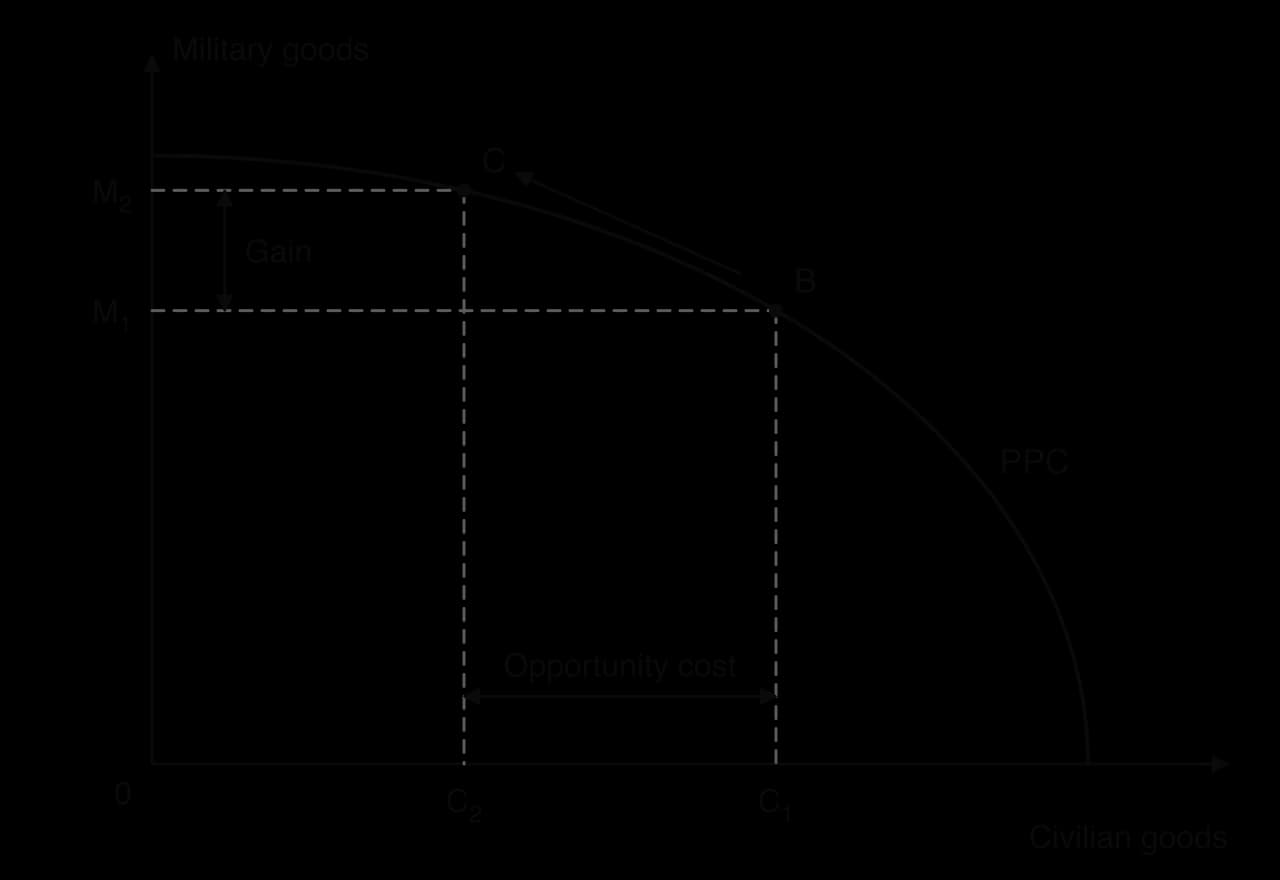
Moving from B to C raises military output from M₁ to M₂; the opportunity cost is the civilian output given up, C₁ − C₂.
The diagram shows an economy choosing between military goods and civilian goods, the trade-off the United States faced in 1942. At B, it produces C₁ civilian goods and M₁ military goods. To move to C, with more military goods (M₂), it must transfer workers, factories and materials out of civilian production, so civilian output falls to C₂. The opportunity cost of the extra M₁M₂ military goods is the C₁C₂ civilian goods given up.
The opportunity cost of one good is measured in units of the other good. If producing 100 more tanks means producing 2,000 fewer cars, then the opportunity cost of each tank is 20 cars, and the opportunity cost of each car is 1/20 of a tank.
Opportunity cost of one more unit of X=units of X gainedunits of Y given up
Increasing and constant opportunity cost
The shape of the PPC depends on how suitable the factors of production are for producing each good. Two cases are important: a curve bowed outwards from the origin (concave) and a straight line.
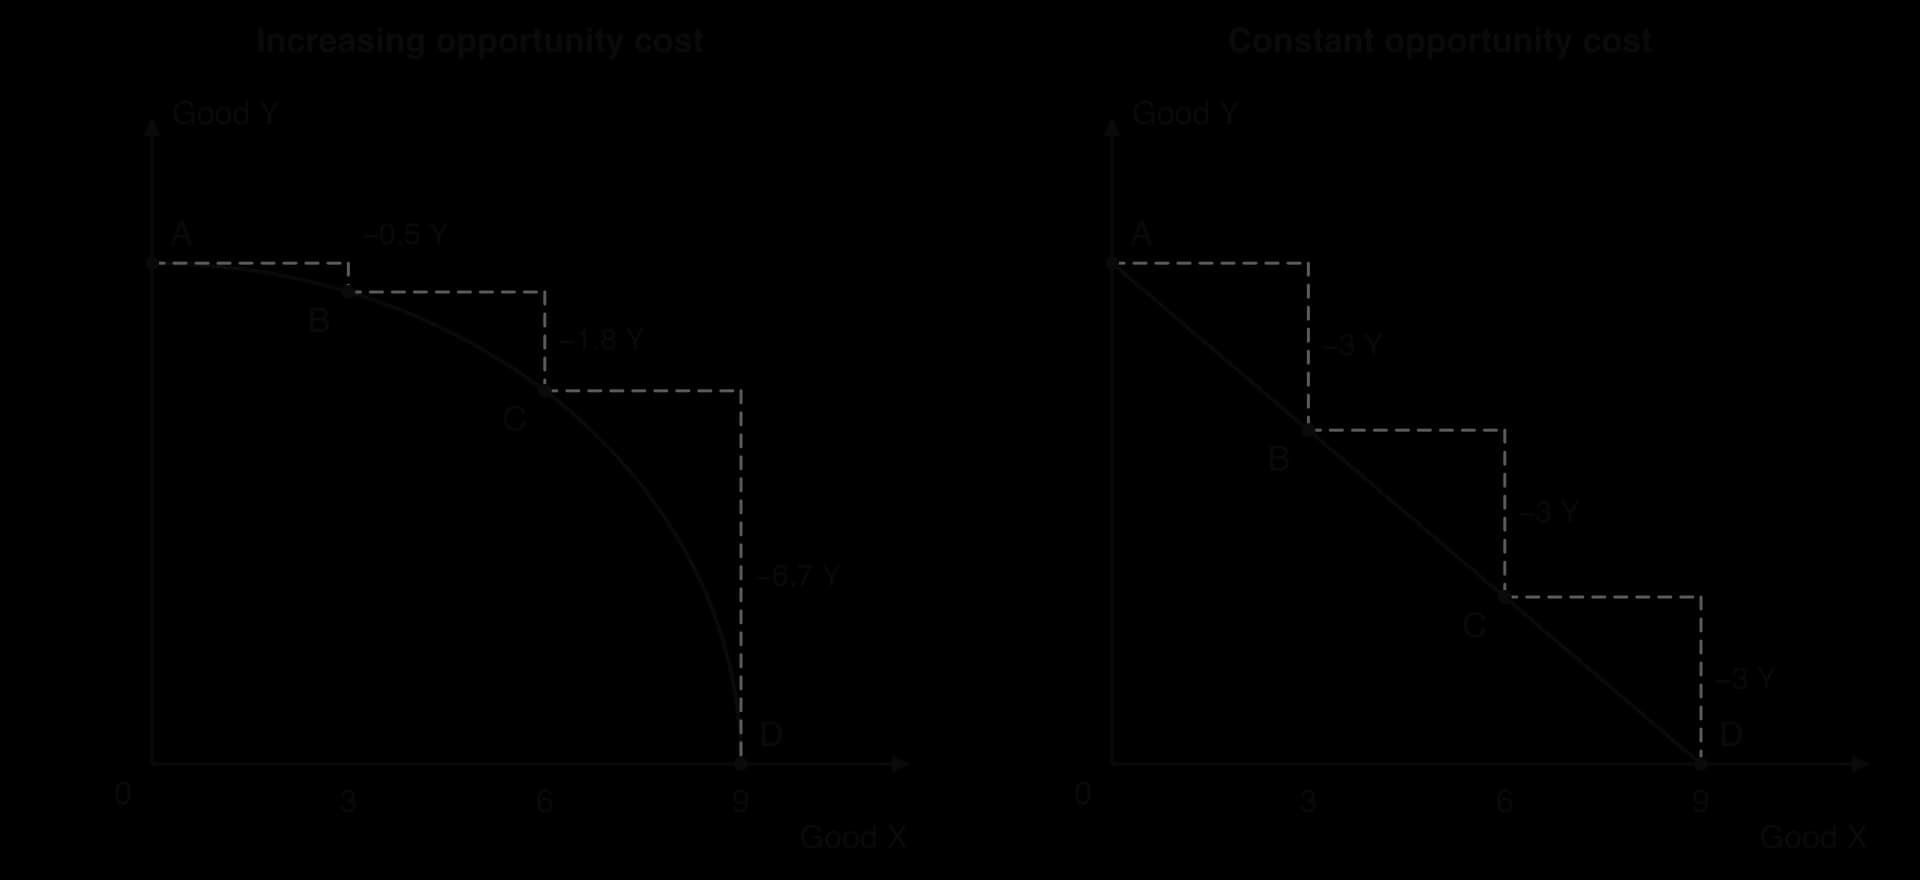
On the concave curve, each extra 3 units of X cost more Y (0.5, then 1.8, then 6.7); on the straight line, each extra 3 units always cost 3 units of Y.
Increasing opportunity cost: a concave PPC
In most economies, resources are not equally good at producing everything. Some land suits wheat but not vineyards; some workers are skilled engineers, others skilled nurses. When an economy starts producing more of good X, it first moves the resources that are best at producing X and worst at producing Y. Little Y is lost. As it keeps expanding X, it has to use resources that are less and less suited to X and better and better at Y, so each extra unit of X costs more and more units of Y.
This is increasing opportunity cost, and it makes the PPC bowed outwards (concave to the origin). In the left-hand panel, moving from A to B (the first 3 units of X) costs only 0.5 units of Y, from B to C costs 1.8, and from C to D costs 6.7. The curve becomes steeper as X increases.
Constant opportunity cost: a straight-line PPC
If resources were equally good at producing both goods, every unit of X would cost the same amount of Y, however much X was already produced. This is constant opportunity cost, shown by a straight-line PPC with a constant slope. In the right-hand panel, every extra 3 units of X cost exactly 3 units of Y.
Constant opportunity cost is realistic only for goods that use very similar resources, such as two types of shirt made by the same workers on the same machines. Increasing opportunity cost is the more common case for a whole economy, which is why the PPC is usually drawn bowed outwards.
Actual growth and growth in production possibilities
The PPC can show two different kinds of economic growth, which are easily confused. The difference lies in whether the economy moves towards its existing curve or the curve itself moves.
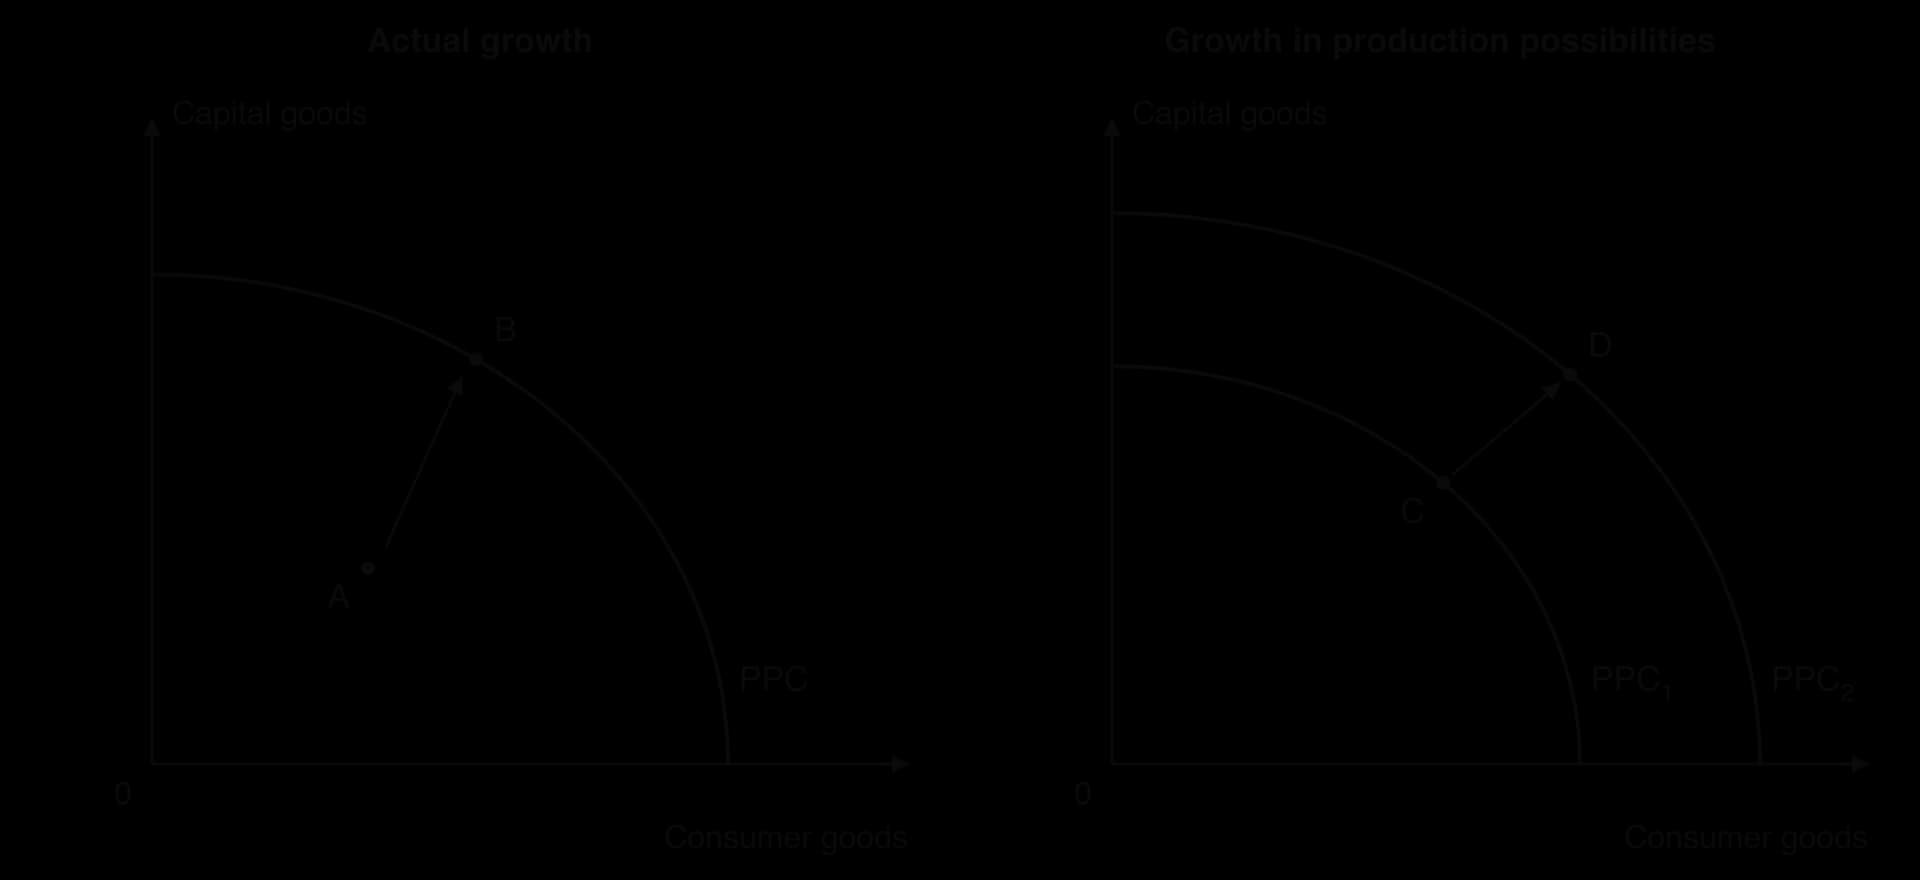
Left: moving from A, inside the PPC, to B on it is actual growth. Right: the outward shift from PPC₁ to PPC₂ is growth in production possibilities.
Actual growth: a movement towards the PPC
Actual growth happens when an economy produces more by using resources that were unemployed or used inefficiently. In the left-hand panel, the economy starts at A, inside its PPC, perhaps because of a recession. As unemployed workers find jobs and idle factories restart, output of both goods rises and the economy moves towards point B on the curve. The PPC itself does not move, because the economy’s resources and technology have not changed.
Growth in production possibilities: an outward shift of the PPC
Growth in production possibilities (often called potential growth) happens when the economy’s capacity to produce increases. In the right-hand panel, the PPC shifts outwards from PPC₁ to PPC₂, so combinations such as D that were unattainable before become possible. The economy needs an increase in the quantity or quality of its factors of production, or better technology.
The causes of an outward shift include:
More resources: a larger labour force (from population growth or immigration), the discovery of new natural resources, or more capital goods from investment.
Better resources: a more educated, skilled and healthier workforce (more human capital), or more fertile land through irrigation.
Better technology: new methods of production, such as automation, that produce more output from the same resources.
The PPC can also shift inwards when production possibilities fall. A war that destroys factories and kills workers, a major earthquake, the exhaustion of a mineral deposit, or the loss of fertile land to desertification all reduce the economy’s capacity. Unsustainable use of renewable resources can therefore, over time, shift a country’s PPC inwards.
If an improvement affects only one good, the PPC shifts out only along that good’s axis. A new high-yield variety of wheat raises the maximum quantity of wheat but not the maximum quantity of laptops, so the curve pivots outwards along the wheat axis while its end on the laptop axis stays in place.
Capital goods, consumer goods and future growth
The choice between capital goods and consumer goods today affects production possibilities tomorrow. An economy that devotes more resources to capital goods, such as machines, factories, roads and power stations, has fewer consumer goods now, but its larger stock of capital raises its capacity to produce in the future, shifting its PPC further outwards. An economy that consumes almost everything it produces enjoys more today but grows more slowly. This is a choice between present and future economic well-being, and it is one reason why investment matters so much for long-term economic growth.
YouTube
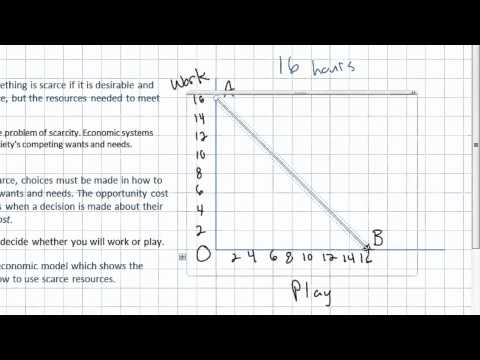
Jason Welker explains scarcity, opportunity cost and the PPC, including points inside and outside the curve and the two kinds of growth.
Modelling the economy: the circular flow of income
The second model shows how the main decision-makers in an economy are connected through flows of money, goods and services. The circular flow of income model shows how money moves round the economy as spending and income, and it is the starting point for measuring national income and for understanding why total output rises and falls.
The simple model: households and firms
The simplest version has two decision-makers. Households own the factors of production and supply them to firms: they work, rent out land and buildings, lend savings and start businesses. Firms hire these factors to produce goods and services, which they sell to households. Two markets connect them: factor markets, where households sell their land, labour, capital and entrepreneurship, and product markets, where firms sell goods and services.
Money flows one way round the loop (spending and factor incomes); real flows of goods, services and factors go the other way.
The diagram shows two pairs of flows moving in opposite directions. The real flows (dashed) are factors of production going from households to firms, and goods and services going from firms to households. The money flows (solid) go the other way: firms pay households factor incomes (wages, rent, interest and profit), and households use that income to buy the goods and services firms produce.
In this simple model, all income is spent and all spending becomes someone’s income. Every dollar a household spends becomes revenue for a firm, which uses it to pay wages, rent, interest and profit to households, who spend it again. The flow is circular, and it stays the same size from one period to the next. This leads to an important identity: the total value of spending in an economy equals the total value of income, which equals the total value of output.
The model shows interdependence clearly. Households depend on firms for their incomes and the goods they buy; firms depend on households for their workers and their customers. If households cut their spending, firms’ revenues fall, they hire fewer workers, and household incomes fall in turn.
Leakages and injections
Real economies have more than two decision-makers. Three more are added to complete the model: the financial sector (banks and other financial institutions), the government, and the foreign sector (firms and households in other countries). Each of them takes money out of the circular flow and puts money back in.
Leakages (also called withdrawals) are income that is not passed on as spending on domestic goods and services. There are three:
Saving (S): the part of household income that is not spent but kept, often in banks.
Taxes (T): income tax, taxes on spending and other taxes paid to the government.
Imports (M): spending on goods and services produced abroad, which becomes income for foreign firms rather than domestic ones.
Injections are additions to the circular flow that do not come from household consumption. There are also three:
Investment (I): spending by firms on capital goods, such as machines and buildings, often financed by borrowing from the financial sector.
Government spending (G): spending by the government on goods and services, such as school buildings, medical equipment and roads.
Exports (X): spending by foreign households, firms and governments on goods and services produced in the domestic economy.
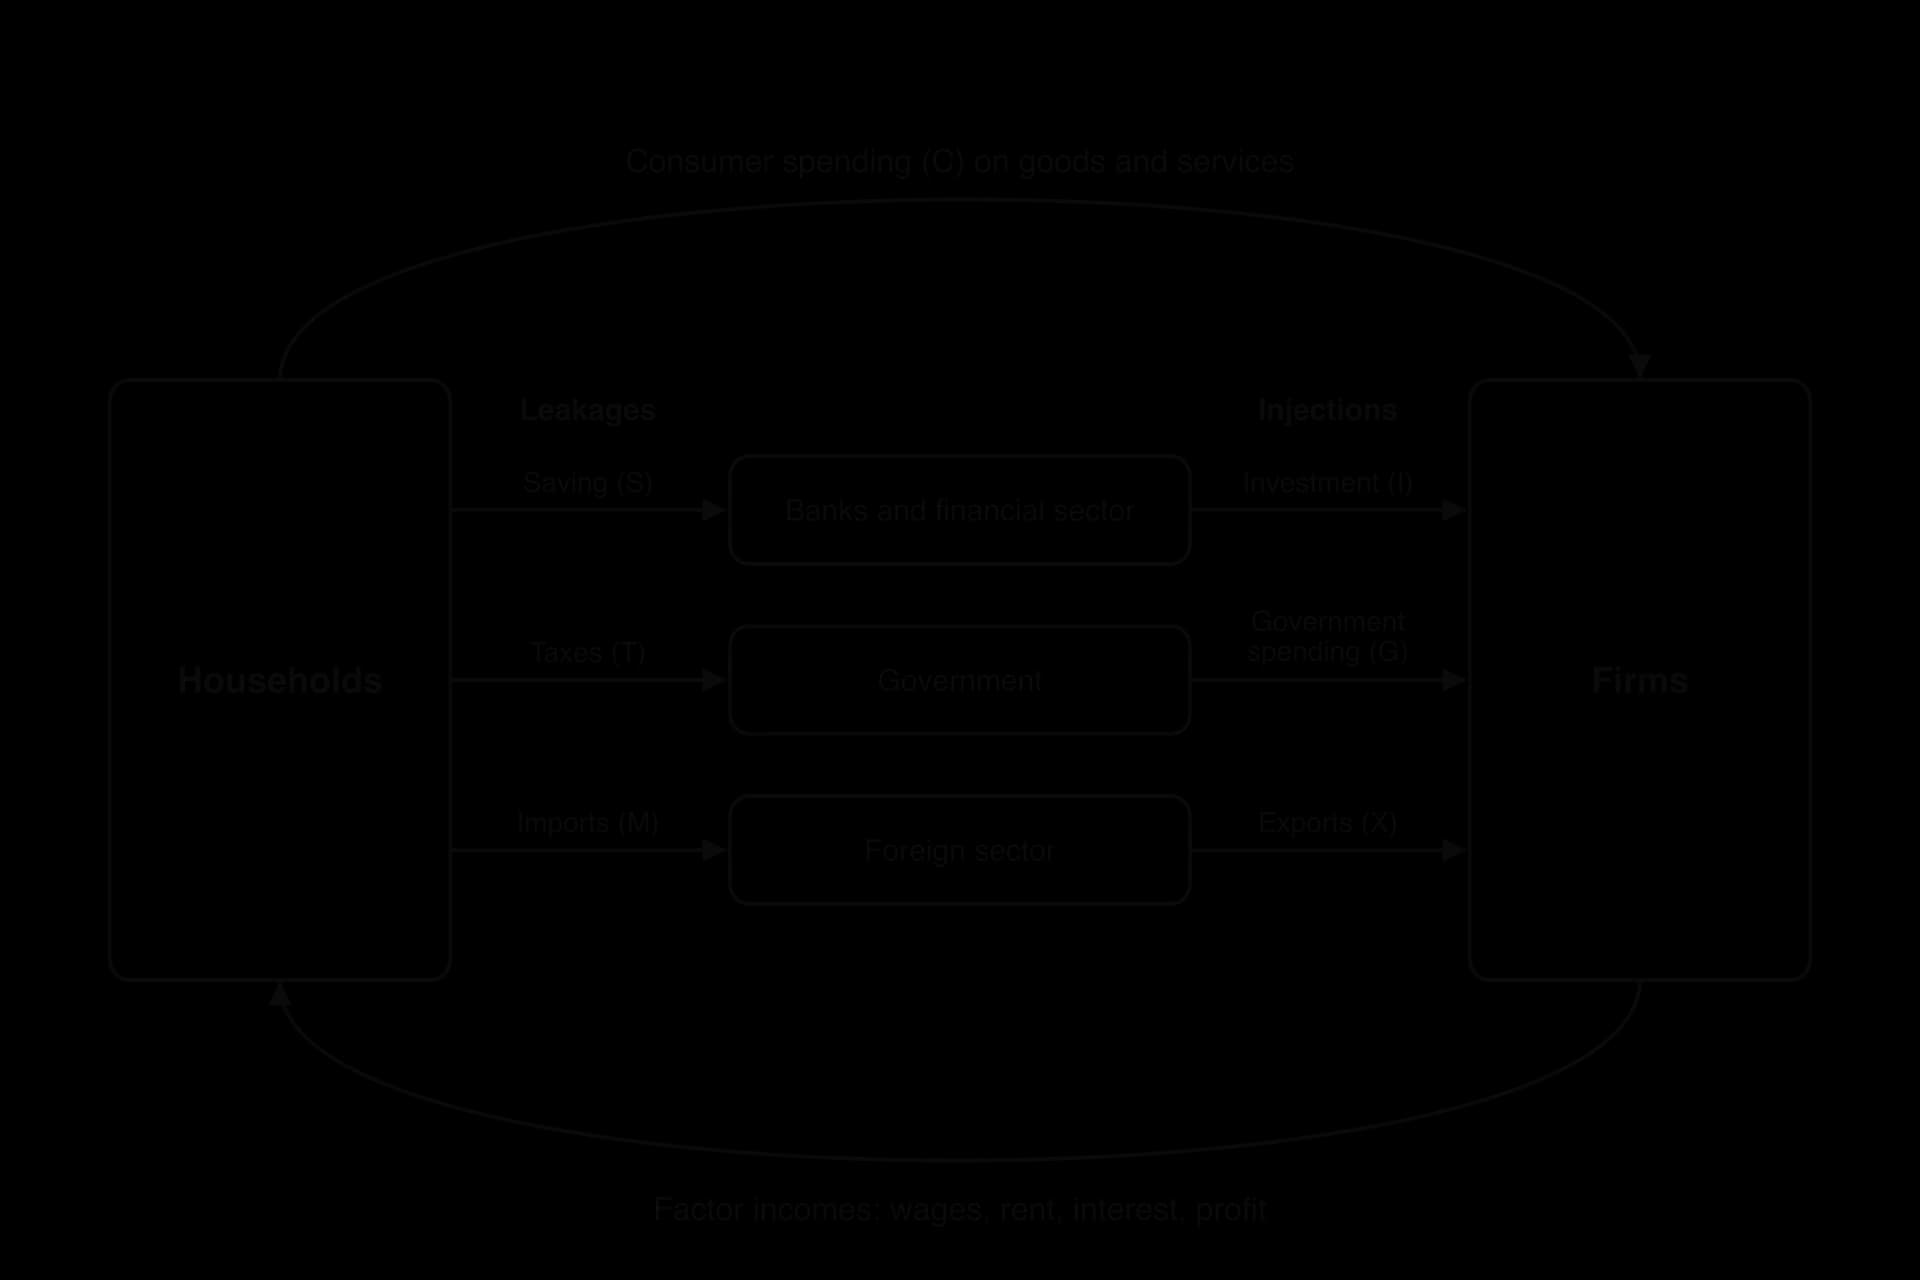
Each leakage is paired with a sector and an injection: saving and investment pass through the financial sector, taxes and government spending through the government, imports and exports through the foreign sector.
The diagram pairs each leakage with an injection through the sector that links them. Banks take in households’ savings and lend them to firms that want to invest. The government collects taxes and spends on goods, services and wages. The foreign sector receives spending on imports and buys the country’s exports. The pairs are not necessarily equal: there is no reason for this year’s saving to match this year’s investment, or for the government to spend exactly what it collects in taxes.
Saving rates can change quickly. In the United States, households saved 7.5% of their disposable income in February 2020; in April 2020, during the first COVID-19 lockdowns, the saving rate jumped to 31.8%, the highest monthly rate since the series began in 1959, as households could not spend on travel, restaurants and many shops. This sudden rise in a leakage was one reason why spending and output fell so sharply in 2020.
Sources: US Bureau of Economic Analysis, personal saving rate (PSAVERT), via FRED, Federal Reserve Bank of St Louis (2026).
Why leakages and injections change the size of the flow
The size of the circular flow measures the level of economic activity: total spending, income and output. It changes whenever total leakages and total injections are not equal.
If injections are greater than leakages (I + G + X > S + T + M), more money enters the flow than leaves it. Total spending rises, firms sell more and produce more, and incomes and output grow.
If leakages are greater than injections (S + T + M > I + G + X), more money leaves the flow than enters it. Spending falls, firms cut output and jobs, and incomes and output shrink.
If leakages equal injections (S + T + M = I + G + X), the flow stays the same size, and the economy is in equilibrium.
The condition for equilibrium is about the totals. Saving need not equal investment, nor taxes equal government spending, nor imports equal exports; what matters is whether all leakages together equal all injections together. A government that spends more than it collects in taxes, for example, can be balanced by households that save more than firms invest.
Interdependence in the circular flow
The full model shows how closely the five decision-makers depend on each other. Households depend on firms for jobs and on the government for public services; firms depend on households, the government and foreign buyers for sales, and on banks for finance; the government depends on taxes paid by households and firms; the foreign sector buys exports and supplies imports.
A change anywhere in the model spreads through the rest of it. A recession in a major trading partner cuts that country’s demand for imports, which reduces the home country’s exports, firms’ revenues and households’ incomes. A rise in interest rates by the central bank discourages borrowing, reducing investment. The key concept of interdependence describes these links, and the circular flow is the clearest picture of them.
YouTube
EconplusDal builds the circular flow of income from households and firms, then adds saving, taxes and imports as leakages and investment, government spending and exports as injections.
Strengths and limits of the circular flow model
Like the PPC, the circular flow is a simplification. It shows clearly why spending, income and output are linked, why changes in saving, taxes or trade affect the whole economy, and why national income can be measured by adding up spending, incomes or output. These ideas are the foundation of macroeconomics.
The model leaves a lot out, however. It does not show prices or inflation, it treats all households and firms as if they were the same, and it ignores the distribution of income between rich and poor. It also leaves out the natural environment: production uses resources from nature and returns waste and pollution to it, which matters for sustainability. Firms also spend on each other’s products, and governments make transfer payments, such as pensions, which redistribute income without buying any output; neither appears in the basic diagram.
Case study: Cape Town’s “Day Zero” water crisis, 2017–18
Cape Town, South Africa’s second-largest city, depends on six major dams that collect winter rainfall. South Africa is a dry country: in 2022 its renewable internal freshwater resources were about 718 cubic metres per person, compared with a world average of about 5,390. After good rains in 2014, three dry winters followed, and 2017 was the driest year in Cape Town since 1933. At the same time, the city’s population had grown from about 2.4 million in 1995 to an estimated 4.1 million in 2015, an increase of 71%, while dam storage capacity had grown by only 17%.
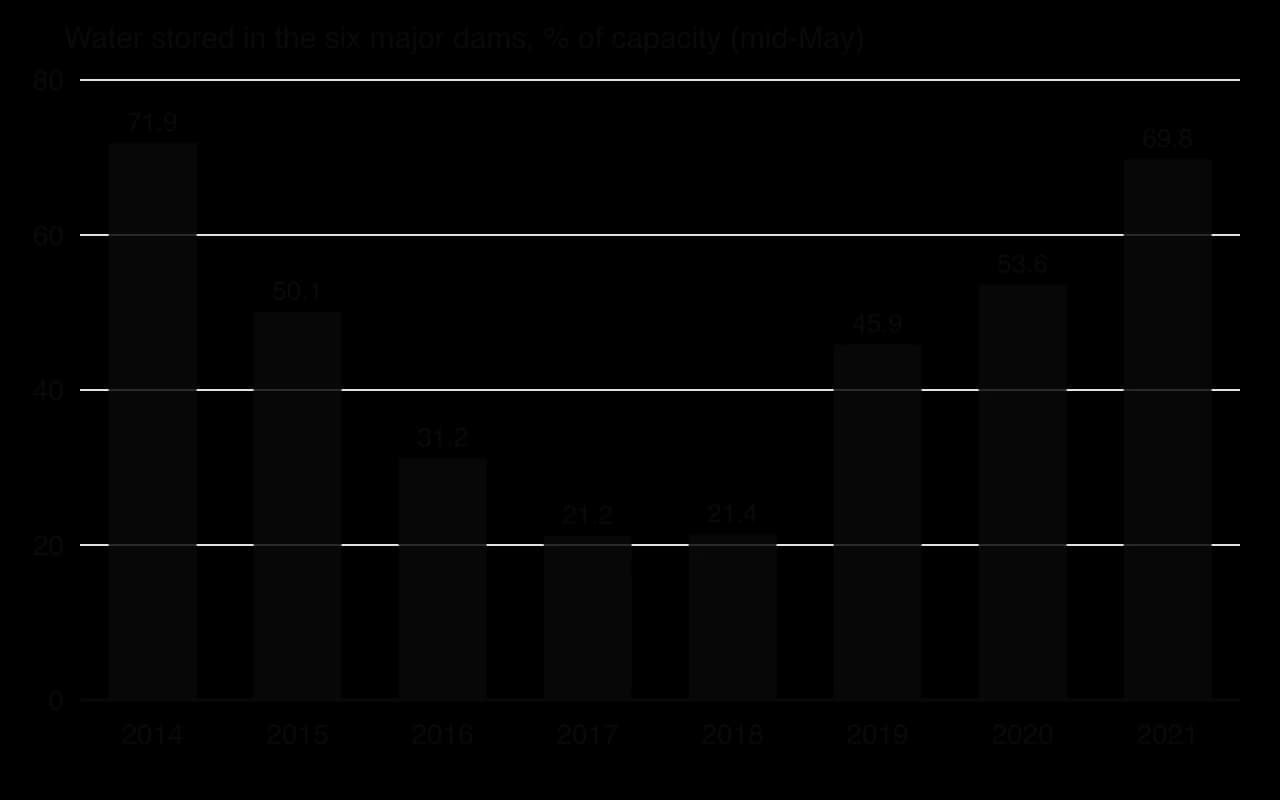
Water stored in Cape Town’s major dams fell from 71.9% of capacity in May 2014 to about 21% in May 2017 and May 2018, then recovered after the rains returned. Source: City of Cape Town dam level reports, compiled by Wikipedia (2026).
The chart shows how quickly the stored water ran down. By mid-May in both 2017 and 2018, the dams held only about a fifth of their capacity, and the water nearest the bottom of a dam is difficult to use. In January 2018 the city forecast that “Day Zero”, the day the dams would reach 13.5% of capacity, would arrive on 22 April 2018, and then brought the forecast forward to 12 April. On Day Zero, the taps in most homes would be turned off and residents would have to collect a ration of 25 litres per person per day from about 149 collection points.
How the city answered the basic economic questions
Water became extremely scarce, and the city and national government had to decide who would get it. They used a mix of rules and prices, the tools of a mixed economy. Household restrictions were tightened step by step: to 100 litres per person per day from June 2017, to 87 litres from September 2017, and to 50 litres per person per day from 1 February 2018. Water tariffs were raised steeply, with the highest rates for households that continued to use large amounts, and fines and flow-limiting devices were used against heavy users.
The burden was not shared equally across uses. Urban users take roughly 70% of the water from the supply system and farmers roughly 30%, and in 2018 farmers’ allocations were cut by around 60%, compared with a target cut of about 45% for urban users. The opportunity cost of keeping water in city taps was lost farm output: estimates put agricultural losses at about R5.9 billion (around $400 million) and some 30,000 jobs in the Western Cape. This was a direct answer to the “for whom” question, and it involved a choice between the economic well-being of city residents and of rural workers.
The response worked. Water use fell by more than half, to around 500 million litres a day by March 2018, and Day Zero was pushed back repeatedly. When strong winter rains returned from June 2018, the dams began to refill, and on 28 June 2018 Day Zero was postponed indefinitely. Restrictions were eased in stages as dam levels recovered.
What the case shows
The crisis illustrates the core ideas of economics in one setting. Scarcity became visible when a resource that most residents had treated as plentiful nearly ran out. Choice and opportunity cost appeared in every decision: water for gardens or for drinking, for cities or for farms, spending on emergency supply or on other public services. The city also considered building large desalination plants, but abandoned most of these plans because the cost per litre was too high, so it relied on cutting demand and on smaller projects such as drawing on groundwater.
Key concept
How it appears in the Cape Town crisis
Scarcity
Stored water fell to about a fifth of dam capacity while demand kept rising.
Choice and opportunity cost
Water kept for city taps meant water taken from farms, with lost output and jobs.
Sustainability
Demand had grown faster than supply capacity for decades, leaving no margin for a severe drought.
Intervention
Limits, steep tariffs for heavy users, fines and cuts to farm allocations.
Equity
How to protect low-income households, who already used little water, while cutting total use.
The underlying sustainability problem was that demand had grown faster than the supply system for decades, so a drought of a severity estimated to occur about once in 300 years pushed the system to the edge. Without intervention, an unregulated market would have answered the “for whom” question by price alone.
The case has limits as evidence. It is one city, in one drought, and the rains that ended the crisis were good fortune rather than policy. Restrictions also depended on public cooperation that may be hard to repeat, and estimates of agricultural losses vary widely. Even so, it shows clearly how a society facing acute scarcity has to make choices about what, how and for whom, and how the answers combine prices, rules and shared effort.
Sources: City of Cape Town, dam level reports and water dashboard (2014–2021) and Western Cape Government water updates, as compiled in Wikipedia, “Cape Town water crisis” (accessed October 2026); World Bank, World Development Indicators, renewable internal freshwater resources per capita (2026).
Exam practice
Scarcity, opportunity cost, economic systems, the PPC and the circular flow appear across all the papers. They are rarely the subject of a whole question on their own, but their definitions, PPC diagrams and the circular flow model are often needed within questions on markets, macroeconomics and development. Paper 1 questions can ask you to use a PPC or the circular flow; Paper 2 can ask you to define terms from this topic or to draw and explain a PPC using data from the text.
Label every PPC as PPC (or PPC₁ and PPC₂ after a shift), name the two goods on the axes and refer to the marked points by their letters in your writing.
Paper 2-style short items:
Define the term opportunity cost. [2]
Draw a PPC diagram to show the effect of a recession on an economy that was previously producing on its PPC. [4]
Using a PPC diagram, explain why an improvement in education could increase a country’s production possibilities. [4]
Using the circular flow of income model, explain how a fall in exports could reduce national income. [4]
Summary
Economics is the social science that studies how scarce resources are used to satisfy needs and wants; microeconomics studies individual markets and macroeconomics the whole economy.
The four factors of production are land, labour, capital and entrepreneurship, earning rent, wages, interest and profit.
Scarcity (limited resources, unlimited wants) forces choices, and every choice has an opportunity cost: the next best alternative given up. Free goods have no opportunity cost.
Every economy must decide what, how and for whom to produce; free market, planned and mixed economies answer these questions differently, and all real economies are mixed.
The PPC shows scarcity, choice, opportunity cost and productive efficiency; points inside it show unemployment of resources. A concave PPC shows increasing opportunity cost, a straight line constant opportunity cost.
Actual growth is a movement from inside the PPC towards it; growth in production possibilities is an outward shift of the curve from more or better resources or technology.
The circular flow of income links households, firms, the financial sector, the government and the foreign sector; leakages (S, T, M) and injections (I, G, X) determine whether national income rises or falls.
Scarcity is linked to sustainability: using resources faster than they renew reduces the production possibilities of future generations.
Self-check
To do:
I can explain why economics is a social science and give examples of microeconomic and macroeconomic questions.
To do:
I can name the four factors of production and the factor income each one earns.
To do:
I can define scarcity and opportunity cost precisely and distinguish free goods from economic goods.
To do:
I can explain the link between scarcity and sustainability with an example.
To do:
I can explain how free market, planned and mixed economies answer the three basic economic questions.
To do:
I can draw a PPC and use it to show scarcity, choice, opportunity cost, efficiency and unemployment of resources.
To do:
I can draw and explain PPCs with increasing and constant opportunity cost, and calculate opportunity costs from a table.
To do:
I can distinguish actual growth from growth in production possibilities on PPC diagrams.
To do:
I can draw the circular flow of income with all leakages and injections and explain what happens when they are unequal.
To do:
I can use the nine key concepts to analyse a real example such as Cape Town’s water crisis.
Markbands (best fit)
Level
Marks
Descriptor
0
0
The work does not reach a standard described by the descriptors below.
1
1–2
Little understanding of the specific demands of the question. Relevant economic theory is stated but not relevant. Economic terms are stated but not relevant.
2
3–4
Some understanding of the specific demands of the question. Relevant economic theory is described. Some relevant economic terms are included.
3
5–6
The specific demands of the question are understood but only partially addressed. Relevant economic theory is partly explained. Some relevant terms are used appropriately. Where appropriate, relevant diagram(s) are included.
4
7–8
The specific demands of the question are understood and addressed. Relevant economic theory is explained. Relevant terms are used mostly appropriately. Where appropriate, relevant diagram(s) are included and explained.
5
9–10
The specific demands of the question are understood and addressed. Relevant economic theory is fully explained. Relevant terms are used appropriately throughout. Where appropriate, relevant diagram(s) are included and fully explained.
(b)
Using real-world examples, evaluate the view that the price mechanism is the best way to allocate scarce resources.
[15]15 marks
Markscheme (b)
Answers may include:
Terminology: price mechanism, signalling, incentive and rationing functions of price, allocative efficiency, market failure, government intervention, planned economy.
Explanation: in competitive markets, changes in relative prices signal where resources are wanted and give producers an incentive to reallocate them; prices ration goods to those most willing and able to pay; at the competitive equilibrium marginal benefit equals marginal cost, so social surplus is maximized and allocative efficiency is achieved, without the information problems faced by central planners.
Diagram(s): demand and supply diagram showing a rise in demand, a higher price and an extension of supply as resources are reallocated; may show an externalities diagram with a welfare loss where the market over- or under-allocates resources.
Synthesis/evaluation: the price mechanism fails where there are externalities, public goods, common pool resources or (for HL candidates) asymmetric information and market power; it allocates according to ability to pay, so outcomes may be inequitable for necessities such as healthcare or housing; prices may be volatile (agricultural markets); government intervention can itself fail (information gaps, shortages under price controls, inefficiency in state enterprises); most real economies are mixed, suggesting that the price mechanism works best for most private goods while government is needed for others; consideration of the word 'best' and of alternatives such as planning or direct provision; a reasoned judgement.
Examples: shortages and queues in the former Soviet Union under central planning; Venezuela's price controls on food from the 2000s and the resulting shortages; the reallocation of resources towards electric vehicles and batteries as relative prices and demand changed; the failure of markets to provide clean air without carbon pricing, such as the EU Emissions Trading System (EU ETS); state provision of healthcare through the UK National Health Service (NHS).
For 'best' questions, a maximum of [12] should be awarded where no alternative methods of allocation are considered.
N.B. Terminology, theory, diagrams and examples given in part (a) and referred to in part (b) should be rewarded.
Examiners should be aware that candidates may take a different approach which, if appropriate, should be rewarded.
Markbands (best fit)
Level
Marks
Descriptor
0
0
The work does not reach a standard described by the descriptors below.
1
1–3
Little understanding of the specific demands of the question. Theory is stated but not relevant. Terms are not relevant. No synthesis or evaluation. Real-world examples are identified but not relevant.
2
4–6
Some understanding of the demands. Relevant theory is described. Some relevant terms are included. Synthesis or evaluation is superficial. A relevant real-world example is identified.
3
7–9
The demands are understood but only partially addressed. Theory is partly explained. Some terms are used appropriately. Relevant diagram(s) are included where appropriate. Synthesis or evaluation is appropriate but lacks balance. Example(s) are identified and partly developed in context.
4
10–12
The demands are understood and addressed. Theory is explained. Terms are used mostly appropriately. Diagram(s) are included and explained. Synthesis or evaluation is appropriate and mostly balanced. Example(s) are identified and developed in the context of the question.
5
13–15
The demands are understood and addressed. Theory is fully explained. Terms are used appropriately throughout. Diagram(s) are included and fully explained. Synthesis or evaluation is effective and balanced. Example(s) are identified and fully developed to support the argument.
Question 2 · ECON-0000525 marks
Economies differ in the extent to which resources are allocated by markets or by the state.
(a)
Distinguish between a free market economy and a planned economy in the way each answers the basic economic questions.
[10]10 marks
(b)
Using real-world examples, discuss the view that government intervention in markets does more harm than good.